

Introduction
Legitimation theory “predicts that the Supreme Court’s close association with the Constitution and powerful symbols of institutional legitimacy will pull Americans’ attitudes toward positions adopted by the Court” (Ura, Reference Ura2014, 110).Footnote 1 Policy legitimation can take at least two forms. At a basic level, the Supreme Court can increase acceptance of a policy as constitutionally permissible, even if people continue to disagree with the desirability of such policy. Going beyond acquiescence, Supreme Court decisions may change attitudes by increasing support for the position it takes in resolving a case.
There is little research explicitly analyzing the connection between policy legitimation and perceptions of the Court legitimating the policy. The one study we know of to directly theorize about and then test the relationship between policy legitimation and Court support is Mondak (Reference Mondak1992), in which he presented his “political capital” hypothesis. Instead of arguing that policy legitimation is automatically associated with a more favorable view of the Court, he suggested that legitimacy functions as an expendable political capital: “The Supreme Court can increase public acceptance of otherwise unpopular rulings, but in doing so the Court threatens its own institutional foundation” (458).
We test the political capital hypothesis using a survey experiment in which participants learn about a Supreme Court decision to uphold a university’s affirmative action admissions program. As expected, we find that the Court’s decision legitimates affirmative action policy in terms of its constitutionality and in terms of affirmative policy support. The effect is quite limited, however, with only Democrats who are pre-disposed to support the decision developing more positive policy views. These positive reactions to the decision were not coupled with more positive views of the Court. Republicans (who are more prone to oppose affirmative action policies) developed negative views of the institution sponsoring the pro-affirmative action decision. That is, the decision caused a greater tendency for Republicans to perceive of the Supreme Court as a political institution, to think that it is out of touch with the American public, and to make it a more prominent electoral issue.
This article makes at least three important contributions. First, we examine the effect of a judicial decision holistically. Mondak’s lament in 1992 that policy legitimation and changes in Court support are studied in isolation holds true today. Rarely are the effects of a decision on views of policy and on views of the Court studied in tandem, leading to incomplete inferences.Footnote 2 Second we test the political capital hypothesis for the first time using a nationally representative sample. Third, while Mondak focused on decisions which all respondents were predisposed to find disagreeable, we select a salient partisan issue in which the public has clearly divided policy acceptance proclivities, allowing us to consider the political capital hypothesis in the context of both favorable and unfavorable decisions.
Policy legitimation
Policy legitimation is assumed to be one of the Court’s most basic democratic functions (Dahl, Reference Dahl1957; Hall and Ura, Reference Hall and Ura2015). We consider two ways in which the Court might legitimate policy when it adjudicates the constitutionality of policy. First, the Supreme Court can cause the public to accept a policy as constitutionally permissible. The Court has long claimed for itself the role of being “the ultimate expositor of the constitutional text.”Footnote 3 The capacity of the Court to convince the public that it is right on the constitutional merits is central to its authority as a constitutional tribunal. We therefore expect that when the Court rules a policy is constitutional, the public will subsequently agree that the policy is constitutional.
Second, the Court may cause an increase in support for the underlying policy merits of the policy which it has sustained as constitutionally permissible. Such an effect goes beyond acquiescence and is suggestive of an institution with substantial credibility. We are particularly interested in this second aspect of legitimation. The first aspect of legitimation is generally referred to as “acceptance” in the literature (Gibson, Lodge, and Woodson, Reference Gibson, Lodge and Woodson2014). We refer to this second element, related to affirmative support for policy, as “policy support.” The Court expressly disclaims for itself the power to review whether policies are good policies,Footnote 4 so if it persuades the public that policies are good policies it would speak to a persuasive power that the Court exercises.
Researchers assume that the Court’s policy-legitimating capacity is derived from its legitimacy: “courts, through their institutional legitimacy, can persuade citizens to change their views on the substantive issues of judicial rulings, or at least to acquiesce to decisions with which they disagree” (Gibson, Lodge, and Woodson, Reference Gibson, Lodge and Woodson2014, 837–838). If people view the Court as a legal institution—one which makes decisions based on legal principles rather than politics—then they may see policies which the Court sustains as permissible or even desirable (Tyler, Reference Tyler2006). People may be less deferential to policies sustained or created by explicitly political institutions (Bartels and Mutz, Reference Bartels and Mutz2009).
For decades researchers have shown interest in understanding these legitimacy-conferring capacities of the United States Supreme Court. It was Robert Dahl (Reference Dahl1957, 580) who first proposed that due to “the unique legitimacy attributed to its interpretations of the Constitution,” the Court holds the capability to “confer legitimacy” on the policies it creates or sustains through its legal decisions. In general, scholars have provided empirical support for the argument that the Court can legitimate policy through its decisions (Mondak, Reference Mondak1994; Clawson, Kegler, and Waltenburg, Reference Clawson, Kegler and Waltenburg2001; Gibson, Caldeira, and Spence, Reference Gibson, Caldeira and Spence2005; Bartels and Mutz, Reference Bartels and Mutz2009; Hanley, Salamone, and Wright, Reference Hanley, Salamone and Wright2012). Whether and how strongly the Court legitimates policy can vary among subsets of the population (Franklin and Kosaki, Reference Franklin and Kosaki1989; Christenson and Glick, Reference Christenson and Glick2015).
The political capital hypothesis
This discussion leads us to an important question: what is the role of the Court’s public standing or image when it comes to policy legitimation? It is possible that how people view the Court may be a consequence of reactions to its decisions rather than simply a cause of those reactions. Most research assumes that support for the Court is “causally prior to, and thus influences, assessments of Court outcomes” (Zink, Spriggs, and Scott, Reference Zink, Spriggs and Scott2009, 912). Nicholson and Hansford (Reference Nicholson and Hansford2014, 622) point out that the empirical evidence regarding the causal nature of Court support on legitimation is “mixed,” but they—like others—still only examine “whether the Supreme Court confers legitimacy on the policies it endorses and …do not speak to the question of public perceptions of the Court” itself.
That Court decisions may simultaneously influence views of policy and views of the Court making the policy has been proposed but rarely tested. In the 1990s, Jeffery Mondak put forth a theory of political capital, which “[held] that the Court can confer policy legitimacy, but that doing so endangers the Court’s…approval” (Mondak, Reference Mondak1994, 676). Mondak (Reference Mondak1992, 461) supported his political capital theory with the following reasoning:
A credible institution may enhance the legitimacy of the policies it advances, but policy actions may, in turn, influence public perception regarding the sponsor…By associating itself with a policy, an institution allows citizens to introduce feelings toward that policy to guide assessments of the institution. Thus, sponsoring a policy is a type of gamble.
The only direct test of the political capital hypothesis which we know of is Mondak (Reference Mondak1992). We build upon this work in two important ways. First, we test the theory using a nationally representative sample; whereas Mondak relied upon a single class of undergraduate students. And, second, we test the theory in the context of an affirmative action decision—a salient policy issue which divides the public along partisan lines. Mondak explicitly considered only policy decisions with which undergraduate students were likely to find unfavorable.
Expectations
The political capital theoryFootnote 5 assumes that the Supreme Court acts as a credible source cue. The extent to which the Court acts as an influential source cue when it makes a policy decision depends on the amount of cognitive effort people exercise in evaluating the Court’s decision. Supreme Court decisions that receive widespread coverage are usually over contested policy issues in which people are motivated to scrutinize the decision. In these situations, Mondak believes that the Court can legitimate policy that would be otherwise unpopular but also takes a hit to its public image (i.e., it expends its political capital). Thus, the political capital hypothesis focuses on salient decisions where a significant number of people would find the policy supported by the Court “otherwise unfavorable.”Footnote 6
Still, the rationale underlying the hypothesis suggests that the Court can legitimate policy among people inclined to support the policy as well, if not more so. That is because both the credible source cue and cognitive motivation push in the same positive direction. Brickman and Peterson (Reference Brickman and Peterson2006, 92–93) argue that salient cases before the Court can “crystallize” public views related to the policy being decided in the case. By crystallize, they refer to an increase in “the intensity of within-group opinions about particular issues.” Decisions that individuals would be inclined to accept (i.e., that are not “otherwise unfavorable”) or that are non-salientFootnote 7 should lead to policy legitimation without any meaningful costs in terms of Court support.
To measure whether a policy decision would be “otherwise unfavorable,” we consider social context and groups. In response to Roe v. Wade, for example, Franklin and Kosaki (Reference Franklin and Kosaki1989) found that active Catholics were most likely to respond negatively to the decision. Johnson and Martin (Reference Johnson and Martin1998, 299) state that “the Court’s policy choices do not necessarily translate into an aggregate increase in positive attitudes towards its position on that issue,” but citizens’ “reactions are affected…strongly by the political context within which they live.” Given the dominant role of partisanship as a political identifier (Dalton, Reference Dalton2016) relevant to salient policy issues before the Court (Nicholson and Hansford, Reference Nicholson and Hansford2014), we think that whether one is prone to see a policy favorably or disfavorably depends on their partisanship.
Key to the political capital hypothesis is that in legitimating “otherwise unpopular [policy, the Court] …allows citizens to introduce feelings toward that policy to guide assessments of the institution” (Mondak, Reference Mondak1992, 458–61). Unfavorable decisions are more likely to harm support for the Court than are favorable decisions to enhance Court support due to the negativity bias in which “negative reactions more strongly affect institutional support than do positive reactions” (Mondak and Smithey, Reference Mondak and Smithey1997, 1114). This negativity bias is observed in many areas of research dealing with human psychology (Baumeister et al., Reference Baumeister, Bratslavsky, Finkenauer and Vohs2001), and it plays an important role in observational research analyzing public reactions to Supreme Court decisions (Grosskopf and Mondak, Reference Grosskopf and Mondak1998; Zilis, Reference Zilis2018; Christenson and Glick, Reference Christenson and Glick2019).Footnote 8
Based on the foregoing explanations, we hypothesize that:
Legitimation Hypothesis: The Supreme Court’s decision upholding affirmative action should strengthen public support for affirmative action.
Political Capital Hypothesis: Individuals who would find affirmative action otherwise unfavorable (Republicans) will develop more negative views of the Court in response to the Court’s decision supporting affirmative action.
Negativity Bias Hypothesis: Exposure to unfavorable Supreme Court decisions will produce stronger effects on views of the Court than will exposure to favorable Supreme Court decisions.
Methods and data
We contracted with YouGov to obtain a sample which reflected the adult population of the United States based on age, gender, race, income, and region. Additionally, we employ sample weights provided by YouGov in order to better generalize from our sample data to the American public. YouGov is a highly credible survey organization that is frequently relied upon to generate data analyzed in the field’s top journals. We fielded our survey experiment from February 10–12, 2020. We randomly assigned respondents to a control or treatment group.Footnote 9 The control group (285 participants) answered a series of questions which we used to measure dependent variables, but they did not receive information about a Court decision. Individuals in the treatment group (281 participants) answered the same questions after first reading a short description about the Supreme Court affirmative action decision.
Affirmative action is a useful issue for testing the political capital hypothesis. It is an area in which the Court has directly shaped national policy, beginning in 1978 with its Regents of the University of California v. Bakke decision and continuing today in cases like Fisher v. University of Texas (2016). It is a salient issue. Black Lives Matter and other social movements have put affirmative action and other policies geared toward racial equality in the spotlight. And Republicans and Democrats are divided in their views over the desirability of affirmative action programs.Footnote 10 Using a policy that is both salient and contested is crucial for testing the political capital hypothesis. In our experiment below, we employ a treatment in which the Court approved of affirmative action.Footnote 11
Respondents assigned to the treatment group were told that “The Supreme Court has upheld the constitutionality of university affirmative action programs for racial minorities. In its decision, released just a few hours ago, the Court’s basic message was that admissions officials may continue to consider race as one factor among many in ensuring a diverse student body.” Notice that we do not include any information about legal or other types of justifications. We simply explain the Court’s basic “message” or policy position. The comparison between these two groups will allow us to test the effects of the decision alone.
After exposure to treatment (or no treatment) by random assignment, the respondents answered a series of questions. We used two questions to understand policy legitimation. Policy Acceptance indicates level of agreement with the following statement: “It is unconstitutional for university admissions officials to consider race as one factor among many in ensuring a diverse student body.” Policy Support indicates level of agreement with the following: “Universities should give preferences to racial minorities as part of their admissions decisions in order to increase the number of racial and other minority students on campus.”Footnote 12
We measure the potential costs associated with policy legitimation through survey questions measuring the public’s willingness to curb the Court, perceptions of judicial decision-making, views of the Court’s connection to the American public, and the entanglement of the Court with the political process.Footnote 13 Indicating willingness to curb the Court, Support for Jurisdiction measures agreement with the statement, “The right of the Supreme Court to decide certain types of controversial issues should be reduced.”Footnote 14
Law-Driven Institution indicates whether people believe the Supreme Court makes decisions substantially based on legal merits, mostly based on legal merits, mostly based on political views, or substantially based on political views.Footnote 15 The Court’s decision-making process matters because procedural fairness and principled decision-making are central to the Court’s legitimacy (Gibson and Caldeira, Reference Gibson and Caldeira2011). Researchers continue to emphasize the importance of knowing whether the public perceives Court decisions to be based substantially on legal merits or on the justices’ own political views. When people believe that justices make preference-based decisions, they are less willing to accept decisions they disagree with and they are more willing to alter the Court institutionally (Bartels and Johnston, Reference Bartels and Johnston2012).
Empathetic Institution indicates belief that “The Supreme Court understands the problems that impact me and my community.”Footnote 16 In other words, it measures whether people think the Court is “out of touch.” This is a common concern among justices and other elites. A widespread notion that the Supreme Court was out of touch with the average American’s experience encouraged Franklin D. Roosevelt to move forward with his Court-packing plan.Footnote 17 President Barack Obama focused on appointing empathetic justices who could understand what citizens were enduring.Footnote 18 In Justice Kavanaugh’s confirmation hearings, he repeatedly emphasized his understanding of the American people.Footnote 19 During the 2020 presidential election, the underlying catalyst for calls to restructure the Court seemed to be that it was “getting out of whack” with the American public and current events.Footnote 20
Relation to Vote is about how much the “type of Justice a presidential candidate would nominate to the Supreme Court matters to [their] vote.”Footnote 21 This variable captures the potential politicization of the Court caused by its own decisions. Judicial decisions may lead the public to associate their presidential vote with the Court. With increased politicization, gridlock, and threat of judicial review, parties may see the Supreme Court as crucial to legislative (or policy) success (Hasen, Reference Hasen2019). Similarly, a judicial decision in a controversial issue area may highlight the relevance of the Court to politics and elections.Footnote 22
We use party identification to account for pre-decision tendencies to either reject or support affirmative action policy.Footnote 23 (That is, whether the individual would find the policy “otherwise unfavorable.”) We measure partisanship by asking respondents whether they identify as Democratic, Independent or Republican.Footnote 24
Aggregate results
We begin with an analysis of the Court’s decision on views towards affirmative action in the aggregate (i.e., without separating respondents by partisanship). Figure 1 plots the estimated levels of acceptance and support for affirmative action for this treatment group and the control group in the upper portion of the Figure (above the horizontal dashed line). The filled circles represent point estimates and the solid horizontal lines represent 95 percent confidence intervals. Gray-colored estimates are for the control group and black-colored estimates are for the treatment group. The possible range of values for each of the variables shown is 1 to 5.
Estimates for each dependent variable by control and treatment group. The treatment group learned simply of the Court’s ruling that university affirmative action admissions policies are constitutional. The control group did not learn of a Court decision. Horizontal lines represent 95 percent confidence intervals. The range of values for each of the variables shown is 1 to 5. Estimates based on weighted survey data provided by YouGov.

For both Policy Acceptance and Policy Support, we find larger values in the treatment group compared to the control group. The differences in estimates are statistically significant for both dependent variables.Footnote 25 These findings support our Legitimation Hypothesis. The decision alone increases a belief that affirmative action policy is (1) constitutional and that (2) university admissions programs should consider such policies. The findings are impressive for two reasons. First, the issue itself is a salient issue in which public opinion should be less malleable than other issues (Zaller, Reference Zaller1992). Second, change in policy position is not limited to acceptance. Far from simply agreeing that the policy is acceptable (constitutional), the decision caused individuals to increase in their support of the policy.
The remaining variables on the y-axis in Figure 1 (those under the horizontal dashed line) refer to various indicators of Court support. Does legitimating a specific policy position in a contested issue arena simultaneously lead to reduction in support for the Court itself? We first consider our indicator of willingness to support Court-curbing efforts: Support for Jurisdiction. Lower values of this measure indicate weaker levels of support for the Court’s jurisdiction over controversial issues. The two point estimates suggest that the decision, while legitimating policy, decreased the public’s willingness to support jurisdiction over controversial issue areas. However, the difference in estimated levels of support between the treatment and control group is not statistically significant.
We find substantial support that the Court decision harmed its public image across the remaining three measures of Court-support. Law-Driven Institution measured the extent to which the public believes the Court makes decisions substantially based on the legal merits, as opposed to making decisions substantially based on political views. Belief that law drove decisions actually decreased when people learned about the Court’s decision. The difference in the estimates is statistically significant. These results demonstrate that legitimation came with a cost: the public was more likely to perceive decision-making as political.
Did the decision lead the public to believe the unelected Court to be “out of touch” with the American people? Again, despite the decision closing the gap between public policy views and the Court’s policy position, the results for Empathetic Institution show how the decision reaffirms a perception that the Court is an elite institution that lacks connection with the public. The statistically significant reduction in belief that the Court understands the American people demonstrates that the public feels the Court is even more out of touch with Americans than it seems without exposure to the Court’s decision.
Finally, we consider whether the decision politicized the Court. Relation to Vote measures the extent to which people connect their presidential vote with the Supreme Court. Again, we find evidence of collateral damage. Those who read about the Court’s decision were more likely to entangle the Court with an explicitly political choice: who to vote for.
In sum, the decision to resolve a salient policy issue had competing consequences. It increased both the public’s acceptance of the policy and its affirmative support for the policy. In so doing, it also put at risk its public image. While we did not find a statistically significant effect in terms of removing appellate jurisdiction over controversial issues, the decision increased the belief that politics drives judicial decisions and that the Court is out of touch with the American public. Legitimating policy was also coupled with the Court becoming a political target as it strengthened the way in which the public connects it to electoral outcomes.
Results contingent on respondent party identification
The results so far are consistent with the political capital theory. That is, in legitimating policy the Court must sometimes expend its political capital, especially in controversial issue areas. This can cause negative views of the Court legitimating the policy. Importantly, the political capital theory focuses on individuals inclined to look upon the policy being legitimated unfavorably. We now consider respondent partisanship to see if those inclined to view the policy unfavorably are more likely to punish the institution supporting the policy.
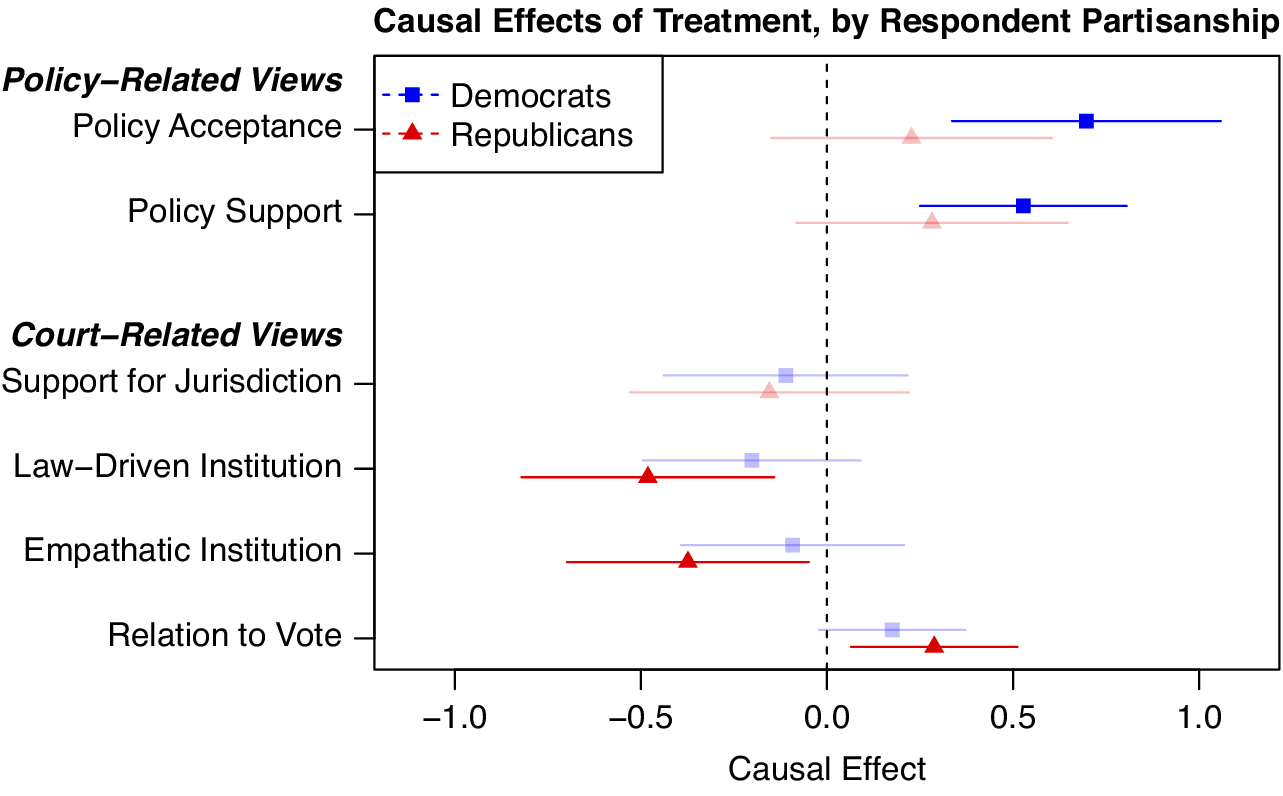
We analyze the data to see when a causal effect of the decision is conditioned on whether a person identifies as Democratic or Republican.Footnote 26 In Figure 2 we plot estimates of the causal effects of the decision on views towards policy and the Court, separated out by Democratic and Republican respondents. A positive value would indicate that the treatment caused a positive effect for the associated dependent variable and partisan group. A negative value would indicate the opposite. Solid horizontal lines indicate 95 percent confidence intervals for the causal estimates. Horizontal lines which do not cross zero (the vertical dashed line) are statistically significant. Blue squares and red triangles represent Democratic and Republican respondents, respectively. Darker colors indicate statistical significance.
Causal effects of treatment (Supreme Court support of affirmative action) on views towards policy and the Court, separated out for Democratic (blue squares) and Republican (red triangles) respondents. Horizontal lines indicate 95 percent confidence intervals. Darker colors indicate the causal effect is statistically significant. Estimates based on weighted data.

Figure 2 demonstrates how different groups drive the different effects related to policy legitimation and views towards the Court. Let’s first reconsider the Legitimation Hypothesis. Recall that Mondak argued that the Court would legitimate policy even among those who would find it “otherwise unfavorable.” This does not appear to be true. At least in this salient and contested policy issue, we observe no statistically significant increase in support for affirmative action among Republicans. The aggregate results above were driven by Democrats who crystallized (i.e., strengthened) their support of the policy.
We find considerable support for the Political Capital and Negativity Bias Hypotheses. Republicans do not show a statistically significant shift in policy views, but they do seem to drive the results in terms of developing negative views of the Court. In reacting to the decision, Republicans were less likely to think the Court was a law-driven institution, they were more likely to believe the Court is out of touch with the American public, and they were more likely to associate their presidential vote with the Court. As expected, the positive reaction to the decision among Democrats did not improve their views of the Court.
Discussion
The political capital theory (Mondak, Reference Mondak1992) argues that the public’s high regard for the Court allows it to legitimate policy, both in terms of acceptance and constitutionality, but that in doing so it expends some of its political capital thereby harming views of the Court itself.
Using a nationally representative sample and a Supreme Court decision over a salient and partisan issue, we tested the political capital theory empirically. Analysis of the aggregate data seems to support the political capital theory. We found impressive effects in terms of policy legitimation. The Court’s causal impact went beyond the public believing that university affirmation action programs are constitutional. The public increased in their affirmative supportive of it, arguing that universities should consider race as an important factor when making admissions decisions. And as expected, the decision simultaneously damaged views of the Court itself.
We then broke down our analysis by respondent party identification, to separate out individuals predisposed to find the decision unfavorable from those predisposed to look upon it favorably. While the political capital theory suggests the Court’s legitimacy will allow it to legitimate policy even among those inclined to disfavor the decision, we find a much more limited institution. Only Democrats (not Republicans) changed their views of the policy following the decision. In terms of costs, the decision harmed views among Republicans but did not change views among Democrats (consistent with Mondak’s expectations).
What do these findings suggest? For one, the Court’s “legitimacy-conferring” capacity is more limited than the political capital theory assumes. At least in the salient and controversial issue area of affirmative action, the Court could only change views among those inclined to support the decision (what scholars refer to as “crystallization”). Importantly, the Court received no boost in support among those inclined to favor its policy decision. Rather, consistent with the phenomenon of “negativity bias,” the Court is more likely to harm its public image than to enhance it whenever it adjudicates contested policy debates.
If salient Supreme Court decisions do more harm than good for the Court’s image, then what does that portend for the Court’s ability to maintain public support long term? We think that the Court can maintain the public’s support in two ways. First, even though the effect of unpopular decisions on Court support is more influential than the effect of popular decisions on Court support, the Court’s history of making decisions congruent with public preferences (e.g., Epstein and Martin, Reference Epstein and Martin2010) should counter-balance the potent but less frequent unpopular decisions. Second, Mondak and Smithey (Reference Mondak and Smithey1997, 1114) argue that “support is subject to value-based regeneration due to a link between the Court and basic democratic values.” Sufficient spacing between controversial decisions or a sufficient temporal pause following a series of controversial decisions can allow the widespread support for democratic values associated with the judiciary to regenerate confidence in the Court.
Of course, we acknowledge there are limitations to this study. First, our study focuses on a salient and partisan issue. While political capital theory would suggest the Court will find it easier to legitimate policy for non-salient issues, and that it is less likely to harm public views of itself in such cases, our research design does not allow us to test these claims. Second, we employ a decision which only Republican respondents would find “otherwise unfavorable.” We cannot be certain based on our data alone that the findings would hold had Democratic respondents been the group finding the Court’s policy position “otherwise unfavorable.” Finally, we cannot be sure how long the effects we found actually last; that is, whether changes in policy views and in views of the Court are temporary or more permanent.
To conclude, our data suggests that the Court’s legitimacy-conferring capacity is limited and that venturing into contested policy debates comes with risk to the Court’s public image. In a politicized environment where the Court is frequently within the crosshairs of frustrated interest groups, lawmakers, and the public’s ire, the Court may need to consider more carefully how it exercises power, especially when public support for the Court is tenuous.
Data Availability Statement
Replication materials are available at the Journal’s Dataverse archive.