Antibiotics are among the most commonly prescribed medications in hospitals, particularly in intensive care units (ICUs). The increasing use of antibiotics is the main driver behind the increasing rate of antibiotic resistance.Reference Pakyz, Powell and Harpe1,Reference Spellberg, Guidos and Gilbert2 The development of resistance is associated with higher morbidity, mortality, hospital length of stay, and costs.Reference Cosgrove3 Antibiotic use remains a common intervention for critically ill patients.Reference Richards, Edwards and Culver4 Although antibiotics have the potential to reduce mortality, their inappropriate use increases the risk of resistance and complications like Clostridioides difficile infection, organ-specific injury like renal and hepatic failure, and adverse drug reaction.Reference Kollef5,Reference Denisuik, Garbutt and Golden6 In fact, there has been an increasing rate of antibiotic-resistant pathogens in ICUs related to frequent use of broad-spectrum antibiotics along with an inherent risk of harboring antibiotic resistance in critically ill patients.Reference Luyt, Brechot and Trouillet7–Reference Hurford, Morris and Fisman9
One effective strategy to optimize antibiotic use and associated costs is to implement antimicrobial stewardship programs (ASPs) in healthcare institutions.Reference Barlam, Cosgrove and Abbo10–Reference Lindsay, Rohailla and Taggart12 To evaluate the appropriateness of antibiotic use and make interinstitutional comparisons, it is important to understand the pattern of use in these settings. We know that antibiotic use is highly variable across acute-care hospitals,Reference Tan, Vermeulen and Wang13 long-term care facilities,Reference Daneman, Bronskill and Gruneir14 and the community.Reference Schwartz, Achonu and Brown15 Cultural practices and prescriber preference likely contribute to this variation.Reference Daneman, Bronskill and Gruneir14,Reference Daneman, Gruneir and Bronskill16 However, little is known about the pattern of antibiotic use across ICUs on a population level. The impacts of different ICU and patient factors on this antibiotic variation are also not well understood. Identifying ICUs with high antibiotic use and associated adverse impact on patient outcomes would represent opportunities for ASPs to intervene and reduce inappropriate use.Reference Morris, Bai and Burry11,Reference Dellit, Owens and McGowan17
Thus, we conducted a population-based study using a province-wide administrative database to compare antibiotic consumption across ICUs in Ontario, Canada. We also sought to explain the variation in antibiotic consumption using ICU and patient factors and to describe the pattern of antibiotic consumption over time.
Methods
Study design
We performed a retrospective cohort study of patients admitted to an ICU using data available from January 1, 2013, to June 30, 2016, included in Ontario’s Critical Care Information System (CCIS) at the time of study. The CCIS is a comprehensive province-wide administrative database that includes information on critical care access, quality of care, and outcomes. The database includes all adult ICUs in Ontario, a Canadian province with population ~14.2 million.18 Thus, this study can be considered population based. The study received approval from the Sinai Health System Research Ethics Board.
The following information from the CCIS database was made available: patient age and gender, ICU admission and discharge date, ICU admission source and discharge destination, number of antibiotics used per day, daily multiple organ dysfunction score (MODS), ventilatory status, central venous catheter (CVC) status, ICU level, ICU type, and affiliated hospitals.
ICU characteristics
ICUs were characterized into 3 major categories. The first category was ICU type: “medical-surgical” includes medical, surgical, or mixed patients and “other” includes coronary care units (CCU), cardiovascular ICUs (CVICU), burn units, and transplant units. The second category was level of support: level 2 units are capable of supporting a single failed organ system, short-term noninvasive ventilation or postoperative care; and level 3 units are capable of supporting the highest level of care including >1 failed organ system and invasive mechanical ventilation. The third category was academic status, which could be either academic or community-based, according to the designation by the Council of Academic Hospitals of Ontario.Reference Marshall, Cook and Christou19 Hospitals with academic status conduct research and provide training to medical students and residents.
Patient characteristics
The cohort was restricted to patients who were >18 years of age. Patient factors included severity of illness, level of ventilator support, and the use of a central venous catheter (CVC). Severity of illness was defined using the MODS on admission; patients were separated into quartiles, according to the original study using MODS.Reference Polk, Hohmann and Medvedev20 Ventilator support included whether the patient received supplemental oxygen, noninvasive positive-pressure ventilation, or invasive mechanical ventilation at any point during the ICU stay. CVC status referred to whether or not the patient received a CVC at any point during the ICU stay. ICU length of stay (LOS) in days was calculated by ICU discharge date subtracting ICU admission date.
Antibiotic consumption
Antibiotic consumption was measured in days of therapy (DOT) per 1,000 patient days both at the patient and ICU levels, according to the previously validated method.Reference Morris, Brener and Dresser21 We chose the DOT method because our database allowed for such calculation, and DOT has been endorsed as the best measure of antimicrobial consumption.Reference Morris22,23 Monthly antibiotic consumption across all ICUs was also calculated using DOT per 1,000 patient days. Information on names and doses of antibiotics is not available in the CCIS database. We excluded patients who had missing antibiotic information or had received antibiotics for one day or less in the database. Because this missing data accounted for only 0.3% of the overall data, a sensitivity analysis was not performed.
Statistical analyses
Descriptive statistics were presented as counts, proportions, medians, and interquartile ranges (IQR), and means and standard deviations (SD), as appropriate. Coefficient of variation (CV), calculated by SD divided by mean, was used to measure the extent of variation in antibiotic use. Statistical analyses were performed using R version 3.5.2 software (R Core team, Vienna, Austria).
Univariable and multivariable linear regression analyses were used to assess the effect of ICU factors (level, type, and academic status) on the antibiotic use in DOT per 1,000 patient days across all ICUs. For patient factors, MODS on ICU admission were transformed to mean MODS; ventilatory status was transformed to percentage of patients on room air; and CVC status was transformed to percentage of patients without a CVC. As such, only univariable linear regression analysis was performed to assess the effect of each transformed patient factor on the antibiotic use in DOT per 1,000 patient days across all ICUs. Finally, multivariable linear regression was used to assess the effect of ICU and patient factors on the variation of antibiotic use in DOT per 1,000 patient days. Interaction effect was examined among the independent variables and in the final multivariable linear regression model.
Results
Patient and ICU demographics
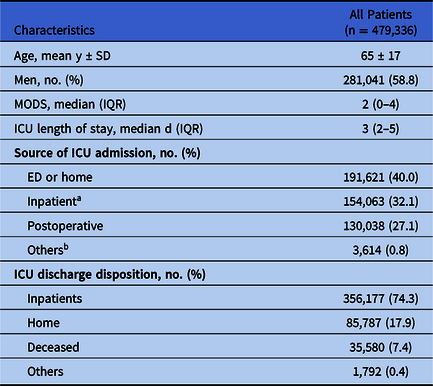
During the study period, there were 479,336 unique ICU patient admissions, resulting in a total of 2,013,397 ICU patient days. In total, 201 ICUs in 109 hospitals were included; 66 hospitals had 1 ICU and 43 hospitals had ≥2 ICUs. Patients were transferred to the ICU from the emergency department (ED; 40.0%), an inpatient ward (32.1%), or from the operating room (27.1%). The median length of stay in an ICU was 3 days (IQR, 2–5). The overall ICU mortality rate was 7.4% (Table 1).
Baseline Patient Demographics
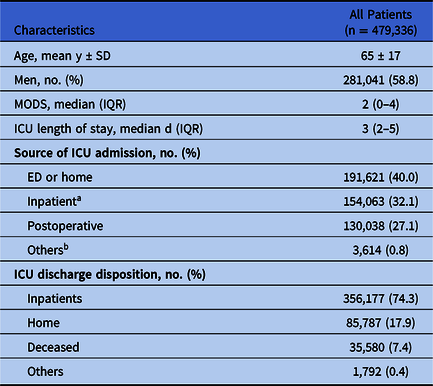
Note. SD, standard deviation; IQR, interquartile range; MODS, multiple-organ dysfunction score; ED, emergency department; ICU, intensive care unit.
a Inpatient ward: another ICU, another hospital, complex continuing care facility, rehabilitation facility.
b Other ward: long-term care facility, outside province, unspecified.
Overall antibiotic use in ICUs
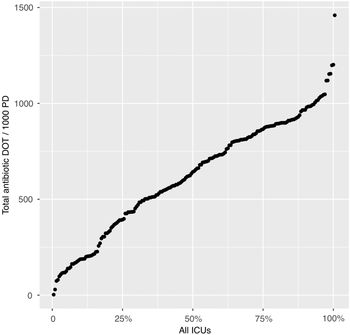
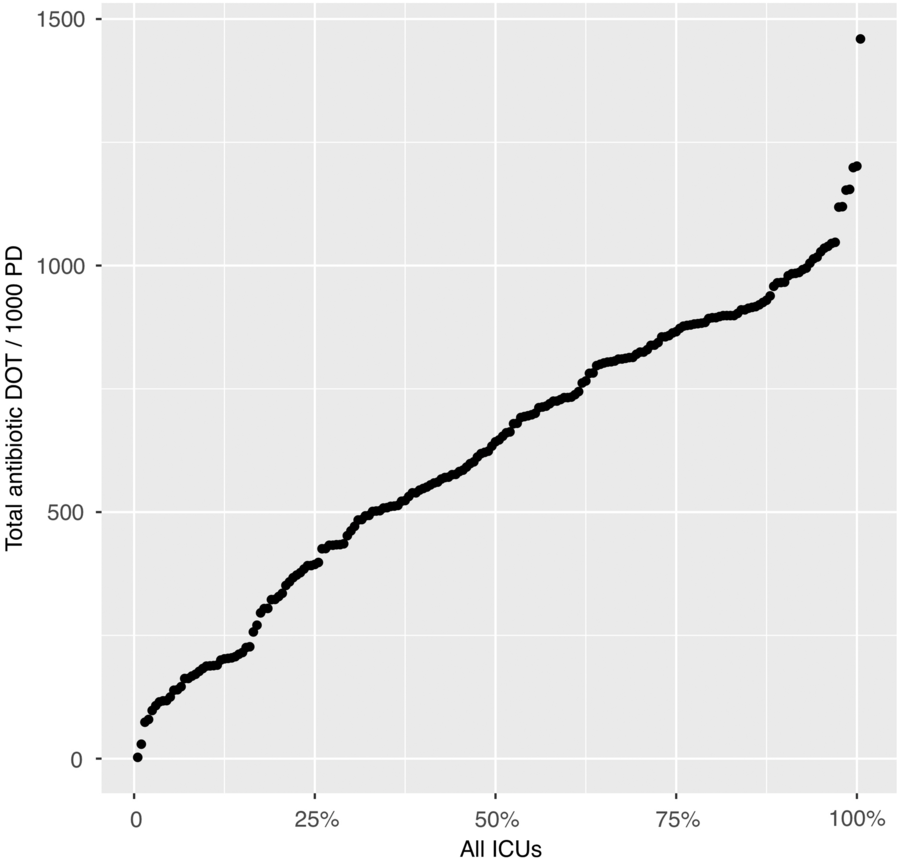
The overall proportion of patients who received antibiotic therapies while in an ICU was 56.2% (n = 269,351). The median duration of antibiotic use was 3 days (IQR, 2–5). At the ICU level, the mean antibiotic consumption was 624 ± 295 DOT per 1,000 patient days. We detected extensive variation in antibiotic use across ICUs; the coefficient of variation (CV) was 0.47 (Fig. 1).
Variation in antibiotic use across intensive care units (ICUs) by quartile. Each dot represents an individual ICU shown on the x-axis, arranged in the order of increasing antibiotic use measured in antibiotic days of therapy (DOT) per 1,000 patient days (PD) shown on the y-axis.
Factors associated with variation in antibiotic use across ICUs and ICU factors
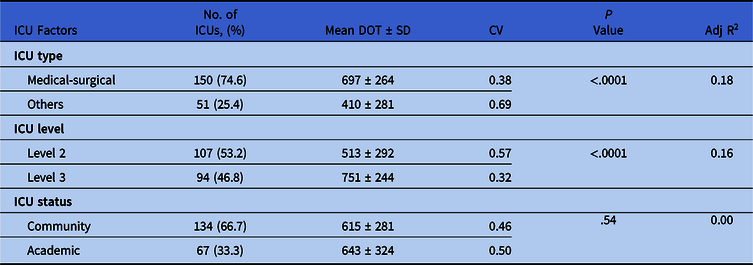
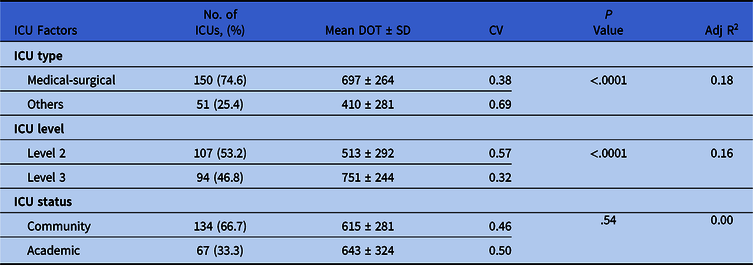
When comparing the mean antibiotic DOT per 1,000 patient days by ICU levels, antibiotic use was significantly higher in ICUs classified as medical-surgical than in “other” ICUs (P < .0001) and in level 3 ICUs than in level 2 ICUs (P < .0001) (see Supplemental Table 1 online for the breakdown of antibiotic use in “other” ICUs). Antibiotic use was not significantly different between community and academic ICUs (P = .53). Comparing to the CV of overall antibiotic use, variation in antibiotic use was higher in “other” ICUs and level 2 ICUs, and it was lower in medical-surgical ICUs and level 3 ICUs (Table 2).
Variation in Antibiotic Use across ICUs by ICU Factors and Univariable Linear Regression by Individual ICU Factors
Note. ICU, intensive care unit; SD, standard deviation; CV, coefficient of variation; Adj R2, adjusted R2.
To determine whether the ICU factors could explain the variation in antibiotic use across ICUs, we performed a univariable linear regression analysis. ICU type and ICU level but not ICU status, explained some of the variation in antibiotic use (18% and 16%, respectively; Table 2a). When we combined ICU type and ICU level to account for the variation in antibiotic use, we found that these 2 ICU factors together explained 32% variation in antibiotic use across ICUs (Supplemental Table 2 online).
Patient factors
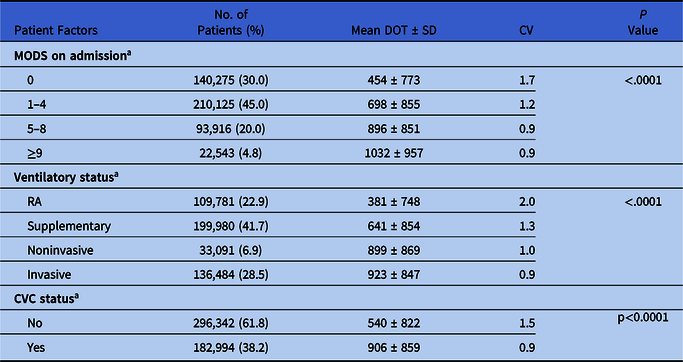
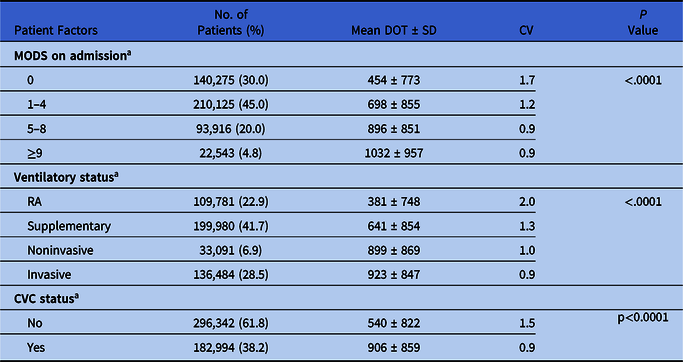
Patient factors including MODS, level of ventilatory support, and CVC status were associated with differences in antibiotic use. Specifically, a higher-quartile MODS on admission was associated with higher antibiotic use (P < .0001); higher degrees of support, including the need for ventilation or for CVC, were both associated with higher antibiotic use (P < .0001). Variation in antibiotic use was the highest in the least sick patients characterized as a MODS of 0 on admission, no ventilatory support or no CVC; this variation decreased as the severity of illness or level of support increased (Table 3).
Variation in Antibiotic Use across ICUs by Patient Factors
Note. ICU, intensive care unit; SD, standard deviation; CV, coefficient of variation; MODS, multiple organ dysfunction score; RA, room air; CVC, central venous catheter.
a Total may not sum to 479,336, due to missing values.
To determine whether patient factors could explain the variation in antibiotic use across ICUs, we performed a univariable linear regression model using each patient factor. Some of the variation in antibiotic use occurred in MODS (23%), ventilation status (25%) and CVC status (15%) (Supplemental Table 3 online). Because the calculation of MODS included ventilatory status (PaO2/FiO2) and cardiovascular status (pressure-adjusted heart rate), MODS was correlated with ventilation and CVC status. As such, multivariable linear regression analysis was not performed due to the degree of correlation among these independent variables.
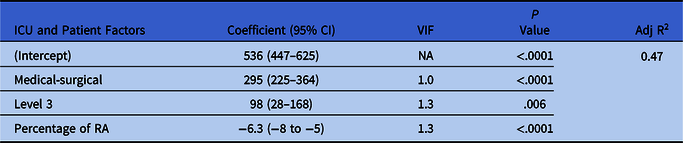
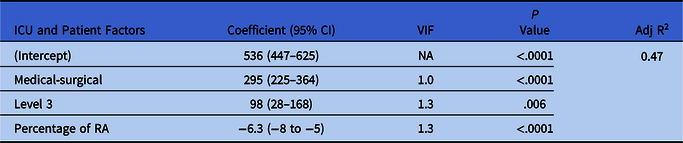
Finally, we combined ICU and patient factors to account for the variation in antibiotic use. The patient factor chosen in this analysis was ventilatory status because it accounted for the most variation in antibiotic use from the univariable linear regression analysis. The variance inflation factor (VIF) was close to 1, which implies that there was minimal multicollinearity among the examined ICU and patient factors. The interaction effect among the examined ICU and patient factors was also minimal (Supplemental Fig. 1 online). Also, 47% of variation in antibiotic use could be explained by the ICU and patient factors (Table 4). The result remained the same when the interaction terms were applied in the final regression model.
Multivariable Linear Regression of Antibiotic Use by ICU and Patient Factors
Note. CI, confidence interval; VIF, variance inflation factor; Adj R2, adjusted R2; RA, room air.
Pattern of antibiotic use over time
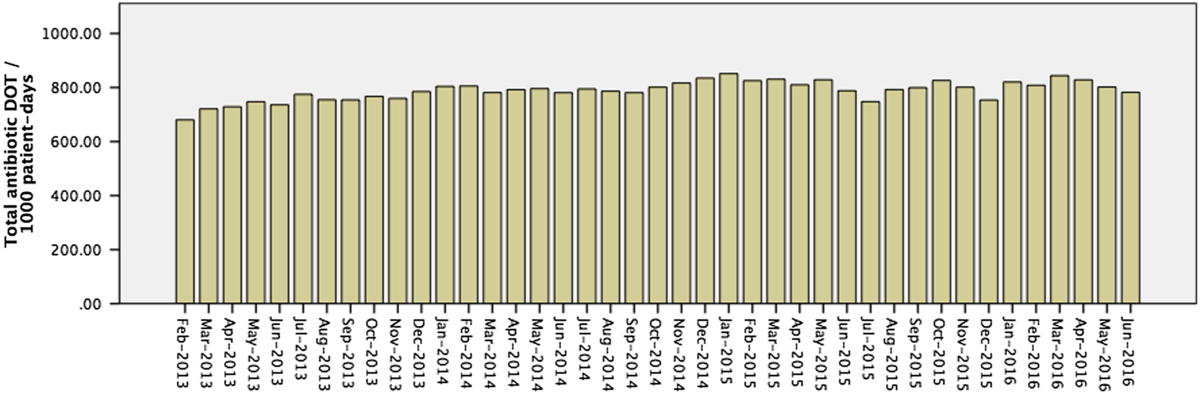
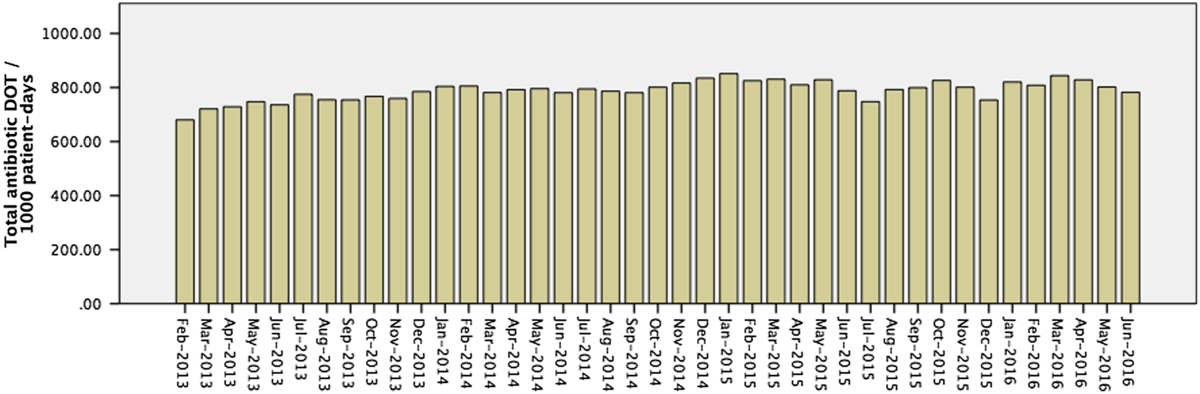
To examine the pattern of antibiotic use over time, we calculated monthly antibiotic DOT per 1,000 PD across all ICUs. The antibiotic use appeared stable over time (Fig. 2).
Pattern of antibiotic use over time. During the study period, the pattern of antibiotic consumption appeared stable. Monthly antibiotic consumption measured in days of therapy (DOT) per 1,000 patient days (PD) is represented by the individual bar on the y-axis. Antibiotic consumption in January 2013 was not included in this analysis.
Discussion
We evaluated antibiotics use across 201 ICUs in Ontario, Canada, over 42 months. More than half of patients received at least 1 antibiotic during their ICU stay, and the overall mean use was 624 DOT per 1,000 patient days (range, 3–1460). ICU factors associated with higher antibiotic use included medical-surgical and level 3 ICUs. Patient factors associated with higher antibiotic use included greater severity of illness and support through the use of mechanical ventilation and CVCs. There was substantial variation in antibiotic use across ICUs, but only about half of this variation was explained by the ICU and patient factors available in the data set.
Overall, our results are comparable to the results reported in the national statistics for ICU mortality rate (7.4% vs 9.0%, respectively), ICU length of stay (3 days vs 3 days, respectively), and use of invasive ventilation (28% vs 33%, respectively).24 Among acute-care hospitals in other studies, antibiotic consumption is unexpectedly lower in the ICUs. For example, in one study of 130 US hospitals, 59% of patients received antibiotics and the mean antibiotic consumption was 790 DOT per 1,000 patient days.Reference MacDougall and Polk25 In another study of 35 US acute-care hospitals, 64% of patients received antibiotics and the mean antibiotic consumption ranged from 798 DOT per 1,000 patient days in 2002 to 855 DOT per 1,000 patient days in 2006.Reference Pakyz, Powell and Harpe1 One potential reason for this difference is that more single-agent broad-spectrum antibiotics may be used in ICU patients rather than 2 or more narrower-spectrum antibiotics used in non-ICU patients. However, data on aggregate antibiotic use in the adult ICU setting are limited. One study reported that in 40 German ICUs, the median antibiotic use was 1,351 defined daily dose (DDD) per 1,000 patient days with a range of 427 to 2,798 over a 4-year period.Reference Meyer, Schwab and Gastmeier26 Defined by the World Health Organization, DDD is calculated based on actual administered doses compared with a standard dose and frequency of a drug administered daily; thus, it is affected by the frequency and magnitude of daily dosing.Reference Polk, Fox and Mahoney27 The apparently higher antibiotic use in German ICUs than in US ICUs may be explained by using DDD rather than DOT as the metric of antibiotic consumption. In addition, other explanations for the disparities may be the focus on academic ICUs and the possibility of data skewing.Reference Meyer, Schwab and Gastmeier26 Finally, a recent study reported that in a large academic ICU, the antibiotic use was 1,232 DOT per 1,000 patient days over a 4-year period.Reference De Bus, Gadeyne and Steen28 Our results corroborate this finding when considering our ICUs with similar characteristics.
The substantial variation of antibiotic use in ICUs is consistent with our current understanding of antibiotic prescribing variation in long-term care institutions, nursing homes, and acute-care hospitals.Reference Tan, Vermeulen and Wang13,Reference Daneman, Bronskill and Gruneir14,Reference Daneman, Gruneir and Bronskill16 After accounting for differences in ICU and patient factors, the variation in antibiotic use remains. This finding suggests that there may be regional or cultural factors that might explain the variation. It is widely accepted that unnecessary antimicrobial overuse and misuse put patients at risk of developing antibiotic-resistant infections, C. difficile infections, and noninfectious drug-related adverse effects in addition to incurring inappropriate hospital costs.Reference Cosgrove3,Reference Kollef, Golan and Micek29 On the other hand, inadequate antimicrobial use exerts selection pressure for resistant pathogens and also puts patients at risk of developing antibiotic resistance in addition to increased patient mortality.Reference Kollef5,Reference Savage, Fowler and Rishu30 The wide variation in antibiotic use across ICUs highlights the need for creating effective interventions to reduce any inappropriate antibiotic use.Reference Morris, Bai and Burry11,Reference Dresser, Bell and Steinberg31 Therefore, benchmarking ICUs and identifying those with inappropriate antimicrobial consumption represent an important target for antimicrobial stewardship.
Furthermore, the stability of antibiotic consumption in ICUs observed in our study over 3.5 years is unsurprising; 3.5 years is a rather short time period to expect province-wide change in antimicrobials without a concerted quality improvement plan. In contrast, antibiotic consumption in acute-care hospitals has been increasing over time, mainly driven by the increasing use of broad-spectrum antibiotics.Reference Pakyz, Powell and Harpe1,Reference Baggs, Fridkin and Pollack32 Although antibiotic use appeared low in the early study period, we suspect this apparent increase in use was due to data system adaptation by end users. The first month of antibiotic collection was excluded in our analyses because the database likely did not capture all the admissions or antibiotics during the month.
Our data set includes all the ICUs in Ontario, a province with a population of >14 million,Reference Dellit, Owens and McGowan17 and we observed wide variation of antibiotic use across adult ICUs in our cohort. However, our study has several limitations that merit consideration. First, because it is a retrospective study using an administrative database, information on antibiotic name and dose was not available. As such, we presented aggregated antibiotic use rather than use by antibiotic class, so we cannot make inferences regarding different classes of broad- versus narrow-spectrum antibiotics. Because our study compared the overall antibiotic use across ICUs on a large scale and used DOT method for antibiotic measurement, the lack of specific antibiotic information would not affect the overall conclusion of the study. Also, because information on patients’ complete demographics and comorbidities were not available in the database, they could not be used to account for the variation in antibiotic use in the regression analysis. Second, inherent systematic biases exist in administrative data sets, but we do not anticipate that these affected our conclusions, especially because they are based on few numerical fields. Third, CCIS does not capture the indications for antibiotic use. We presumed that the therapy was used either for treatment of infections or for prophylaxis. Also, information on antibiotic use in the emergency department was not available in the data set, so patients in ICUs who were on antibiotics either started the therapy elsewhere (emergency department, ward, and so on) or while in an ICU. So we could not evaluate the appropriateness in these individual cases. However, by excluding patients who were on antibiotic for ≤1 day, we were able to avoid including any patients who received antibiotics for perioperative prophylaxis or empirically in the case of undifferentiated cause at presentation in emergency department.
Several unanswered questions remain to be addressed in future studies. First, ICU and patient factors examined in our study only partially explained the variation in antibiotic use in ICUs, suggesting that additional factors need to be identified to account for the remaining variation. In particular, understanding how modifiable factors such as physicians’ prescribing pattern in ICUs and ICU regulatory policies impact antibiotic use would be valuable as they present opportunities for change.Reference Jeffs, Thampi and Maione33 Second, wide variation exists in the amount of antibiotic use across ICUs, and it is unclear if whether variation exists in the duration of antibiotic use and whether such variation contributes to the inappropriate use at the ICU level. Further, although ASPs are associated with reduced antibiotic consumption and costs in some academic ICUs,Reference Morris, Bai and Burry11 this finding can be further validated on a large scale in academic and community ICUs. Similar studies can be performed using more recent data in the future and to evaluate the trend of antibiotic use over a period when ASPs are more widely implemented. Newly implemented ASPs should consider applying the established criteria when evaluating the appropriateness of antibiotic consumption.Reference Savage, Fowler and Rishu30,Reference Jeffs, Thampi and Maione33 Finally, although the ICUs in our study are representative of the ICUs in Canada, we look forward to future studies that examine the differences in antimicrobial use across ICUs in other countries.
In conclusion, we detected wide variation in antibiotic use across all adult ICUs, which was only partially explained by ICU and patient characteristics. This variation in antibiotic use represents a target for antimicrobial stewardship to intervene and regulate its use but also for future research to evaluate other factors that may contribute to this variation. Seasonal fluctuation in antibiotic use suggests other strategies for intervention, such as enhanced vaccination development and adoption. The results of this study provide insights for clinicians and policy makers involved in improving ICU care and monitoring resource utilization to ensure that the right patients get the right antibiotics at the right time.
Acknowledgments
We acknowledge Ontario’s Critical Care Information System (CCIS) for allowing us to use the database. We would like to acknowledge our research coordinators, Marilyn Steinberg and Sarwat Abbasi for helping with obtaining CCIS data sets (Steinberg) and formatting the manuscript (Abbasi). The opinions, results, and conclusions reported in this article are those of the authors and are independent of Ontario’s Critical Care Information System (CCIS). No endorsement by the CCIS is intended or should be inferred.
Financial support
Erika Lee received the Mount Sinai Hospital Resident Research Scholarship during the conduct of this study.
Conflicts of interest
All authors report no conflicts of interest relevant to this article.
Supplementary material
To view supplementary material for this article, please visit https://doi.org/10.1017/ice.2020.217