


UNITE HERE Boston Local 26, June 27, 2018
This photo is reprinted with permission from the UNITE HERE Local 26 President, Brian Lang.
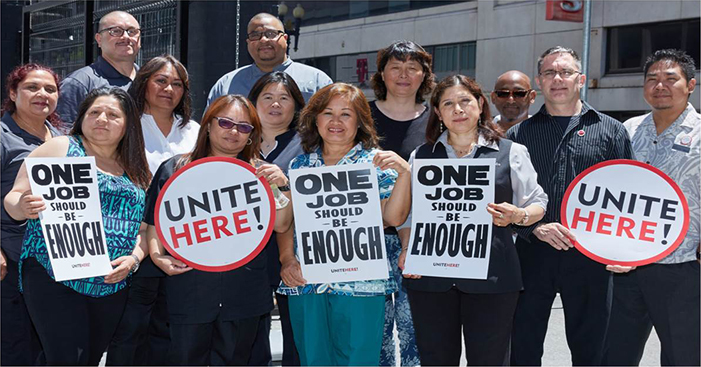
The theme of this year’s conference is “Democracy and Its Discontents,” and the way I would like to contribute to that conversation is by shining a light on features of my own democracy that I believe do not receive the attention they deserve from political scientists. From my perspective, as a student of the comparative political economy of the rich democracies, one of the more regrettable casualties of the way we have drawn lines around the subfields in political science is that this seems to have sidelined the study of the American political economy, by which I mean the analysis of American capitalism.
This is a topic that, at least over the course of my career, has mostly fallen between the cracks of comparative political economy on the one hand and American politics on the other hand. Scholars like me who study the political economies of the rich democracies tend to focus heavily on Europe. For normative reasons, many of us have been drawn to the study of capitalism in places like Sweden and Norway, which have their problems but where we can still point to the possibility of finding ways to reconcile successful economic performance with relatively high levels of economic equality.Footnote 1
Americanists, for their part, have given us important insights, especially into the behavioral foundations of American politics, focusing on public opinion and voting. However, it is rare in the extreme for Americanists to compare the United States to other countries.Footnote 2 More importantly, many of the issues and actors that are central to the study of the comparative political economy of the other rich democracies—labor unions, finance, organized business, wages, working time, skills, education and training—do not figure at all in mainstream research on American politics.
In the meantime, we do have some important studies of high-end inequality in the United States, for example the influence of the super-rich on public policy, the role of moneyed interests in American politics, and the political strategies of the organized business community.Footnote 3 My emphasis today, however, is different. I am not going to focus on high-end inequality, but instead on the “normal,” taken-for-granted operation of markets, in particular labor markets at the low end of the income ladder. What I would like to do today is explore what we can learn about American capitalism—and by extension, about American democracy—by situating the United States in a broader comparative context.
I begin with a trend that we are hearing a lot about these days, namely the emergence of the so-called “gig” economy. This term comes out of the entertainment industry, where musicians rarely hold steady jobs, and instead are paid for playing individual gigs on a one-off, pickup basis. In the meantime, the term gig economy now refers to a phenomenon where instead of being employed in the usual way (on some sort of normal employment contract), workers get one-off payments to perform individual tasks—like deliver your food, or drive you around, or walk your dog.
Even if you are not familiar with this particular term, you probably will have heard of – and most likely used—some of the services on offer in this new gig economy. No doubt, many of you have an Uber or Lyft app on your phone, and I imagine some of you have stayed at an Airbnb on vacation with your family. I know for sure that many of my colleagues and graduate students run their surveys through Amazon’s Mechanical Turk (AMT)—an online marketplace for digital piecework where “Turkers” can go online, find an interesting task (like filling out your survey), and earn money.
If you have used any of these services, you know that this gig economy has been great for consumers. Users are getting a service that is tailored to exactly what they need when they need it—and it is typically very inexpensive because workers are only being paid for the task they perform. Gig work can also be a great thing for workers—or at least for particular kinds of workers. For example, if you have highly marketable skills (e.g., in software engineering or web design), this kind of freelancing can be very liberating; suddenly you can organize your time however you like. It can also be great for parents, especially women, who often bear primary responsibility for children and for whom it may be convenient to be able to work flexibly, even from home.Footnote 4 So there are possibilities here for autonomy and maybe even personal empowerment.
However, it turns out that for everyone who benefits from the flexibility that this new type of work offers, there are also those who are pressed into such employment for lack of alternatives or by the need to supplement insufficient income from other jobs. A recent study by the Pew Research Center revealed that over half (56%) of Americans who earned money on one of these digital labor platforms in the previous year indicated that this income was either “essential” or “important” to making ends meet.Footnote 5 It turns out that for people who depend on these platforms in these ways, it is not so easy to make money. For example, at $4.65 per hour, the median hourly earnings of American Turkers are well below the federal minimum wage.Footnote 6 The problem is not just low wages; it is also that many of these platform companies are able to exploit ambiguities in the law to avoid obligations associated with other forms of employment. Thus, most gig workers are considered to be independent contractors, which means that they do not have any of the rights and benefits attached to a regular job—no minimum wage regulations, no overtime rules, no unemployment insurance, no workers’ compensation if they get hurt on the job—on all these fronts, they are on their own.Footnote 7
In this talk, I want to situate the rise of this type of gig work in the context of a longer-term and much broader phenomenon, namely the rise of what the French sociologist Robert Castel has called the new precariat.Footnote 8 I define the precariat, as Castel does, as flowing from a growing fragmentation of work and the breakdown of the standard employment relationship, by which I mean stable, long-term employment contracts that include benefits and that feature regular, predictable hours. As Castel notes, the problem of precarity is not just about a “precarious periphery,” but also about a broader “destabilization of the stable.”Footnote 9 This is a trend that is common across all the advanced industrial countries and one that has resulted in what Jacob Hacker has called the “privatization of risk” as more and more economic risks are shifted from employers and governments “onto the shoulders of ordinary Americans” and their families.Footnote 10
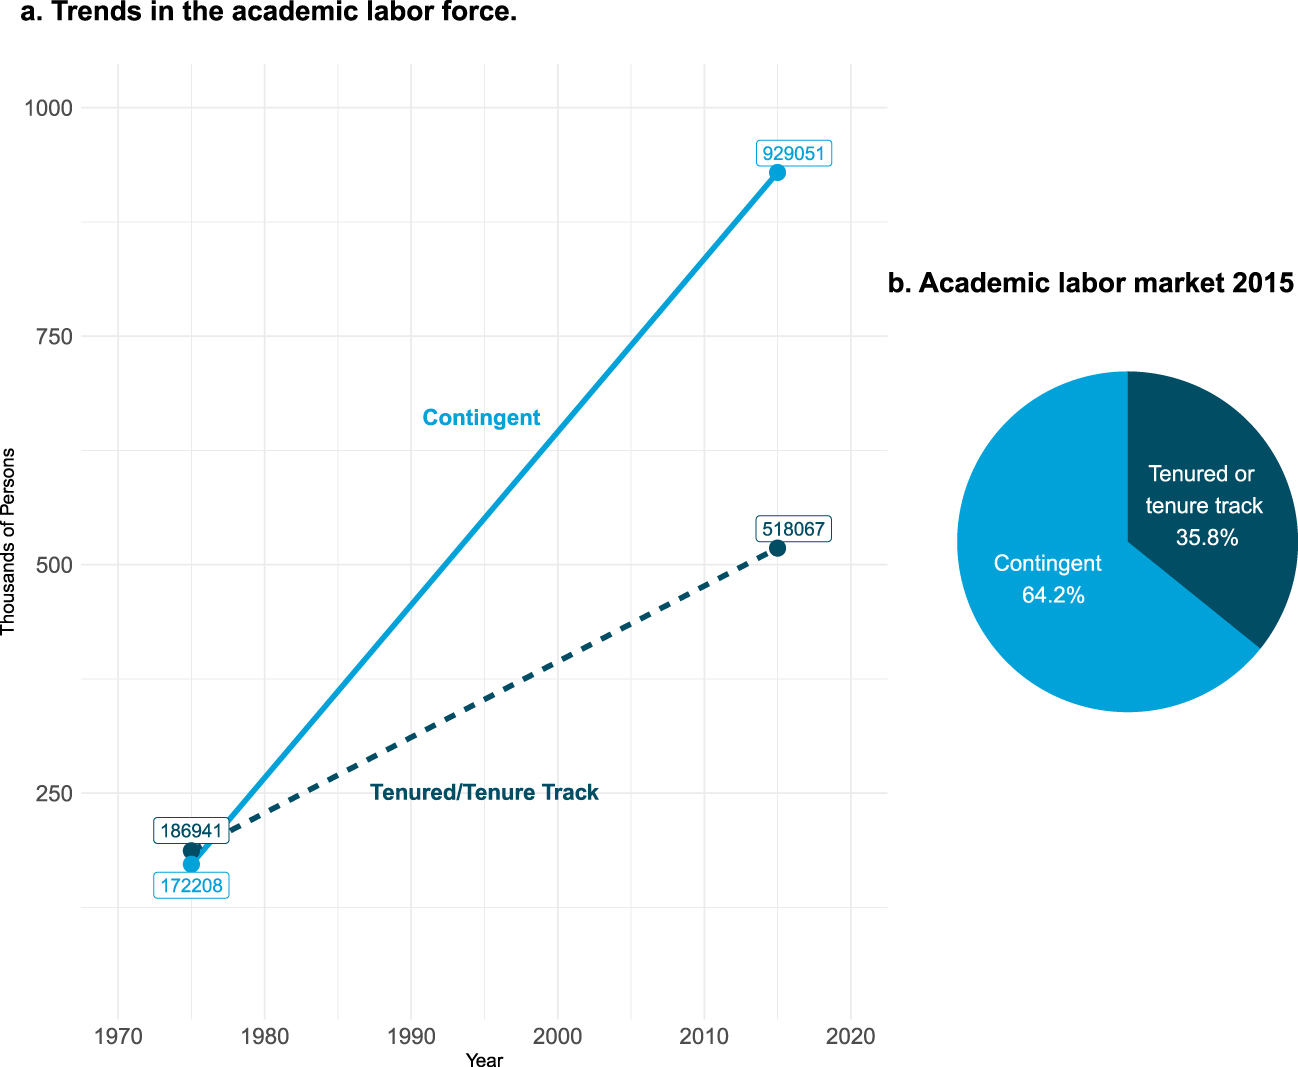
In my remarks, I will focus primarily on the impact of these trends on low-skill, low-income groups, because they are the ones who experience precarity most intensely. However, it is important to be clear that precarity is not the same as poverty, and it does not only hit low-skill workers. It also affects highly skilled groups, including professionals such as airline pilots and lawyers (especially contract law), who also are employed increasingly on flexible contracts.Footnote 11 We can underscore this point by observing trends in our own discipline. Figure 1a shows that the academic labor force has grown massively since the early 1970s. However, what we also see is that non-tenure line positions (e.g., adjuncts or lecturers) have grown much faster than tenure line positions, so that the profile of our profession is now predominantly highly skilled but contingent in the sense of employed on an “as-needed” basis (see figure 1b). Most of our colleagues on contingent contracts are ineligible for benefits; they are hired on a course-by-course basis, and often notified of their schedules only shortly before the semester begins.Footnote 12
Academic labor force, United States
Source: AAUP and the Integrated Post Secondary Education Data System (excluding graduate students)
In short, this practice of substitution—swapping more flexible, more contingent forms of employment in place of previously more secure jobs—affects many different kinds of employees in many different sectors and at different skill levels. Thus, precarity, as I am using the term today, extends well beyond the gig workers to whom I referred at the outset.
In exploring these issues, I will be pushing back against the self-congratulatory tone often struck when our current administration boasts about record low levels of unemployment and robust job creation. I also hope to shed some light on one of the more puzzling features of the American labor market, namely continued real wage stagnation despite eight years now of steadily declining unemployment.Footnote 13 The question for me is not how many jobs did the U.S. economy generate last month or last year, but what kinds of jobs are these and how many of these jobs do people at the low end have to hold in order to make ends meet?
The rest of my talk proceeds in five steps. First, I want to look into the forces that are driving the growth of various sorts of atypical work arrangements. Second, I will discuss why these developments pose a problem, both at the individual level and at the national level. Third, I will situate the United States in a comparative perspective and show that while these trends are pervasive across all the rich democracies, the problem of precarity is especially acute in this country. Fourth, I will zero in on one of the features of the American political economy that plays a central role in exacerbating precarity and intensifying its effects in the United States. Fifth and finally, I circle back to address the way in which the study of American capitalism relates to the theme of this conference on democracy and why we as political scientists should care about it.
The Growth of Atypical Employment in the Rich Democracies
Gig work of the sort to which I referred earlier is just one of many forms of “atypical” employment that have been on the rise across the rich democracies. Atypical work travels under different names in different national and sectoral contexts—“temp” work, fixed-term employment, mini-jobs, bogus self-employment, on-demand work, “zero-hours” contracts, and many more. The general point, however, is that across the rich democracies, the new reality for a growing number of people is employment that is less steady, less secure, and less well embedded in traditional social protections.
“Non-standard” employment is of course nothing new.Footnote 14 Historically speaking, the standard employment relationship is the exception. In the early industrial period, all work was “casual,” which is to say, insecure and irregular. And of course, in many parts of the developing world, this is still the case.Footnote 15 Early labor market reformers in Europe, including Fabian socialists such as Sidney and Beatrice Webb, fought against casual labor, viewing it as a source of poverty and social dependence.Footnote 16 However, some conservatives were also concerned—either because they saw this underemployed underclass as politically dangerous or because they considered this a highly inefficient way to organize the labor market.Footnote 17
Thanks not least to the efforts of the emerging organized labor movement, the trend, at least in the rich democracies, was toward “decasualization” and later the emergence of a variety of social protections, so that by the mid-twentieth century, the norm of stable full-time work attached to a package of benefits had become entrenched throughout the advanced capitalist world. The model midcentury industrial firm embodied what the philosopher Elizabeth Anderson described as a “nexus of reciprocal relationships.”Footnote 18 It was a model that concentrated power in the hands of managers, but managers whose goal was stable long-term growth. It was underwritten by “patient” capital (in Europe often provided by banks, in the United States by passive and dispersed shareholders) that allowed for the cultivation of long-term relationships and stable gains for all of the company’s stakeholders, including labor.
However, as especially the sociologist Gerry Davis has pointed out, many of today’s largest and most dynamic companies do not conform to this model, but instead look more like a nexus of short-term contacts.Footnote 19 Firms have become increasingly fragmented (or as David Weil puts it, “fissured”Footnote 20), as companies construct extensive networks of subcontracting and franchising that allow them to outsource all kinds of operations, using cheaper third party suppliers of goods and services to cut costs, particularly labor costs. This means that instead of being directly employed by the big core company (say, GM), workers are more likely than before to be working either on a freelancing basis (as “independent contractors”) or for some smaller entity in a network of subcontractors or branch operations that are formally independent but that are all part of a hierarchy in the service of the core company.Footnote 21 The Wall Street Journal recently reported that among the top 20 employers worldwide in 2017, five are outsourcing (“workforce solution”) companies that do not produce anything at all but simply supply workers to other companies on an on-demand basis.Footnote 22
This kind of fissurization has been facilitated by technological change. There are classic Coasian efficiency gains to be made. As technology has reduced the transaction costs of monitoring partner firms and employees, the incentives to subcontract have gone up. However, while they are enabled by technology, these strategies are motivated by employer efforts to reduce labor costs by replacing full time workers with more flexible temporary or short-term workers, thus externalizing the costs of adjusting to ups and downs in demand.Footnote 23
These practices are not unknown in manufacturing where, for example, automobile companies have long engaged in subcontracting, and are increasingly using temps as well. However, these trends have been much accelerated by the long-term shift in employment out of manufacturing into services.Footnote 24 Atypical work has flourished especially in labor-intensive services such as the retail and hospitality industries, where both fissurization through franchising and the use of temporary agency workers are widespread.Footnote 25 Moreover, even where core companies employ workers directly, e.g., major retailers such as Target or Walmart, new technologies allow employers to adjust their staffing levels to match consumer demand in real time. What in management circles is called “lean staffing” often translates into “just-in-time” scheduling, where workers find out their schedules hours before they are expected to show up. Fissurization and lean staffing—singly or, often, in combination—generate huge labor savings for employers, and at the same time, huge uncertainty for workers.
In this context, digital platforms such as Uber, Upwork, and AMT have simply elevated such strategies to new levels by foregoing employment contracts altogether and using “independent contractors” instead, where the core firm bears no responsibility for wages or benefits or hours or anything else.Footnote 26 This is why platform-based companies are at pains to call their employees anything other than workers: they are taskers, Turkers, providers, “partners,” “heroes,” or “ninjas.”Footnote 27 And it is why what these people are doing is referred to as everything but jobs: gigs, tasks, micro tasks, rides.Footnote 28
The core logic and the employment implications of these new enterprises were best summarized by the CEO of a major crowdsourcing platform in an unscripted moment of candor: “Before the Internet, it would be really difficult to find someone, sit them down for ten minutes and get them to work for you, and then fire them after those ten minutes. But with technology, you can actually find them, pay them a tiny amount of money, and then get rid of them when you don’t need them anymore.”Footnote 29
However, as we have seen, it is not just platform businesses that are engaged in such practices. The upshot of the strategies of all of the firms I have been talking about is that they are increasingly abdicating the responsibilities once attached to the standard employment relationship.
The Precarity Problem
Why is the decline of the standard employment relationship a problem? Is it even a problem? This is a question that needs to be answered at two levels—the individual level and the national level.
At the individual level, for some people, it is not a problem at all. As mentioned at the outset, it can be a plus if you are doing these small jobs just for fun or on the side, and if you have healthcare and social security through some other avenue. However, for those who depend on these flexible jobs for their livelihood, it can be a big problem, because this type of work is highly irregular, insecure, and typically does not come with the full package of benefits. For a large number of workers, especially low-skill workers, the developments I just outlined do not translate into greater autonomy but instead into an especially harsh form of sheer precarity as they face recurring unemployment or chronic underemployment.Footnote 30
Thus, for example, despite low unemployment, underemployment is actually a significant problem in the United States. Figure 2 comes out of the dissertation of one of my former students, James Conran.Footnote 31 It tracks the evolution of average weekly working hours for employed men in the top and bottom income quartiles in the United States going back to 1980.Footnote 32 It shows that the number of hours worked by men in the top income bracket rose in the 1980s and has stayed steady at a rather high level since then. What is most striking here, however, is that the hours of the men in the lowest income group declined significantly over this period, first in a big drop in the early 1980s and then another large drop after the financial crisis. This phenomenon is part of what Conran calls the great reversal, where those at the top of the income ladder—what we used to think of as the leisure class—are now working longer and longer hours, while low-wage workers are often suffering chronic underemployment.

Underemployment often takes the form of involuntary part-time employment—i.e., people who are working part-time jobs when they actually would prefer to be working full time.Footnote 33 Involuntary part-time employment is highly cyclical for all types of workers, rising in economic downturns as employers scale back on labor. In the United States, however, it invariably hits women and people of color with greater intensity than other groups.Footnote 34 Underemployment can also take the form of insufficient or unstable hours even in full-time work. And if you want to know what this looks like in real life, talk to some of the people who are taking care of us at this conference—those who are cleaning your hotel room while you attend your panels, those who are bussing tables and washing dishes at the restaurants at which you eat, or those preparing the food for the reception we are about to enjoy.Footnote 35
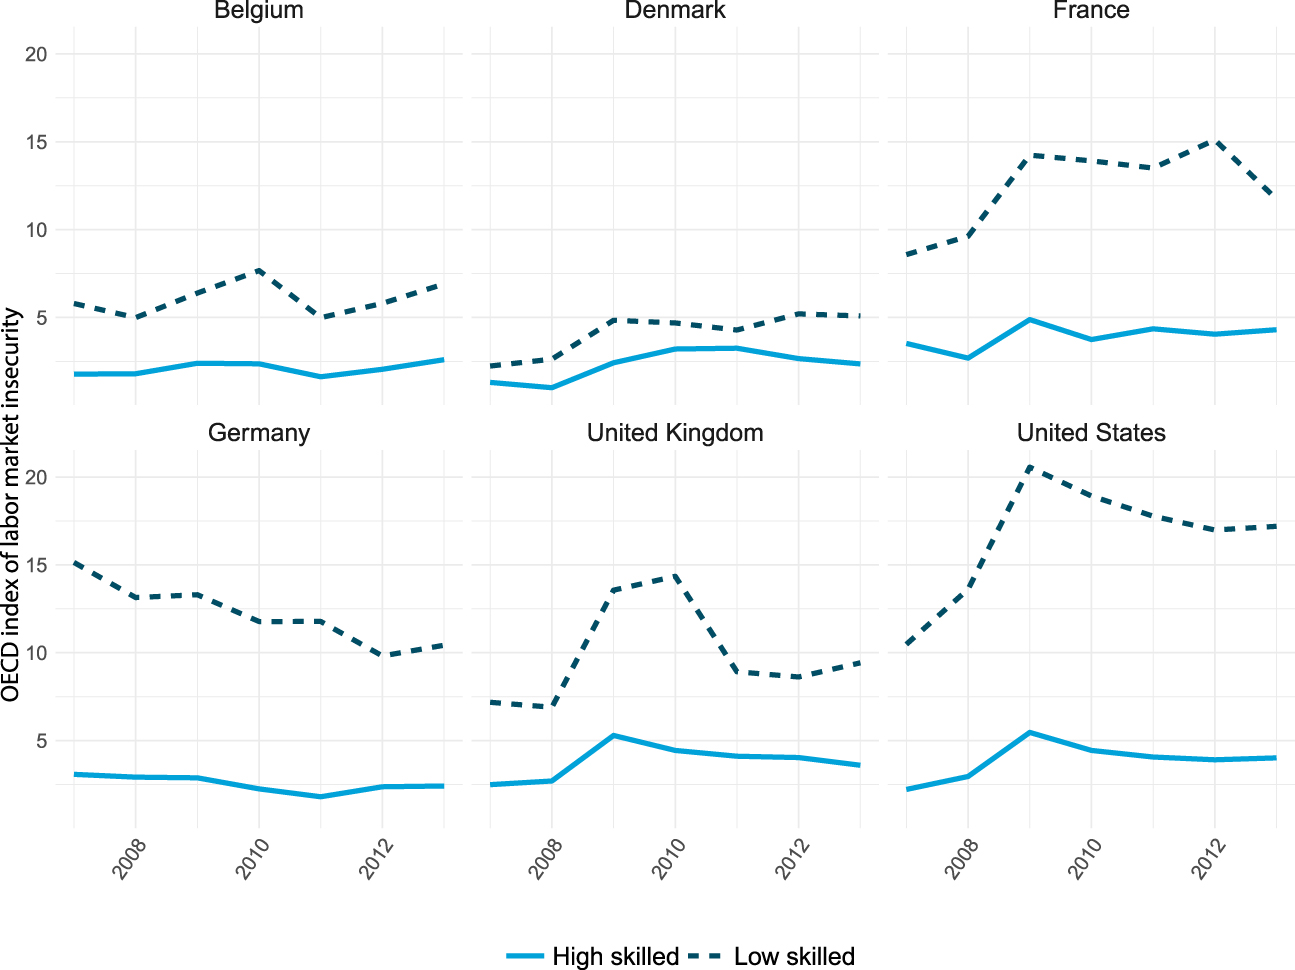
These new forms of insecurity also take the form of recurring unemployment, as workers move between jobs that offer low or no employment protection. For a comparative picture of this, figure 3 compares the United States to several other countries based on an OECD measure of labor market insecurity, displaying results for high- and low-skill workers.Footnote 36 As one would expect, low-skill workers experience higher labor market insecurity than high-skill workers. However, what is also striking here is that in some countries (Belgium and Denmark), social policies mitigate that gap, reducing the level of labor market insecurity among low-skill workers to levels that are not that different from high-skill workers. The United States stands out both for the comparatively high level of labor market insecurity experienced by low-skill workers overall, and for the size of the gap that separates them from high-skill workers on this scale.
Labor market insecurity by education level
Source: OECD
What is also clear is that especially for those workers who do not freely choose these types of jobs, this employment flexibility is not really a two-way deal. Employers in sectors such as retail and food services can use new technologies to optimize scheduling, in extreme cases calling workers in (or off) on short notice. What this often means for workers is that they are being paid to work part-time but on the condition of full-time availability.Footnote 37 Figures 4a and 4b are based on a survey of low-skill service employees in Washington, DC—retail, restaurants and other service industries.Footnote 38 The figure on the left shows how far in advance their work schedules are posted (darker is less than three days in advance, lighter is less than a week). As indicated, close to 50% of those surveyed received a week or less notice for when they would be expected to show up for work. The figure on the right shows that even after the initial postings of hours, employers often make further changes.Footnote 39 The result is that a significant share of these workers are getting less than 24 hours’ notice.Footnote 40
Results of survey of low-skill service employees in Washington, DC
Source: Schwartz et al. Reference Schwartz, Wasser, Gillard and Paarlberg2015, 7

These arrangements obviously make it extremely difficult to budget, hard to arrange day care, difficult to pursue any kind of education, or even work a second job. The net result of these trends has been to promote a new polarization in the labor market, as Castel puts it, “between those who are able to combine individualism with independence because their social position is secure; and those who experience their individuality as a cross to be borne because for them it signifies only a lack of attachments and protections.”Footnote 41 The demographics of the two groups are radically different in the United States, as women and minorities are more heavily concentrated in those sectors in which the flexibility only works for their employers.
The decline of the standard employment relationship is not just a problem at the individual level; it is a problem at the national level as well. Whether people are choosing these jobs freely or pressed into them by necessity, the growth of these atypical forms of employment poses long-term problems. These employment trends are especially problematic for countries such as the United States that feature job-based, pay-as-you-go benefit systems in which the contributions that employers and employees make today are funding entitlements for the future. As firms turn increasingly to atypical employment arrangements that do not require contributions, they relieve themselves of the additional costs associated with standard employment contracts, which means that these workers are less well covered or simply left to provide for themselves. In this way, the increase in atypical employment simultaneously expands the economic risks to which individuals are exposed while at the same time reducing the social contributions and thus the resources that would be necessary to cover them.Footnote 42 Moreover, even for those workers who do these jobs as a supplement and receive benefits through some other job, the companies that hire on this basis are free riding on those other employers who do provide benefits.Footnote 43 Such firms in effect are drawing from the commons and not contributing to it, and that is not sustainable over the long run.
The more general negative externalities of these trends in employment are also significant. Where these new, more flexible forms of work make it difficult for people to go to school or even just stay home when they are sick, they have massive knock-on effects for health, productivity, and social well-being. The United States is also particularly prone to “risk contagion,” where misfortune in one arena (e.g., sudden uncovered medical expenses) spreads to foment misfortune in others (e.g., inability to make mortgage payments resulting in foreclosure).Footnote 44 The lack of social backstops in the United States means that when you stumble in one area (job, health, housing), it can be impossible to get back up—with massive collateral damage to entire families, including, of course, children. Thus, while these cascading effects are felt by individuals, they also have cumulatively huge social costs.
The United States in Comparative Perspective
How big is the precarity problem? And, especially, how does the problem of precarity in United States compare with other rich democracies?
Precarity is tough to measure, because in many ways the deepest forms of precarity involve exposure to a bundle of risks.Footnote 45 This section therefore takes several passes at assessing labor market precarity in the United States compared to other countries, reviewing briefly a range of possible measures—unemployment, job (in)security, work without benefits, low-wage work, and in-work poverty.
The most widely used measure of the health of the labor market is the unemployment rate, and we are hearing a lot these days about record low levels of unemployment in the United States. However, just looking at unemployment does not tell us much about precarity if people are moving in and out of jobs, or if people are working more than one job, or if they are employed in jobs that don’t offer social protections, or even a living wage.
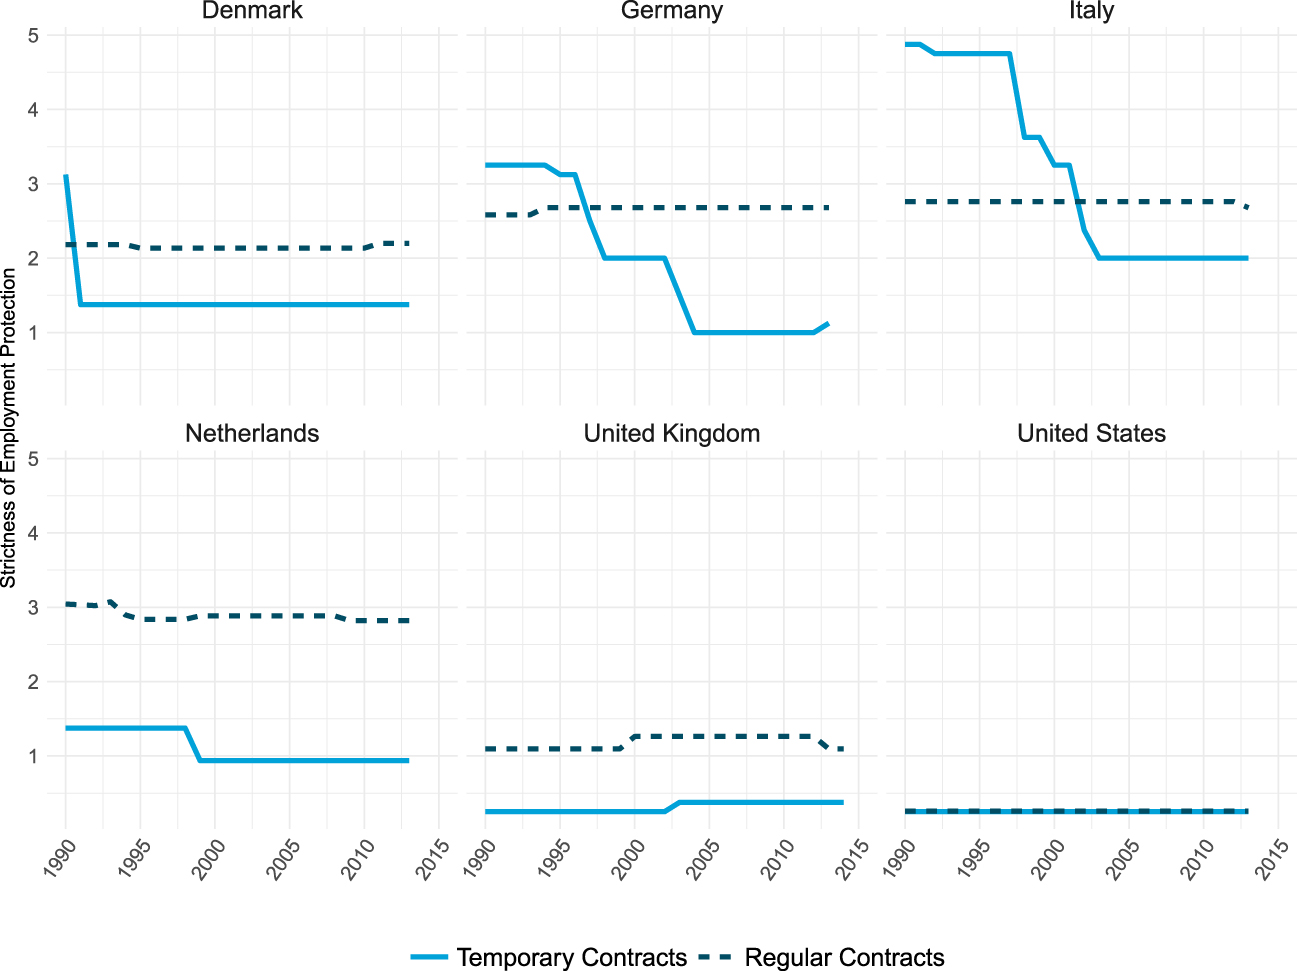
To assess precarity, then, we have to look beyond unemployment figures. In Europe, one widely used measure of job (in)security is how many people are working on temporary employment contracts. The reason this is a focus is because in Europe, workers on these temporary contracts are not covered by the same strong employment protections that—through law or collective contract—typically apply to those on regular employment contracts.Footnote 46 The OECD has developed an index of the strictness of employment protection, such that the higher the score, the stronger the employment protection (or the more restrictions placed on employers).Footnote 47 In Europe, job insecurity has risen as many governments have relaxed restrictions on the use of temporary contracts, as indicated in figure 5. However, as this figure makes clear, the big story for the United States is that nobody has much job security in this country; they never really did. The United States stands out in international comparisons for the ease with which employers can hire and fire their workers—even those on regular contracts.Footnote 48 Thus, when it comes to employment protection, there is a way in which all jobs in the United States are more precarious than they are in most of Europe.Footnote 49
Strictness of employment protection for workers on temporary and regular contracts
Source: OECD
Another way to think about precarity is to compare the package of benefits that are attached to all these jobs that are getting created. In most European countries, both full-time and part-time workers enjoy the same core package of benefits, including sick pay, parental leave, vacation time, and in some cases the right to training (pro-rated for part-timers for some benefits).Footnote 50 By contrast, in the United States, the vast majority of part-time workers, as well as a very large share of low-income full-time workers do not have access to these core benefits. This applies to well-known differences such as the lack of universal health care, as well as to what in the United States would count as luxury benefits (e.g., paid parental leave).Footnote 51 But it applies as well to very fundamental benefits such as sick pay, where the United States is the only advanced industrial democracy in which workers have no federally guaranteed entitlement to paid days off when they are too sick to come to work.Footnote 52
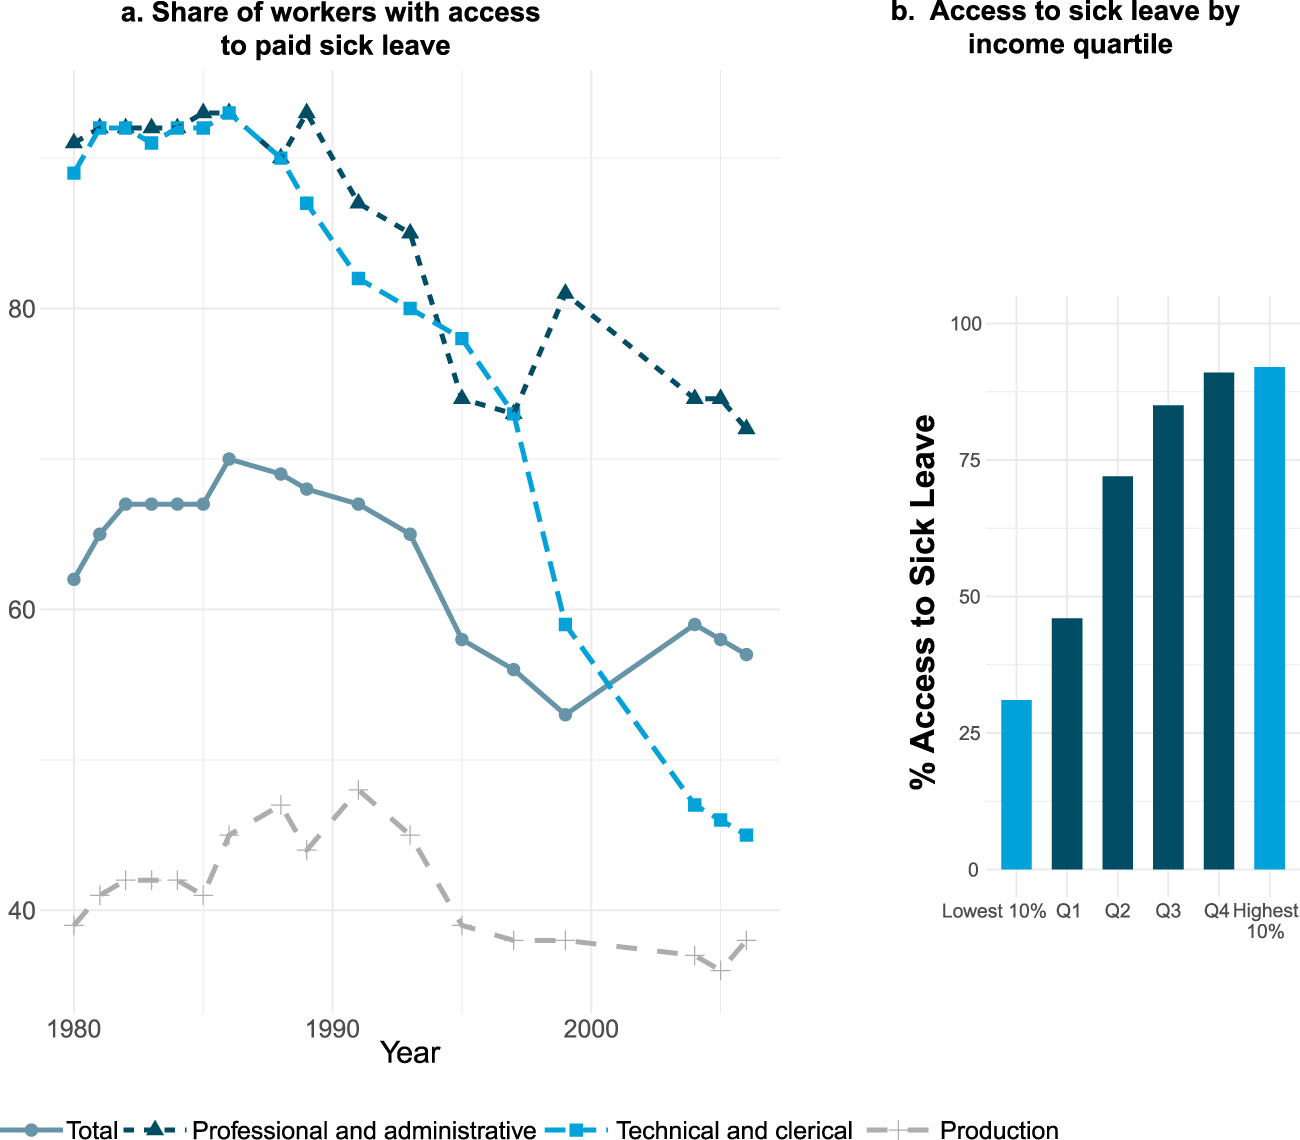
Figure 6a shows that access to paid sick leave has been declining precipitously for some groups on the labor market. It provides data from the Bureau of Labor Statistics on access to paid sick leave from 1980 to the present. The most striking development is among “technical and clerical workers” (a category that includes precarious workers in some of the low-skill service sectors I have been talking about), for whom access to this core benefit dropped sharply starting in the mid-1980s and plummeted in the late 1990s.Footnote 53 Figure 6b displays data covering the entire labor market, and it shows that in the United States the lower your income, the less likely you are to enjoy access to any paid sick leave at all.
Access to paid sick leave, United States
Source: BLS National Compensation Survey 1980–2017
And we could of course repeat this exercise for other benefits – health care, pensions, paid parental leave, paid vacation, support for skill development, and so on.
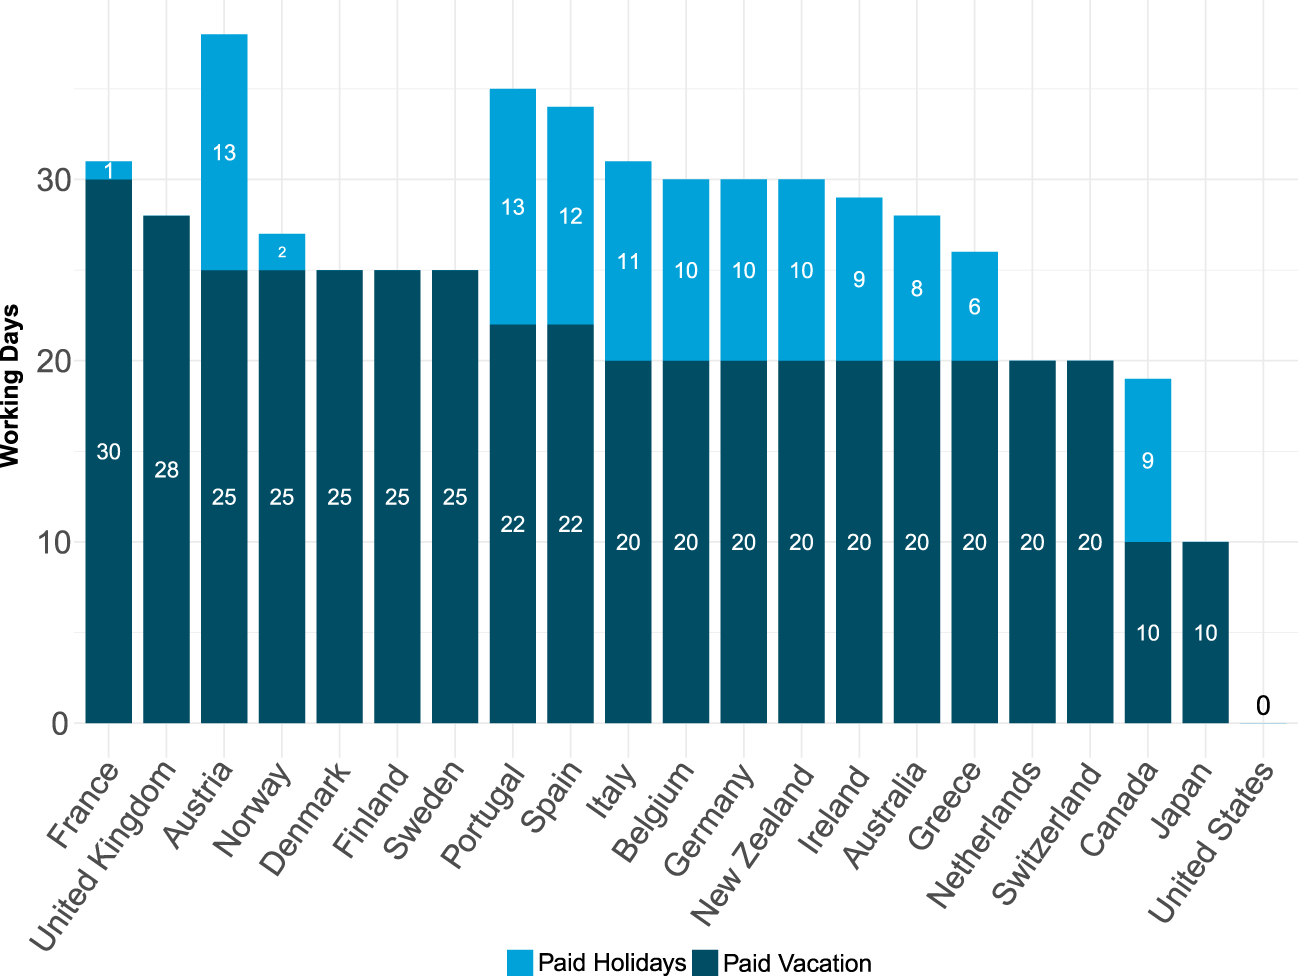
Figure 7 provides a comparative perspective on another benefit, namely rights to paid vacation and paid holidays. Here we see that the United States is again an extreme outlier – with fewer federally guaranteed paid holidays even than Japan—a country in which so many people die of overwork that they have a word for it.Footnote 54
Paid vacation and paid holidays in OECD nations in working days
Source: CEPR 2013
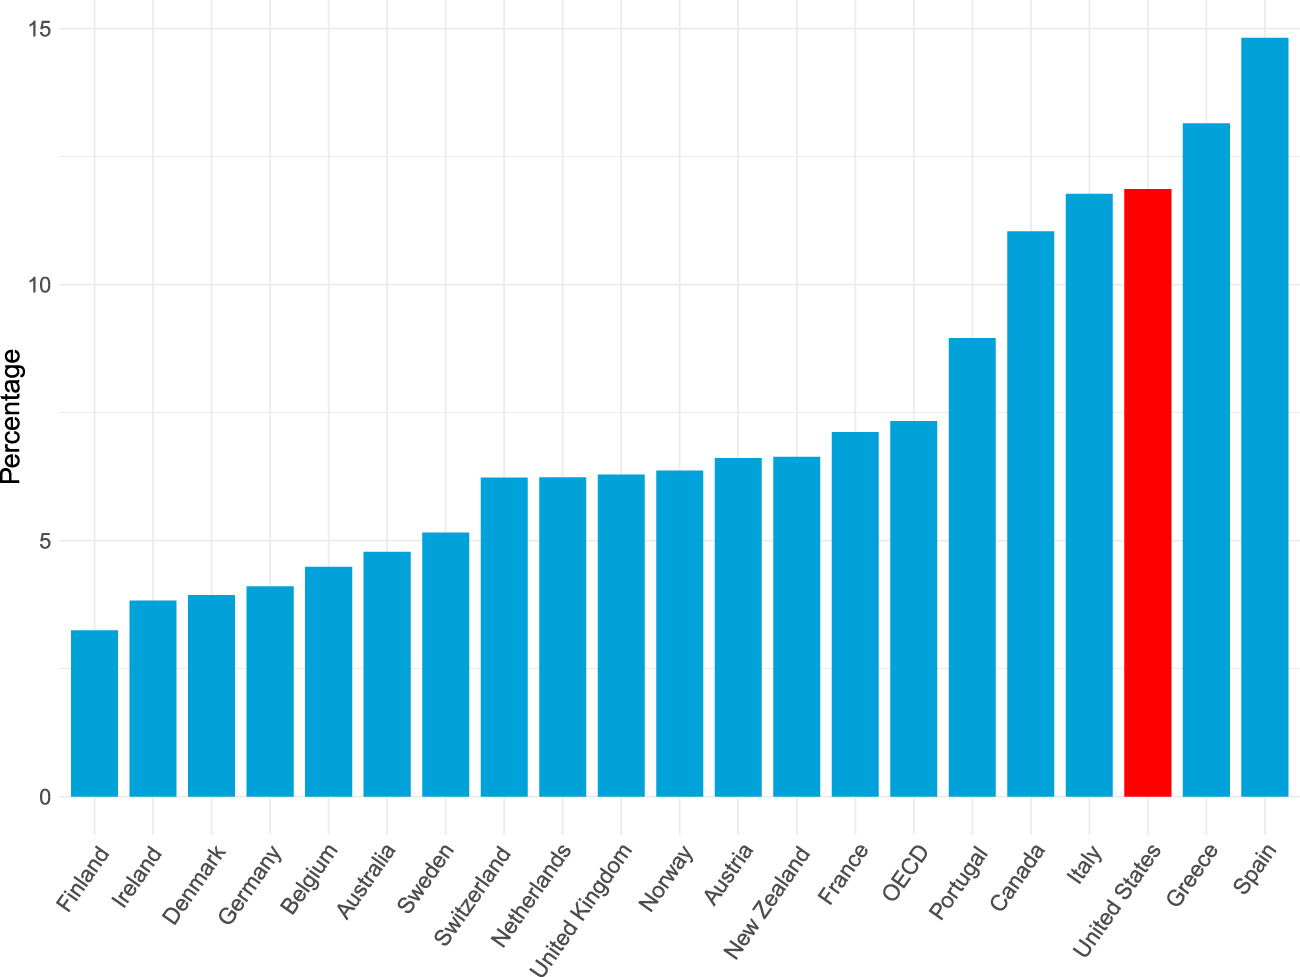
Another way to assess labor market precarity is by comparing the size of the low pay sector across different countries. Here we touch on one of the odd workings of the contemporary American labor market, in particular the puzzle of real wage stagnation even in the context of record low levels of unemployment. Despite nearly a decade of steadily declining unemployment, wages have stayed flat; indeed over the past two years wage growth declined somewhat, from 2.8% to 2.7%, even as unemployment fell from 4.9% to 3.9%.Footnote 55 Figure 8 provides the most recent available data on the size of the low pay sector across the rich democracies, with low pay defined as the share of the total workforce earning less than two-thirds of the median earnings. It shows that the United States sits at the high end of the rich democracies when it comes to the incidence of low-wage work. Economists increasingly attribute the paradox of low unemployment and stagnant wages to overweening employer power, exercised either through monopsony power in local labor markets or through specific strategies (e.g., non-compete clauses, no poaching agreements, or mandatory arbitration clauses) that dampen competition for labor, including low-skill labor.Footnote 56
Size of low pay sector as percentage of total workforce, 2017 or latest available
Source: OECD

Finally, we can assess labor market precarity by examining levels of in-work poverty cross nationally, i.e., the number of people who are working at least one job but whose income through employment is not sufficient to lift them out of poverty. Figure 9 gives OECD data recording levels of in-work poverty after taxes and transfers. Here we see that the United States is again among the worst performers on this measure as well. Moreover, the countries with comparable levels of in-work poverty—Italy, Greece, and Spain—are among Europe’s weakest economies, with unemployment running at 11%, 20%, and 15% respectively.Footnote 57
In-work poverty: Poverty rates among individuals living in households with at least one worker (post tax- and transfer), 2016 or latest available
Source: OECD
The problem of in-work poverty is not a marginal or declining phenomenon in the United States; it applies to the two largest, fastest growing occupations in America—home health care and personal care aides.Footnote 58 These jobs are disproportionately performed by women (91%), people of color (56%), foreign-born (24%), and people with a high school education or less (58%).Footnote 59 In this occupation, whether you are working full time or part time, you almost certainly do not enjoy any of the benefits I just discussed that are standard for all workers in Europe.Footnote 60 Most strikingly, these workers were not even covered by federal minimum wage or overtime rules until just three years ago.Footnote 61 With a median wage of $22,600 (home health care) and $21,000 (personal care aids), close to a quarter of home health care workers fall below the official poverty line (23.4%), and over half rely on some form of public assistance.Footnote 62
In sum, all the rich democracies are experiencing a shared problem of growing contingency and precarity. However, it seems fair to say that the problem of precarity presents itself with special intensity in the United States.
American Capitalism and the Political Economy of Labor
Why might this be the case? Here a comparative perspective is helpful not just in assessing the extent and scope of the precarity problem but also in identifying the specific features of the American political economy that contribute to these outcomes. The first and most obvious is the peculiar character of the American welfare state. I do not need to dwell on this factor, because this is one area in which much fruitful work has been done by scholars of American social policy.Footnote 63 For our present purposes the key point is not so much the overall underdevelopment of the American social net but the fact that so much social provision in the United States is tied to the standard employment relationship, which, as we have seen, is in decline.
However, the literature in comparative political economy is rich in insights about a range of other institutions that contribute to the outcomes I have highlighted here. With more space, I could address the way in which the U.S. system of education and training exacerbates precarity in the United States, or to the way in which corporate governance, finance, and even anti-trust policy fuel precarity.Footnote 64 Instead, I will just zero in on one aspect of the American political-economic landscape that plays a particularly direct role in explaining the scope and intensity of precarity in the U.S. context. This is the legal regime governing labor and employment.
Any such discussion of course begins with labor unions and the rules governing industrial relations. This topic does not come up in the mainstream literature on American politics.Footnote 65 By contrast, organized labor features very prominently in the literature on the comparative political economy of the rich democracies—for good reason, because unions have been the key protagonists in expanding social protections and reducing inequality. In fact, one of the most robust findings in the literature on comparative political economy is that the strength of the organized labor movement is associated with lower inequality (especially low-end inequality) and more generous social protections.Footnote 66
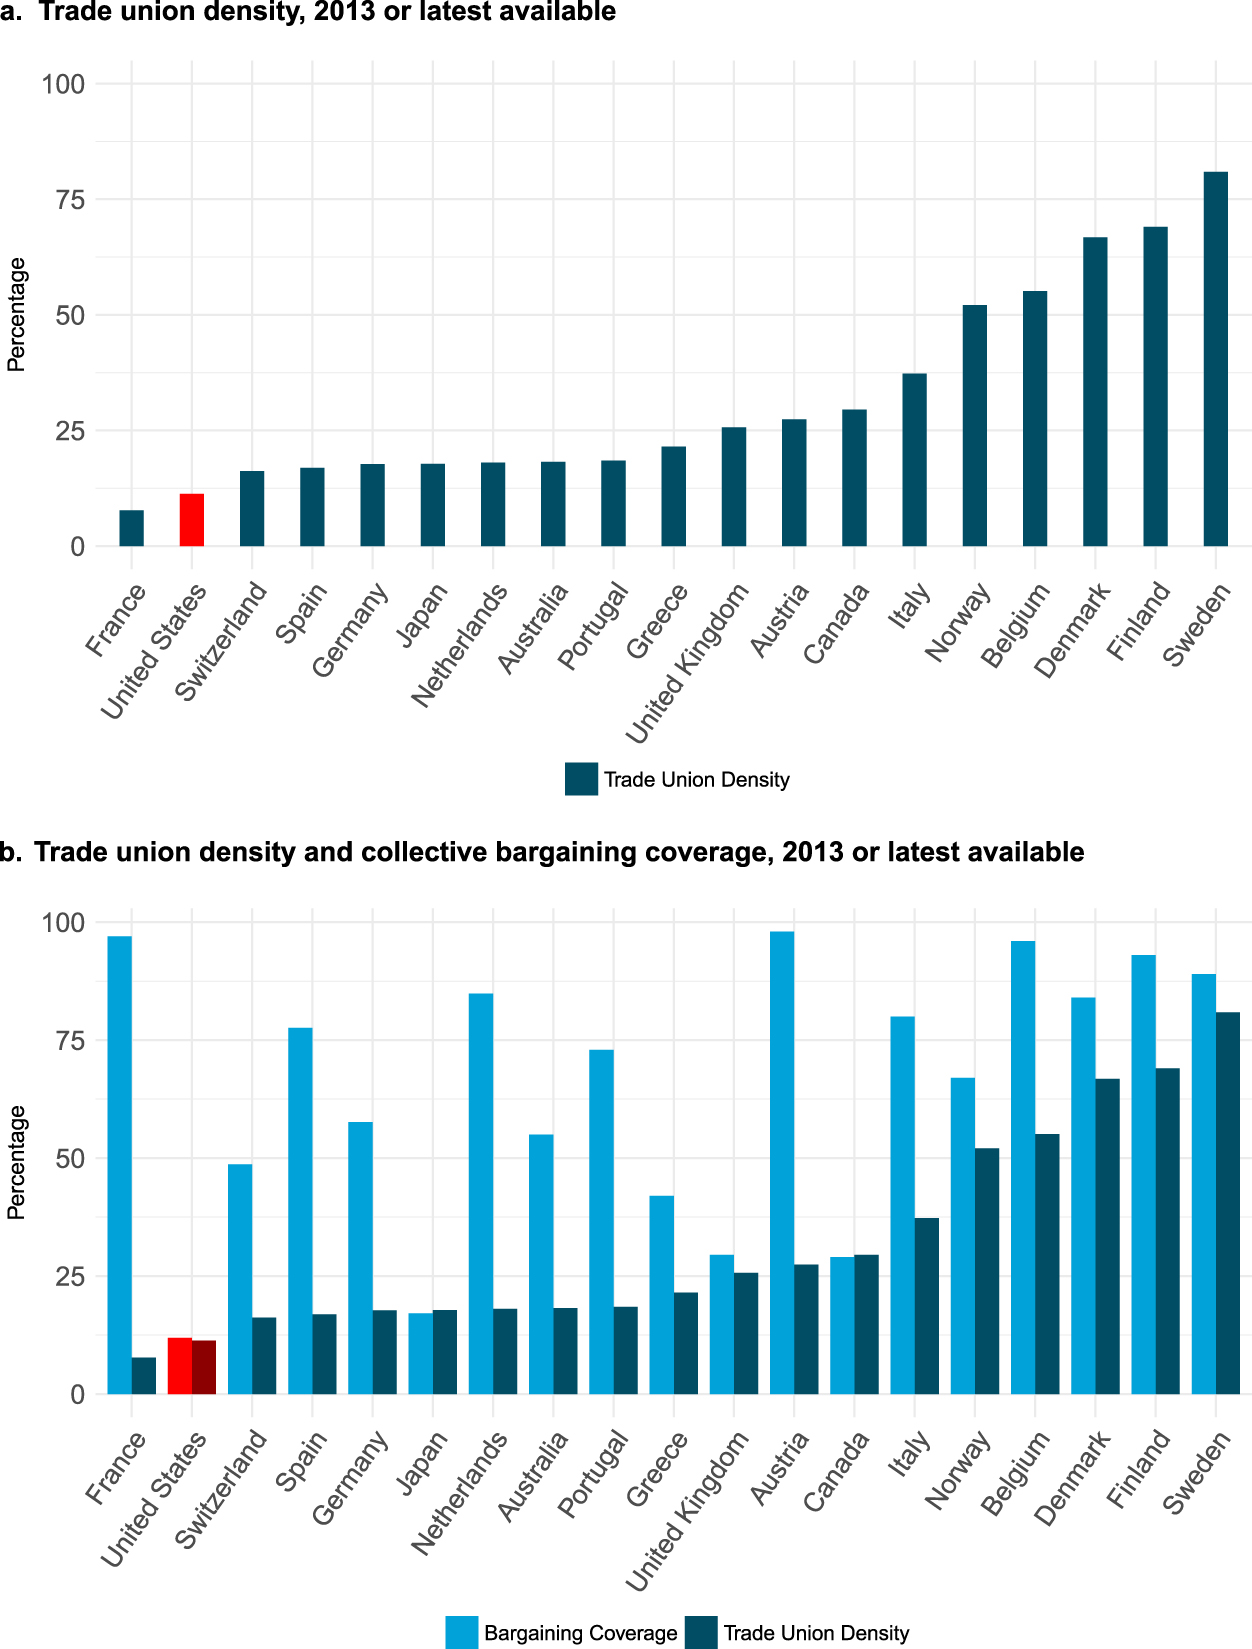
It is well known that American unions have been in decline for several decades now.Footnote 67 However, most people tend to underestimate the magnitude of the difference that separates the United States from most of the other rich democracies. Figure 10a provides a comparative view of union density (i.e., how many people belong to a union?) and it confirms that the United States is close to the bottom with respect to union membership. However, the picture changes dramatically when we add data on bargaining coverage (i.e., how many people are covered by contracts that unions negotiate, whether or not they themselves belong to a union?). Thus, figure 10b documents vividly that most of the other countries with similarly low levels of union membership achieve far higher levels of bargaining coverage.Footnote 68
Trade union density and collective bargaining coverage
Source: ILO Labor Relations and Collective Bargaining, ICTWSS Database on Institutional Characteristics of Trade Unions
To give a sense of what this means, especially for low-skill, low-income workers, consider the following comparison between France and the United States, the two countries with the lowest union membership rates.Footnote 69 The unionization rate of retail workers is actually higher in the United States than it is in France. Yet a far larger share of French retail workers are covered by labor contracts, because the terms that unions negotiate with the large retailers are carried over to cover smaller companies as well, whether or not their workforces are unionized.Footnote 70 This explains why the average hourly wages of non-managerial retail employees in France are much closer to the average hourly wages for the economy as a whole (90%, compared to under 70% in the United States).Footnote 71
The key difference is clearly not union membership per se; instead, it goes back to the foundational rules governing industrial relations in the two countries. As anyone who has seen the movie Norma Rae knows, the basic rule in the United States (very different from Europe) is that in order for workers to gain representation by a union, the union has to win a majority vote in a particular bargaining unit—typically a particular workplace. Accomplishing this turns out to be uncommonly difficult in the United States. While the rules governing industrial relations give workers the right to form unions, they also give employers extraordinarily strong tools to resist unionization, stronger than any other rich democracy.Footnote 72
If the ground rules thus make it difficult for unions to organize workers in the first place, recent trends toward fissurization compound the problem. When firms spin off operations across a wide range of subcontractors, suppliers, and franchises, this multiplies exponentially the number of workplaces in which unions would have to mount and prevail in organizing campaigns. It also leaves workers with no bargaining rights vis-à-vis the core firms that actually exert ultimate control over their wages and working conditions, while the prohibition on secondary strikes and boycotts in the United States makes it illegal in many cases for unions to picket or boycott these companies. As Kate Andrias has pointed out, the rules governing union organization in the United States are almost uniquely ill-suited to deal with the transformation of the firm that is currently underway.Footnote 73 Fissurization actively fragments workforces and undermines labor’s collective bargaining power at a time when unions confront increasingly concentrated and virulently anti-union business interests.Footnote 74
If this were not enough, these obstacles are combined with a second feature that is completely distinctive and that is a direct legacy of the New Deal compromise with the Jim Crow south. That is that some of the most vulnerable groups of workers—notably agricultural workers and domestic workers—are specifically excluded from the protections of the 1935 National Labor Relations Act that governs union organization. The home health care workers I was talking about earlier? Under prevailing federal law, many of them lack any rights to collective bargaining, and could not organize into a union even if they wanted to.Footnote 75 Domestic workers were also excluded from the 1938 Fair Labor Standards Act that was meant to provide some minimum wage and hours protections for all workers, whether or not they are unionized.Footnote 76 Domestic workers everywhere are subject to all sorts of unreported abuse; however, no other rich democracy expressly assigns them such a marginal status under the law. Thus, outside of a handful of states, domestic workers are still fighting for fundamental protections—among others, the right to rest breaks, the right to eight hours of sleep, and basic protections against abuse and sexual harassment, which is rampant in the domestic care industry.Footnote 77 To me, this is the very definition of precarity.
Finally, another group that is both outside the usual system of benefits and explicitly prohibited from organizing under U.S. labor law are independent contractors. This is the group that is at the core of the emerging gig economy that I mentioned at the outset. In fact, it is not just that independent contractors cannot form unions to bargain collectively; when they do organize this is viewed as collusion (price-fixing) under prevailing antitrust law in the United States. By contrast, concentrations of market power that are exercised by firms are not viewed as problematic so long as they do not leave consumers worse off.Footnote 78 This has led to the perverse situation that Uber—which occupies a dominant position in the local transportation market in many municipalities, operates unencumbered by antitrust legislation, but when Uber drivers in Seattle sought to organize to negotiate collectively with the company, they were hit with an antitrust suit that they are still fighting.Footnote 79
This example points to a final consideration in the advance of precarity in the United States. It has to do with the role of consumers, and here I come back to where I started. In a way, consumers are drawn into complicity in the trends I have been describing. Consumers wield considerable power in the American context.Footnote 80 However, what is striking is how rarely it is wielded on behalf of workers. On the contrary, where (as in the United States) there is no organized countervailing power advocating on behalf of workers—where there is nothing pulling in the other direction—American consumers instead are often enlisted in a kind of explicit or implicit alliance against labor.
Some companies cultivate such alliances explicitly: for example, Uber has never been shy about mobilizing its users, enlisting them (often through the app itself), to support the company in its various battles with regulators.Footnote 81 Often, however, the alliances are more subtle, such as with rewards programs that carry benefits for customers and companies, but by encouraging labor-saving behaviors that operate to the disadvantage of workers. Moreover, there is a self-enforcing dynamic; Walmart for example, maintains that it has to keep its labor costs down so that it can continue to deliver “everyday low prices”—primarily to low-income families.Footnote 82
Then there is Amazon. Amazon is currently among the most popular companies in the United States—and one of the country’s worst low-end employers.Footnote 83 The company dominates the online retail market and is pulling the entire sector over to its business model, including its labor practices. What most of us know, but choose not to think too much about, is that what is behind that whole operation—what makes it possible to get those packages delivered so fast and so cheaply—are the people who work in the company’s fulfillment centers, whose jobs are brutal. They work at a frantic pace, and their hours fluctuate wildly depending on the season. Yet from a consumer perspective, it seems to be irresistibly convenient to have that book (or whatever) delivered to us in two days flat.Footnote 84
I could provide any number of further examples. The point is that the problem is pervasive. It is structural, rooted in the ways in which the institutions of our political economy reward and encourage business models that are organized around reducing labor costs to a bare minimum. When this translates into the lower prices that consumers crave, and that the American anti-trust regime sanctifies, it is a powerful force—and one that in this country faces almost no countervailing forces.
A few years ago, Jenny Mansbridge gave her presidential lecture on the need for “legitimate coercion” in order to solve pressing collective action problems.Footnote 85 Among other things, she argued that because it is often hard, individually, to do the right thing, we sometimes need to be forced, together, to do the right thing. To me, there is great need for legitimate coercion on behalf of vulnerable workers in the current period.
Much more could be said about how other features of the American political economic landscape contribute to the growth of the precariat in the United States. Ours is a precariat that is in some ways so big and so ubiquitous that we don’t see it; it is hidden in plain sight all around us, including of course at this conference. In such a context, the value of comparative analysis is that it can render the invisible more visible. Comparative analysis helps us realize how incomplete and misleading it is to make broad assessments about the rosy state of our labor market by looking only at last month’s jobs figures. Comparative analysis reveals what an outlier the United States is not just with respect to high-end inequality—which we knew—but also with respect to inequality at the low end of the income ladder. Finally, comparative analysis serves as a powerful and chilling reminder of how our labor and employment laws still reflect and even carry forward the legacy of slavery and Jim Crow. In other words, comparative analysis helps us see clearly how the market outcomes that we often take as “natural” or given are in fact powerfully shaped by policy, by politics, and by political choice.
Capitalism and Democracy: The American Precariat in Comparative Perspective
To conclude—and to return to this year’s conference theme on democracy: I began this talk by noting that we know quite a lot about the individual-level, behavioral aspects of American democracy based on a large mainstream literature centering on the opinions Americans hold and the way they cast their ballots. Public opinion and elections are clearly important, as of course recent political developments have shown. However, studies that focus on the beliefs and behaviors of individual voters do not capture the whole of what we mean by democracy. Surely the equality to which we aspire in a democracy is not just a matter of democratic procedures, as important as these are. It is animated as well by substantive ambitions and a sense of what a just society looks like.
Previous students of American politics understood this deeply and pursued it with passion in their own scholarship. In two rarely cited works by one of our discipline’s great theorists of democracy, Robert Dahl made the case for economic democracy, or what he called the “right of workers to democracy within firms.”Footnote 86 He argued that if what we are talking about is an egalitarian agrarian order dominated by small family-owned and family-operated farms, then the Lockean defense of private property that is so central to American capitalism “made good sense morally and politically.”Footnote 87 However, he went on to argue that the defense of the autonomy of private property took on an entirely new character when it was extended, under radically changed economic circumstances, to the modern corporation: “Because the internal government of the corporation was not itself democratic but hierarchical and often despotic, the rapid expansion of this revolutionary form of economic enterprise meant that an increasing proportion of the demos would live out their working lives, and most of their daily existence, not within a democratic system, but instead within a hierarchical structure of subordination.”Footnote 88 What Dahl concluded was that, when it was applied to the modern industrial economy, the Lockean defense of private property was perverted because it simultaneously immunized hierarchically organized corporations from all internal democratic controls while also impeding the government from imposing any such controls from without.
A full analysis of our own democracy and its discontents thus requires that we look beyond the individual level attitudes and behaviors that figure centrally in so much work in political science. It even requires that we look beyond the formal constitutional questions with which we are all, with justification, so preoccupied these days. It requires that we take a close look as well at the macrostructures of the American political economy that produce the kinds of economic insecurities that I have highlighted here, and that often render real democratic engagement by ordinary citizens difficult if not impossible.
It follows, I think, from what I have said that realizing not just the procedural but also the substantive aspirations that we attach to the concept of democracy increasingly demands forms of engagement that go beyond just voting. To me the challenge—to which political scientists have a lot to contribute—is to consider the question of how to mobilize and empower citizens, to give them the capacity to contest the exercise of power not just in politics but also in the market.



