1. Introduction
The relationship between climate change and armed conflict has gained increasing attention from academics and policy makers alike in recent years (see, e.g., Barnett and Adger, Reference Barnett and Adger2007; United Nations, 2007; Burke et al., Reference Burke, Miguel, Satyanath, Dykema and Lobell2009; Hsiang et al., Reference Hsiang, Marshall and Edward2013), especially after the publication of the fourth assessment report of the Intergovernmental Panel on Climate Change (IPCC, 2007). French President Nicolas Sarkozy (Reference Sarkozy2008) warned that ‘climate change is already having considerable impacts on security […] and the Darfur crisis will be only one crisis among dozens’. President Obama in his Nobel Peace Prize acceptance speech warned that climate change ‘[w]ill fuel more conflict for decades’ (White House, 2009). Similarly, the recently released Strategic Sustainability Performance Plan by the US Department of Defense (DOD, 2014) predicts that, in addition to direct effects on military infrastructure, climate change will have indirect effects on regional stability, particularly on those areas of the world already prone to conflict.
Among its wide range of impacts, climate change is expected to increase the frequency and severity of natural hazards such as floods, droughts, heatwaves, storms and tropical cyclones. These hazards can become natural disasters with profound environmental, political and social consequences (Nel and Righarts, Reference Nel and Righarts2008). In this paper, we empirically examine the impact of floods on the onset and prevalence of internal armed conflict in a large sample of countries and years. We focus on large, catastrophic flood events – those causing significant damage to structures or agriculture, with long reported intervals (decades) since the last similar event, and/or fatalities (Brakenridge, Reference Brakenridge2011). Floods are a potentially ‘dangerous’ consequence of climate change. Having a rapid onset compared to changes in mean conditions (such as temperature, sea level or annual precipitation), they allow for less time to adapt (Falk, Reference Falk1971; Barnett, Reference Barnett2003).
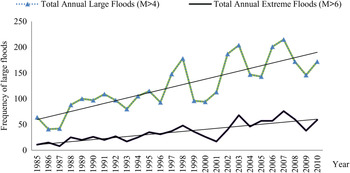
Floods are already the most frequent natural disaster, accounting for 40 per cent of all natural disasters reported over the last 25 years (CRED/OFDA, 2011), and the reported frequency and damages of floods show a positive trend (figure 1) that is expected to continue (IPCC, 2007, Reference Field, Barros and Stocker2012). It is estimated that by 2020, climate change will have exposed 6 million more people living in coastal areas to flooding (39 per cent more than would otherwise be the case) (Warren et al., Reference Warren, Arnell, Nicholls, Levy and Price2006). Although moderate floods can be beneficial in the medium to long term (Fomby et al., Reference Fomby, Ikeda and Loayza2011; Cuñado and Ferreira, Reference Cuñado and Ferreira2014), extreme weather events can be highly disruptive. In 2010, hydrological disasters caused about US$46.9 billion in economic damages worldwide (Guha-Sapir et al., Reference Guha-Sapir, Vos, Below and Ponserre2011), were responsible for over 8,100 deaths and displaced over 179 million people (CRED/OFDA, 2011). Despite their huge policy relevance, the political consequences of large floods remain understudied. Only a few studies (e.g., Nel and Righarts, Reference Nel and Righarts2008; Bergholt and Lujala, Reference Bergholt and Lujala2012 have empirically analyzed the impact of natural disasters on armed conflict, and only one (Ghimire et al., Reference Ghimire, Ferreira and Dorfman2015) has investigated the role of the displacement caused by floods on armed conflict.
Frequency of large floods in the world (1985–2009)

Our study differs from previous empirical work on natural disasters and armed conflict in several important ways. First and foremost, most previous studies treat natural disasters as phenomena whose incidence is exogenous. However, because the very definition of a natural disaster is linked to society's response capacity, state and social structures weakened by conflicts are less likely to effectively respond to the impacts of a natural hazard, making it more likely that a natural disaster will result (Barnett and Adger, Reference Barnett and Adger2007; Ferris, Reference Ferris2010).Footnote 1 Disasters are often described as a result of the combination of exposure to a hazard, pre-existing conditions of vulnerability, and insufficient capacity to reduce or cope with the potential negative consequences. More generally, environmental change does not undermine human security in isolation from a broader range of social factors that include poverty, access to opportunities, social cohesion and institutional effectiveness (Barnett and Adger, Reference Barnett and Adger2007). For example, countries with higher income and better institutions are less vulnerable to and better able to cope with natural hazards (Kahn, Reference Kahn2005; Ferreira and Ghimire, Reference Ferreira and Ghimire2012; Ferreira et al., Reference Ferreira, Hamilton and Vincent2013). On the other hand, the incidence of natural disasters is increasing because of economic growth and growing exposure of population and infrastructures in disaster-prone areas, floodplains in particular (Raschky, Reference Raschky2008; IPCC, Reference Field, Barros and Stocker2012). In summary, conflicts and disasters are endogenously determined (Changnon et al., Reference Changnon, Pielke, Changnon, Sylves and Pulwarty2000; Oh and Reuveny, Reference Oh and Reuveny2010) and, in our paper, we model them accordingly.
Secondly, unlike previous studies that group different types of natural disasters indistinctly, we focus on flood disasters. Because different disasters have potentially distinct effects on the risk of armed conflict, grouping them together may mask potentially opposing impacts. Previous studies have found that wetter years are associated with more violence (Hendrix and Salehyan, Reference Hendrix and Salehyan2012; Theisen, Reference Theisen2012), and we hypothesize that this increase in violence could be due to the damaging effects of floods associated with abnormally large precipitation during those years.
Thirdly, unlike most previous studies that use natural disaster data from the Centre for Research on the Epidemiology of Disasters (CRED; www.emdat.be), our data set, specific to floods, comes from the Dartmouth Flood Observatory (DFO; Brakenridge, Reference Brakenridge2011). The DFO archive is used more often than the CRED archive by flood researchers, as it provides more detailed information on flood events, including physical characteristics such as severity, magnitude and duration, and has a reputation for strong quality control (Ferreira et al., Reference Ferreira, Hamilton and Vincent2013).
Finally, unlike most previous studies, we consider alternative definitions of conflict. We consider non-state conflict (in which none of the warring parties is a government), in addition to the commonly used state-based (or simply armed-) conflict indicator, in which one of the battling sides is the government of a state. The rest of the paper proceeds as follows. Section 2 explores the possible links between floods and security that can result in conflict. Section 3 describes the data. Section 4 describes the methods that we employ to address the endogeneity between armed conflict and large floods. Section 5 presents the results, and the last section concludes.
2. Floods and security: theoretical connections
According to the environmental security view of conflict, degradation in natural environments creates scarcity which, when combined with population growth, skewed resource distribution and weak institutions, can lead to violent conflict.Footnote 2 This conflict is more likely to occur at a sub-national level rather than between states, to be persistent and diffuse, and to affect poor societies that are less able to buffer themselves from environmental degradation and the social crises they cause (Homer-Dixon, Reference Homer-Dixon1994, Reference Homer-Dixon1999; Homer-Dixon and Blitt, Reference Homer-Dixon and Blitt1998).
The literature on environmental security suggests different, complementary mechanisms through which extreme flood events might lead to social unrest. First, flood events can result in anger and frustration among groups losing material benefits that they once enjoyed (Grofman and Muller, Reference Grofman and Muller1973; Miller et al., Reference Miller, Bolce and Halligan1977). Relative deprivation theories stress rapid changes in people's conditions such as those arising from rapid-onset floods. Floods can quickly destroy crops, cropland, forests, pastures, freshwater and fish, leading to food shortages and spikes in market prices.Footnote 3 Catastrophic flooding can knock down power lines, contaminate oil supplies and destroy other infrastructure needed to deliver energy supplies, resulting in energy scarcities. With rapid-onset disasters, little time is available for adaptive changes, which increases the likelihood and intensity of violent conflict (Falk, Reference Falk1971).
Scarcities in the aftermath of extreme floods do not generally affect all groups equally, and individuals commonly blame the government for natural disasters regardless of its responsibility and response, leading to hostility towards their government (Achen and Bartels, Reference Achen and Bartels2004). This may result in groups seizing government offices and police stations blamed for inadequately providing basic resources to victims. Although disasters can attract humanitarian aid, such as food and medicines, this aid might be appropriated by rebel groups and diverted to sustain their troops.
Extreme floods, by destroying dwellings and livelihoods in affected areas, may force mass migration of people from affected areas. A sudden influx of migrants can disrupt internal migration patterns, lead to unplanned urbanization and increase competition for jobs, housing and other resources in the receiving areas (Kaya, Reference Kaya1994; Hugo, Reference Hugo1996). This situation can create distrust between migrants and locals and intensify ethnic tensions if they belong to different ethnic groups (Suhrke, Reference Suhrke and Gleditsch1997; Reuveny, Reference Reuveny2007). In addition to much anecdotal evidence,Footnote 4 findings in Ghimire et al., (Reference Ghimire, Ferreira and Dorfman2015) support this transmission channel.
Because of immediate damage to capital and agriculture, extreme events can have large negative short-run macroeconomic impacts. For instance, the 2010 floods in Pakistan damaged 3.3 million ha of standing crops, more than 5,000 miles of primary and secondary roads, 400 bridges, 400 miles of railways, 11,000 schools and 200 health facilities, and reduced Pakistan's GDP growth in that year by two percentage points (UNITR, 2010; Looney, Reference Looney2012). In Thailand, floods in 2011 resulted in US$45 billion damages (almost 14 per cent of Thailand's GDP) and lowered GDP growth by one percentage point (Xinhua, 2011). Displacement, loss of lives and damages to infrastructure, agriculture and crops can hurt overall economic productivity and result in an economic slowdown (Hendrix and Salehyan, Reference Hendrix and Salehyan2012). During an economic slowdown, the opportunity costs to engage in violence are lower, while the benefits from looting and engaging in violence may become attractive (DiPasquale and Glaeser, Reference DiPasquale and Glaeser1998). In addition, an economic slowdown may increase competition among ethnic groups to control local resources (Olzak, Reference Olzak1992; Brass, Reference Brass2003), and may negatively affect electoral competition and/or the electoral incentives of politicians (Horowitz, Reference Horowitz1985; Wilkinson, Reference Wilkinson2006). This is consistent with the greed and grievance view of conflict pioneered by the influential work of Collier and Hoeffler (Reference Collier and Hoeffler2004).
Extreme floods can lead to violent conflict through the destruction of infrastructures (e.g., roads and communication networks), making it more costly for government troops to suppress rebel groups (Miguel et al., Reference Miguel, Satyanath and Sergenti2004; Hendrix and Salehyan, Reference Hendrix and Salehyan2012). This situation may weaken political institutions and government responses to natural disasters, further increasing the vulnerability to armed conflict (Keefer, Reference Keefer2009; Hendrix and Salehyan, Reference Hendrix and Salehyan2012). As police and military forces needed to enforce law and order engage in relief and recovery efforts, maintaining the rule of law may be challenging in the aftermath of extreme events. Following the 2010 floods in Pakistan, with the government troops concentrated in rescue and relief works in a few urban areas, the Pakistani Taliban, exploiting the ‘political space’ created by the floods, intensified their activities in several parts of the country (CBS News, 2010).
Finally, extreme events can strain government budgets through a simultaneous reduction of the tax base and increased demand for services and assistance by those hardest hit. Reduced state revenue hinders delivery of public goods, and relief and rescue activities, which in turn reduces the political legitimacy of the government and may give rise to political challengers. For instance, the weak response of the Algerian government in the aftermath of large flooding in 2001, 2002 and 2008 resulted in violent protests and riots (Hendrix and Salehyan, Reference Hendrix and Salehyan2012).
Although in principle the theoretical mechanisms described above can apply to many forms of social unrest, from peaceful protests and demonstrations, strikes and riots all the way to armed conflict, we focus on the latter – armed conflict. One reason is of a practical nature; as described below, our data come from the UCDP/PRIO data set which is one of the most accurate and well-used data sources on global armed conflict. Its definition of armed conflict (as state-based conflict) is becoming a standard as to how conflicts are systematically defined and studied. More importantly, state-based conflicts are much more costly and deadly than other forms of conflict. According to the Human Security Report (2012), reported battle deaths per year from the average non-state conflict between 1989 and 2009 (approximately the time frame covered by our analysis) were about 16 per cent of the battle death toll from the average state-based conflict during the same period. Because of their broader spatial coverage and longer duration, state-based conflicts have greater socio-economic and political impacts than non-state conflicts.
3. Data
We compiled annual data on conflict, large floods and a range of socio-economic and institutional characteristics for 126 countries between 1985 and 2009 (these are all the countries for which data were available). For robustness, we also report results for the sample of developing countries, and for the sample of countries that experienced at least one episode of armed conflict over the sample period (we denote these as ‘conflict prone’ countries). Table A1, in the online appendix available at http://journals.cambridge.org/EDE, lists the countries included in the different sample definitions.
3.1. Conflict data
The main indicator of conflict, ‘armed conflict’, comes from the UCDP/PRIO data set (Gleditsch et al., Reference Gleditsch, Wallensteen, Eriksson, Sollenberg and Strand2002; Themnér and Wallensteen, Reference Themnér and Wallensteen2012). Armed conflict is defined as ‘a contested incompatibility that concerns government and/or territory where the use of armed force between two parties, of which one is the government of the state, results in at least 25 battle-related deaths’. This definition of armed conflict (as state-based conflict) is becoming a standard as to how conflicts are systematically defined and studied. It refers to only politically motivated violence, excluding conflicts among groups without political motives, such as drug cartels. The unit of observation in our analysis is the country-year.
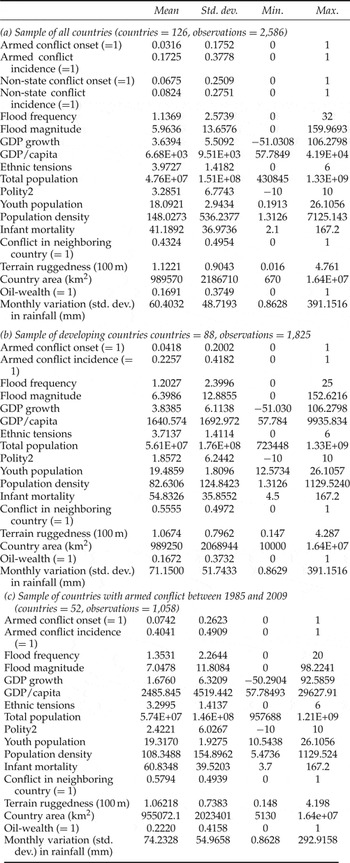
Similar to previous studies (e.g., Fearon and Laitin, Reference Fearon and Laitin2003; Bergholt and Lujala, Reference Bergholt and Lujala2012, we create a variable ‘armed conflict onset’ coded one when a new conflict emerges, there has been a total change in the opposite side or when a conflict that has been inactive for more than two calendar years becomes active again, and zero otherwise. In the data, there are 86 armed conflict onset events (3.2 per cent of the country-year observations for the sample of all countries – table 1, panel a).Footnote 5 Like Miguel et al., (Reference Miguel, Satyanath and Sergenti2004), we also measure armed conflict prevalence with an ‘armed conflict incidence’ variable that takes the value of one in a given country and year if there is any type of armed conflict (new or existing). The data set has a total of 468 armed conflict incidence events or 17 per cent of the observations for the sample of all countries. The proportions for developing and conflict-prone countries are 23 and 40 per cent, respectively.
Descriptive statistics

Notes: Conflict data came from UCDP; flood data from Brakenridge, (Reference Brakenridge2011); GDP growth, GDP/capita, total population, population density, infant mortality, and country area from WDI, (2010); youth population from United Nations, (Reference Nations2010) and WDI, (2010); oil-wealth from World Bank, (2010); ethnic tensions from Political Risk Services, (2011); polity2 from Marshall and Jaggers, (Reference Marshall and Jaggers2011); terrain ruggedness from Nunn and Puga, (Reference Nunn and Puga2012); and rainfall variability from TCCCR, (2011).
In addition to armed conflict, we analyze the impact of large floods on the onset and incidence of an alternative type of conflict in the UCDP: non-state conflict (Sundberg et al., Reference Sundberg, Eck and Kreutz2012). Unlike state-based conflicts, neither of the battling sides is the government of a state. However, the death threshold for inclusion in the database (25 battle-related deaths in a year) is the same. Table 1, showing a larger proportion of non-state conflict onsets than state-based conflict onsets in the full sample, suggests that the former are more easily triggered. The comparison of the conflict incidence proportions, however, suggests that the latter last longer.
3.2. Flood data
Flood data come from the DFO. The DFO records only large events, i.e., those with significant damage to structures or agriculture, long reported intervals (decades) since the last similar event, and/or fatalities (Brakenridge, Reference Brakenridge2011).Footnote 6 We code flood frequency as zero if there are no floods reported in a country-year. Otherwise, flood frequency equals the sum of reported events in a country-year; it ranges from zero to 32 with an average of 1.14 flood events per country-year in the whole sample, while the frequency averages 1.20 for developing countries and 1.35 for conflict-prone countries (table 1). In addition to the number of floods, the DFO reports the magnitude of each flood event as the log of the product of duration (in days) times severity, times affected area (in km2).Footnote 7 Similar to flood frequency, magnitude equals zero if no floods were reported in a country-year. Otherwise, it is the sum of the reported events’ magnitude during the year. Magnitude averages 5.96 in the full sample, 6.40 in the sample of developing countries, and 7.05 in the sample of conflict-prone countries (table 1).
3.3. Other controls
There is general agreement that there are links between environmental change and violent conflict. However, typically environmental factors are not the only source of conflict (Barnett, Reference Barnett2003). The literature on armed conflict has identified a number of relevant socio-economic controls that we include in the regressions. We control for GDP growth and GDP per capita to account for the opportunity cost of rebels to engage in armed conflict, with data from the World Development Indicators (WDI, 2010). We also control for population and population density. According to the greed and grievance view of armed conflict, a larger population means a smaller proportion of resources per capita (Collier and Hoeffler, Reference Collier and Hoeffler2004). Additionally, a larger population may mean a greater probability of disaster events getting reported. Large youth cohorts (youth bulges) may increase both opportunities and motives for armed conflict (Urdal, Reference Urdal2005; Nel and Righarts, Reference Nel and Righarts2008). We control for ‘youth-bulges’ (15–24 year-old population), with data from the WDI (2010) and United Nations (Reference Nations2010).
Other factors affecting the vulnerability to armed conflict are ethnic tensions (Collier and Hoeffler, Reference Collier and Hoeffler2004; Blimes, Reference Blimes2006), democracy scores (Ellingsen and Gleditsch, Reference Ellingsen, Gleditsch, Volden and Smith1997; Hegre et al., Reference Hegre, Ellingsen, Gates and Gleditsch2001), and economic inequality (Nel and Righarts, Reference Nel and Righarts2008). An ‘ethnic tensions’ variable measures the degree of tensions within a country attributable to racial, nationality or language divisions. Data come from Political Risk Services (2011), with higher scores denoting an improvement (reduction) in ethnic tensions. To control for democracy scores, we use the Polity2 regime indicator from the Polity IV data set (Marshall and Jaggers, Reference Marshall and Jaggers2011), ranging from +10 (strongly democratic) to −10 (strongly autocratic). We use both Polity2 in levels and squared to account for a potential nonlinear relationship between democracy scores and the risk of armed conflict (Ellingsen and Gleditsch, Reference Ellingsen, Gleditsch, Volden and Smith1997; Hegre et al., Reference Hegre, Ellingsen, Gates and Gleditsch2001). Nel and Righarts (Reference Nel and Righarts2008) argue that the infant mortality index not only serves as a proxy for overall economic development, but is also a good proxy for economic inequality. Because of the limited coverage and numerous missing values in the Gini coefficient (e.g., Deininger and Squire, Reference Deininger and Squire1996) we use infant mortality rate (fraction of live-born children who die before their first birthday) from WDI (2010).
We control for time-invariant country characteristics, such as terrain ruggedness (from Nunn and Puga, Reference Nunn and Puga2012), country area (from WDI, 2010), and an oil wealth dummy equal to one if a country is an oil exporter, with data from World Bank (2010). It has been argued that it is the competition for the control of resources rather than their scarcity that drives conflict. (Time-invariant variables, however, drop out from the specifications that include country fixed effects.) Finally, since countries in proximity to countries experiencing conflict are more likely to become involved in armed conflict (Alcock, Reference Alcock1972; Most and Starr, Reference Most and Starr1980), we control for this spatial dependency with a ‘conflict in neighboring country’ variable equaling one if there is conflict in a neighboring country-year and zero otherwise, with data from UCDP/PRIO.
We do not control for other types of disasters. While there are popular disaster databases, notably EM-DAT (www.emdat.be), that record other types of disasters, their classification criteria for floods are not comparable to that in the DFO. The DFO records floods independently of their being caused by another disaster (e.g., by a storm, or by an earthquake breaking a dam or triggering a tsunami). EMDAT, however, does not report whether storms or earthquakes (if these are the primary disasters) resulted in floods. This could be especially problematic for storms, as some of them can be highly destructive but not cause flooding (e.g., windstorms) while some of them do. Combining both data sets might thus result in measurement error in the number of other disasters, for example by double-counting some floods.
We are confident that the omission of other disasters does not bias our estimates of the impacts of floods. Such bias might arise from a correlation between floods and other types of disasters. However, as we mention above, DFO records floods resulting from any other disaster, such as tropical storms, cyclones, hurricanes, typhoons, volcanic eruptions and earthquakes, which means that the effect of these other disasters is partially accounted for by the floods variable. More generally, floods could be correlated with other disasters because certain countries (those that are poorer and with weaker institutions) are more prone to experiencing any kind of disaster. As we explain in the next section, we minimize this concern with a three-pronged strategy. First, the regressions include a large number of socio-economic, political and institutional variables that may be correlated with both floods and other types of disasters. Secondly, all the regressions include country and year fixed effects. Thirdly, to correct for the endogeneity of large floods, we instrument floods using rainfall variability (captured by the standard deviation of monthly precipitation) with data from the Tyndall Centre for Climate Change Research (TCCCR, 2011). Summary statistics of all the variables are provided in table 1.
4. Estimation strategy and econometric methods
Floods are natural hazards that occur when water inundates land that is normally dry. One could imagine instances in which one battling side in a war ruptures a dam or levee, but generally floods are initiated by exogenous factors such as excessive rain, rapid ice melting, or large storms or tsunamis resulting in inland sea surges. As previously discussed, however, the large flood disasters considered in this paper are endogenous (that is, determined simultaneously with the occurrence of armed conflict) because the presence of armed conflict reduces a country's ability to effectively provide public services related to floodplain management and flood emergency management, thereby increasing the probability and severity of damaging flood events. Other plausible sources of endogeneity are measurement error in the construction of the flood variable and omitted relevant variables. As explicitly mentioned in the DFO archive: ‘the statistics presented in the DFO Global Archive of Large Flood Events are derived from a wide variety of news and governmental sources. The quality and quantity of information available about a particular flood is not always in proportion to its actual magnitude, and the intensity of news coverage varies from nation to nation.’
We used a two-pronged approach to correct for endogeneity. First, we employed an instrumental-variable (IV), two-step, estimation procedure: two-stage least squares. In the first stage (equation (1)), we estimated a reduced form equation for the flood variable. In the second stage, we estimated an equation for armed conflict (equation (2)) with the fitted values from (1).
 $$Flood_{it} =f(\bf{X}_{\bf{it}-\bf{1}}, Z_{it}, \alpha_i, \delta_t)$$
 $$Conflict_{it} =g(\widehat{Flood}_{it-1}, \bf{X}_{\bf{it}-\bf{1}}, \alpha_i, \delta_t)$$
In equation (1) we use variability (the standard deviation) in monthly rainfall, Z, as an instrument for floods. Rainfall variability is a natural choice for instrumenting floods. Because of standard coping strategies, average rainfall is expected to have a lesser impact on flooding than variations in rainfall patterns (Reardon and Taylor, Reference Reardon and Taylor1996).
Previous studies have used rainfall growth (Miguel et al., Reference Miguel, Satyanath and Sergenti2004; Miguel et al., Reference Miguel and Satyanath2011) or levels (Ciccone, Reference Ciccone2011) as an instrument for economic growth in conflict regressions. Sarsons (Reference Sarsons2011) argues that rainfall is not a good instrument for income because dams and irrigation smooth the impact of weather shocks. We note, however, that this criticism does not affect our study since we instrument floods, not income or economic growth. Moreover, we tested that the instrument satisfies the exclusion restriction; rainfall variation affects armed conflict only through floods. We regressed the conflict variables (conflict onset or conflict incidence) on rainfall variation with and without controls and found that rainfall variation was not a statistically significant predictor of armed conflict in either case (see online appendix, table A2).
Secondly, to minimize the risk of omitted-variable bias, the regressions include the vector of controls X (GDP growth, GDP per capita, ethnic tensions, total population, population density, youth population, polity2 in levels and squared, infant mortality rate, conflict in neighboring country, country area, terrain ruggedness, and oil wealth).Footnote 8 In addition, we exploit the panel structure of our data set, and use country and time fixed effects (FE) to control for unobserved time- and country-invariant factors that may affect the occurrence of and reporting of flood events and/or armed conflict. Country FE (α i ) control for unobserved confounding factors that vary across countries but do not change over time (this might include geographic characteristics, and slowly changing national cultural attitudes or climate characteristics that may affect both floods and armed conflict). Likewise, year FE (δ t ) control for unobserved confounding factors constant across countries but evolving over time (e.g., weaponry technical developments, satellite improvements in flood detection, or common global shocks).Footnote 9
To accommodate lagged effects between flood disasters and armed conflict (Drury and Olson, Reference Drury and Olson1998), we lagged the flood variable by one period in equation (2). We analyzed the robustness of the results to using longer lags and to using a three-year moving average in flood frequency. Additionally, in both reduced form and structural equations, all explanatory variables are lagged one period to mitigate potential endogeneity bias.Footnote 10 Finally, since the dependent variables in equation (2) (conflict onset or conflict incidence) are binary, in addition to estimating (2) using least squares, we present alternative estimates from a logit model.Footnote 11
5. Results
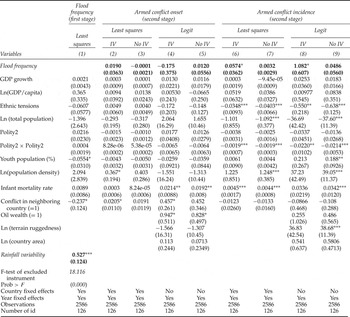
We report estimates for the reduced form equation for floods (equation (1)) in the first column of table 2. Rainfall variability is positive and statistically significant (at a 1 per cent level) to explain flood frequency. The F-test of excluded instrument is 18.116, satisfying the instrument relevance condition for a valid instrument (Baum et al., Reference Baum, Schaffer and Stillman2007).Footnote 12
Floods and armed conflict (1985–2009)

Notes: Estimates as indicated by column headings. Standard errors (clustered at the country level) in parentheses. Standard errors in logit models are bootstrapped using 400 replications.
*** p < 0.01; ** p < 0.05; *p<0.1.
The variables oil wealth, terrain ruggedness and country area are time invariant and drop out from estimates with country fixed effects.
5.1. Floods and armed conflict
Table 2 also shows the results of the estimation of equation (2). Results for armed conflict onset are presented in the left half of the table and for armed conflict incidence in the right half of the table. Results are presented for both least squares and logit specifications. In order to gauge the importance of instrumenting for floods, the IV estimates are contrasted with estimates in which floods are not instrumented (‘No IV’).
In columns 2–5 in table 2, we estimate the impact of large floods on armed conflict onset (i.e., on the emergence of new armed conflict). Flood frequency is not statistically significant in any of the specifications and it has the ‘wrong’ sign in columns 3 and 4.Footnote 13 Columns 6–9 show the estimates for armed conflict incidence. Unlike the results for conflict onset, flood frequency appears to be a statistically significant determinant of armed conflict incidence. The 2SLS-IV results in column 6 show that, on average, one additional extreme flood is associated with a 5.7 percentage point increase in the predicted probability of conflict incidence in a given country-year (at a 10 per cent significance level). The results remain robust in column 8, showing the logit model coefficients; the estimated marginal effect (not shown here) is 4.7, implying that one additional large flood event is associated with a 4.7 percentage point increase in the predicted probability of armed conflict incidence.Footnote 14 In columns 7 and 9 where flood frequency is not instrumented, the results are not statistically significant.
The large difference between the IV and No-IV estimates in both specifications for armed conflict incidence suggests that it is important to correct for the endogeneity in the occurrence of natural disasters. Treating natural disasters as exogenous phenomena may underestimate their impact on broad sociopolitical outcomes. Measurement error and omitted variables can be sources of endogeneity. However, we do not believe that this is what the results in table 2 are showing. First, the variable measuring flood occurrence – the count of large flood events – is quite parsimonious. It does not require detailed information on the exact number of people dead or displaced, or on the economic damages of the particular flood being reported. Secondly, the regressions control for a large number of variables and include country and time FE. The most plausible cause of endogeneity in our study is reverse causality between conflict and floods as described in previous sections, which we address with an IV approach.
Regarding other controls, the results robustly show that an increase in ethnic tensions does not statistically increase the risk of conflict onset but that it does increase the risk of conflict incidence. A one unit improvement in ethnic tensions is associated with about a 3–4 percentage point reduction in the predicted probability of conflict incidence (columns 6–7). (The marginal effect in the logit models of columns 8–9, not shown here, is also about 2–3 percentage points).Footnote 15 We find a nonlinear relationship between democracy scores (polity2) and the risk of armed conflict incidence. As the democracy score improves, the predicted risk of armed conflict incidence decreases at an increasing rate.Footnote 16 Infant mortality is statistically significant (at a 1 per cent level) in columns 4–7 and 9 with an intuitive positive sign. We also find that conflict in neighboring countries is a statistically significant predictor of conflict onset in columns 2 and 4.
5.2. Robustness to alternative flood indicators
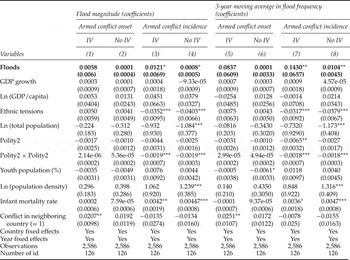
We analyzed the robustness of the results to alternative indicators of flood occurrence. Table 3 presents the results for the FE 2SLS models. (Results for the logit models were similar and are reported in the online appendix, table A3.) We first considered the total magnitude of the floods (as described in section 3) during a given year. As with flood frequency, we lagged flood magnitude and used monthly variability in rainfall as an instrument. Flood magnitude is statistically insignificant to explain armed conflict onsets (columns 1–2), but it is positive and statistically significant to explain armed conflict incidence at a 10 per cent level or better (columns 3–4). Also, the difference in magnitude between the IV and No-IV estimates is large. On average, a unit increase in flood magnitude is associated with about a one percentage point increase in the predicted probability of armed conflict incidence in column 3 (IV estimate), which is an effect 15 times larger than that estimated in column 4 (No-IV).
Floods and armed conflict (1985–2009) second-stage results: alternative indicators for floods

Notes: Least-squares estimates. Standard errors (clustered at the country level) in parentheses.
***p < 0.01; **p < 0.05; *p<0.1.
In columns 5–8 of table 3, we took the previous three years’ moving average in flood frequency to investigate the average effect of an additional large flood when additional years of flooding are considered. We instrumented the flood variable using monthly variability in rainfall (now for the previous three years). Again, floods are statistically significant to explain armed conflict incidence, but not armed conflict onset, and the point estimates are substantially larger in magnitude when they are instrumented. Finally, the results were also robust to longer lags (two and three years) of flood frequency (results not shown here, but available upon request).
5.3. Robustness to the sample definition
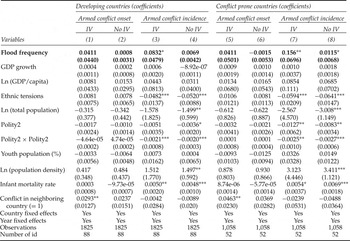
We analyzed the robustness of the results to changing the composition of the sample. From 126 countries in the benchmark specification, we changed the sample to cover only developing countries and conflict-prone countries (which experienced at least one conflict episode over 1985–2009). (Online appendix table A1 lists the countries included in each sample.) Table 4 shows the results for the FE 2SLS estimation. (Results for the logit models were similar and are presented in the online appendix, table A4.) Consistent with previous results, flood frequency is not a statistically significant determinant of armed conflict onset (columns 1–2 for developing countries and 5–6 for conflict-prone countries). It is, however, a statistically significant determinant of armed conflict incidence. For developing countries, on average, one additional large flood is associated with an 8 percentage point increase in the predicted probability of armed conflict incidence (column 3), while the flood frequency is not significant when it is not instrumented (column 4). For conflict-prone countries, the effects are larger in magnitude and statistically stronger. This is what we would expect because this sample includes countries that have experienced at least one conflict episode between 1985 and 2009. On average, one additional large flood is associated with about a 15.6 percentage point increase in the predicted probability of conflict incidence. Flood frequency is also statistically significant (at a 10 per cent level) when floods are not instrumented (column 8).
Floods and armed conflict (1985–2009) second-stage results: alternative sample definitions

Notes: Least squares estimates. Standard errors (clustered at the country level) in parentheses.
***p < 0.01; ** p < 0.05; *p<0.1.
Regarding other controls, as in the baseline specification ethnic tensions, democratic scores and infant mortality are robust determinants of armed conflict incidence (but not conflict onset). Conflict in neighboring country is significant to explain armed conflict onset.
5.4. Floods and non-state conflict
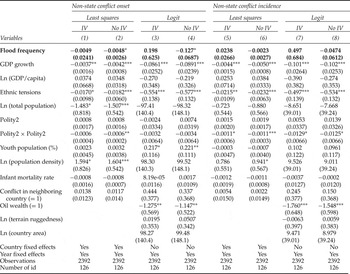
We also analyze the impact of large floods on non-state conflicts. In particular, we estimate onset and incidence of non-state conflicts by using the same estimation methods (IV 2SLS) and set of controls as in the baseline specification.
Results in table 5 suggest that there is no relationship between large floods and non-state conflict (conflict onset and/or conflict incidence) or that if there is one, it is not captured by the number of deaths threshold used in the definition of non-state conflict. This finding supports our choice of armed conflict (state-related conflict) as the dependent variable. Incidentally, the results also show the importance of instrumenting the flood variable. Flood frequency has the ‘wrong’ sign in columns (2), (4), (6) and (8), the ‘No-IV’ columns. These are the specifications that do not account for the endogeneity of large, damaging floods.
Floods and non-state conflict (1989–2009) second-stage results

Notes: Estimates as indicated by column headings. Standard errors (clustered at the country level) in parentheses. Standard errors in logit models are bootstrapped using 400 replications.
*** p < 0.01; ** p < 0.05; * p<0.1.
The variables oil wealth, terrain ruggedness, and country area are time invariant and drop out from estimates with country fixed effects.
6. Conclusion
Climate change is increasingly viewed as a security threat. Many officials and analysts have argued that climate change will increase political and social instability and result in a proliferation of armed conflict, especially in poor countries or countries with already weak governments. Some of the impacts of climate change on social-ecological systems will be experienced through changes in mean conditions (such as temperature, sea level and annual precipitation) over long time scales. Empirically testing the impact of these long-term changes on security using historical data is challenging due to data limitations, especially in multi-country analyses. However, some impacts of climate change will be experienced through an increase in the intensity and frequency of floods, droughts and other high-impact events for which historical data are readily available. Only between 1985 and 2009 there were over 3,500 large flood events across the world (Brakenridge, Reference Brakenridge2011). Assuming that the past can tell us something about the future, we can use historical data on floods and conflict to shed light on what a future with more and larger floods may look like.
We statistically analyze the impact of extreme flood events on the risk of armed conflict and non-state conflict using data for over 100 countries between 1985 and 2009. We find that large floods increase the predicted probability of continuation of existing armed conflicts, rather than contributing to the emergence of new armed conflicts. This suggests that, on average, floods do not act as a catalyst for opposing factions being united by the common adversity, but that the opposite happens. Looking at both armed conflict onset and armed conflict prevalence allows us to interpret the flood–conflict link from a more nuanced perspective – the factors contributing to the emergence of a conflict are not necessarily identical to those associated with the continuation of an existing conflict. We show that this is the case for large floods. Continuation of an existing conflict depends on factors such as how the conflict is handled by actors, income to support insurgency, propensity of actors to negotiate, difficulties in counterinsurgency, and international support (Uvin, Reference Uvin1999; Bleaney and Dimico, Reference Bleaney and Dimico2011). While we do not have the data to test the role of these channels in our study, our results suggest that in the aftermath of large floods governments are unable to cease ongoing conflicts. This might be because governments are distracted by relief efforts, which could provide opportunities for the rebels to strengthen their presence and fuel their insurgencies against the government. The post-disaster period demands higher government expenses. However, disaster events put a strain on government revenues by reducing tax receipts. Consequently, people's aspirations for relief and reconstruction may remain unsatisfied, leading to growing hostility towards their government and sympathy for rebel groups that enable the continuation of the conflict. Because of the weak government presence, foreign aid might be captured by rebel groups and used to finance their insurgency.
Not surprisingly, the estimated effects of floods are larger in conflict-prone countries; on average, one additional large flood is associated with a 16 percentage point increase in the predicted probability of armed conflict incidence for this sample of countries, while the average increase in predicted probability is 8 percentage points for the sample of developing countries, and 6 percentage points for the sample of all countries. Conflict-prone and developing countries are characterized by lower levels of economic development and weaker political institutions, which makes them more vulnerable to disaster shocks and armed conflict.
Our finding that extreme flood events magnify the risk of prevalence of armed conflict is consistent with anecdotal evidence. Following the 2010 catastrophic flooding in Pakistan, with the security forces concentrating on rescue and relief efforts, Pakistani President Asif Ali Zardari worried that insurgents would exploit the situation to garner support and bolster their ranks with new recruits (Righarts, Reference Righarts2010). Indeed, the Pakistani Taliban began a large recruitment campaign, attempting to enlist 50,000 new fighters in return for food and medicine (IANS, 2010). Further, militants exploiting the chaos ensuing the flooding intensified their attacks on the state apparatus in the Northwest, the area most affected by flooding and the epicenter of Pakistan's fight against al Qaeda and the Taliban (CBS News, 2010). Another recent example comes from Somalia, a country ravaged by the confluence of hydro-metrological disasters and armed conflict for decades. The increased intensity of flooding, combined with weak governance, has increased the risk of civil unrest in the country (Shongwe et al., Reference Shongwe, Oldenborgh, Boer, Hurk and Aalst2008). The inadequate governmental response to the 2009 floods that hit most of the rural areas in the country is blamed for granting opportunities to the rebels to expand their activities (Ferris, Reference Ferris2010).
Our findings are also consistent with results in previous studies that wetter years are associated with more conflict. Our study suggests that the increased violence in wetter years may be partly due to the damaging effects of floods. Global climate models predict that changes in patterns and distribution of precipitation are inevitable consequences of climate change (IPCC, 2007, Reference Field, Barros and Stocker2012). If the historical relationship between extreme flood events and internal armed conflict continues, our results suggest that the future is likely to see more conflict, in the absence of adaptation and mitigation efforts.
Since floods are endogenous, it is imperative to understand the human–flood interactions while formulating floodplain management and flood emergency management. From an econometric standpoint, the estimated impacts of floods on armed conflict prevalence are substantially larger in the specifications that control for the endogeneity of floods, suggesting that previous studies that treat natural disasters as exogenous phenomena may have underestimated their impacts on societal peace.
We end on a note of caution. A limitation of econometric analyses at the country level such as ours is that they assess the strength of the relationships between variables for the ‘average’ country. They are not suitable for identifying the specific causal mechanisms at play in a particular country, so there is a danger of oversimplification when extrapolating the results of such analyses without paying attention to the peculiarities of the case study at hand.