Introduction
The structure of the vertebrate retina is not the same for every species but is modified according to the visual demands placed on the animal. These changes have been described most extensively at the ganglion cell layer (Stone, Reference Stone1983; Land & Fernald, Reference Land and Fernald1992). Prey animals, such as the rabbit, have a horizontal strip of elevated ganglion cell density that enables an increased visual sampling at locations most likely to detect predators (Hughes, Reference Hughes and Crescitelli1977; Stone, Reference Stone1983; Ahnelt & Kolb, Reference Ahnelt and Kolb2000). Similarly, predators that require high-resolution vision typically contain a region of the retina at the center of the optical axis that demonstrates an increased ganglion cell density [area centralis (AC)]. Fish that view the surface of the water have an increased ganglion cell density in the inferior retina, while those that predominantly look beneath them have a corresponding area in the upper retina (Collin & Pettigrew, Reference Collin and Pettigrew1988).
Similar comparative examinations have been done in the photoreceptor layer. Here, too, the distribution and proportion of the two types of photoreceptors inform on the nature of the animal: animals with rod-dominated retinas, such as the rat, typically occupy nocturnal environments, whereas diurnal animals, such as the macaque, have retinas with a mixture of rods and cones to register visual stimuli in photopic and scotopic conditions (Linberg et al., Reference Linberg, Cuenca, Ahnelt, Fisher and Kolb2001).
The composition of the inner nuclear layer (INL), located between the ganglion cell and the photoreceptor layers, has not been extensively compared among species, and differences in its structure have not been reported. This layer is made up of three neural cell classes that relay the visual signals from the photoreceptors to the ganglion cells and sculpt the signals into visual streams (Masland, Reference Masland2001; Wässle, Reference Wässle2004). In mice, macaques, and rabbits, bipolar cells make up about 40% of the cells, horizontal cells are 2%, and amacrine cells comprise 35% (Martin & Grünert, Reference Martin and Grünert1992; Strettoi & Masland, Reference Strettoi and Masland1995; Jeon et al., Reference Jeon, Strettoi and Masland1998). The retinal support cells, the Müller cells, make up the balance. Comparisons of the cells in the INL of the macaque, the rabbit, and the mouse have suggested that the proportion of cells in the INL does not differ significantly among mammals (Jeon et al., Reference Jeon, Strettoi and Masland1998). We investigated this question by studying the retina of the cat. We have found evidence that the transretinal rod pathway is expanded and overrepresented in the cat retina relative to species previously investigated.
Materials and methods
The tissue was obtained from four adult cats (Liberty Laboratories, Waverly, NY, or Harlan, Indianapolis, IN) that had been used for behavioral testing at the Boston University. At the completion of those experiments, cats were anesthetized with a large dose of sodium pentobarbital (≥65 mg/kg, i.v.) and perfused through the heart with saline, followed by 2.5% glutaraldehyde and 2% paraformaldehyde in 0.1 m phosphate buffer, pH 7.4. The eyes were extracted from the orbit, the anterior segments removed, and the eyecups immersed in the same fixative and stored at 4°C until sectioned. All procedures were approved by the Institutional Animal Care and Use Committee of the Boston University School of Medicine and in accord with the Guidelines for the Care and Use of Mammals in Neuroscience and Behavioral Research (National Research Council, 2003).
Tissue processing
The regions of retina studied included AC and 11 locations in dorsal and ventral retina collected along the vertical meridian. AC was identified in the dissecting microscope by flushing a drop of 1% toluidine blue across temporal retina to lightly stain ganglion cells and view unstained blood vessels that encircled but did not invade the area. A scalpel was used to excise AC from the eyecup and then to extend the incisions dorsally and ventrally to make a vertical strip ~5 mm in width. The excised retina was further divided into 1-mm-long segments, 12 in dorsal retina and 10 in ventral retina. The pieces were rinsed in sodium phosphate buffer (3 × 10 min) and postfixed with 1% osmium tetroxide for 30 min. After rinsing, each piece was dehydrated in a graded series of alcohols, embedded in Spurr’s resin (Ted Pella, Redding, CA), and incubated in a 70°C oven for 2–4 days.
After polymerization, 12 blocks from each retina were sectioned to sample the density of cells at multiple retinal eccentricities (Wong & Hughes, Reference Wong and Hughes1987). Approximately fifty to eighty 1-μm-thick serial sections from each block were cut using a Leica Ultracut ultramicrotome. Ribbons of sections were mounted onto glass slides and stained with 1% toluidine blue with 1% borax while heating on a hot plate. The sections were rinsed with dH2O, dehydrated in 95% ethanol, and coverslipped with Permount. Each section was visualized with a Nikon E800 microscope using a 60× Plan Fluor oil immersion objective (numerical aperature 1.2), and a 5400-μm2 region was imaged from consecutive sections using a Hamamatsu Orca cooled ccd camera with MetaVue v6.3 imaging software.
Data sampling and analysis
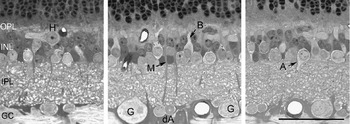
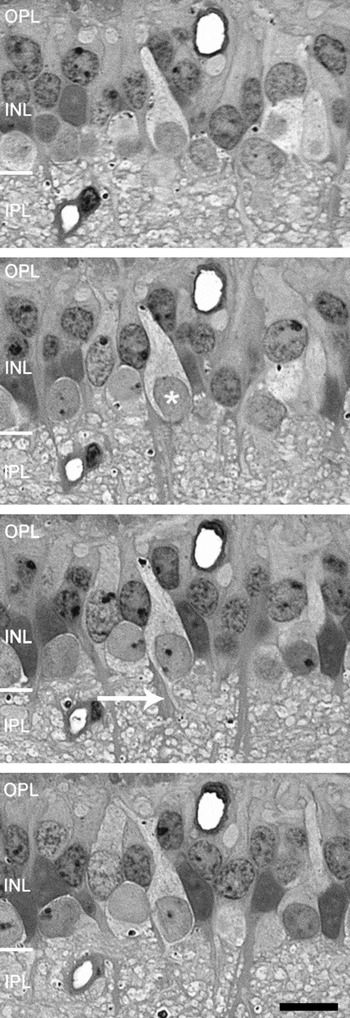
For each eccentricity studied, all INL cells in images from 20 to 30 consecutive sections were identified using standard morphological criteria and counted, a method successfully used by others (McGuire et al., Reference McGuire, Stevens and Sterling1984; Strettoi & Masland, Reference Strettoi and Masland1995). Cells located in this layer included bipolar, amacrine, Müller, and horizontal cells and were clearly distinguished from each other by considering the size and shape of the cell bodies, their location within the INL, cytoplasmic staining characteristics, and the trajectory of axons and dendrites exiting the cell body (Fig. 1). The distinctive morphologies and the relatively large size of cat retinal neurons made it possible to identify every cell in a set of 1-μm-thick serial sections using the light microscope. An example of this identification process is demonstrated in Fig. 2. Starting with the second image in the series, a cone bipolar cell is visible (asterisk). The cell is elongated with pale-staining matrix and has a stout apical process extending toward the outer plexiform layer (OPL) and a thin distal axon entering the inner plexiform layer (IPL). This identification can be verified by following its processes into adjacent sections. Using the same procedure of following cells through sets of serial sections, all cells in a given region can be identified, counted, and their relative fractions computed (Strettoi & Masland, Reference Strettoi and Masland1995).
Vertical sections of the retina to show the characteristics of different cell classes. Cell abbreviations: G, ganglion; dA, displaced amacrine cells; B, bipolar; A, amacrine; M, Müller; H, horizontal cells. Layer abbreviations: OPL, outer plexiform layer; INL, inner nuclear layer; IPL, inner plexiform layer; GC, ganglion cell layer. Scale = 50 μm.

Four sequential sections, each 1 μm in thickness, of the IPL. By looking at consecutive serial sections, it is possible to identify each cell by studying the location of its cell body, its staining characteristics, and the termination patterns of its processes. This particular example shows a bipolar cell (asterisk) in vertical section with dendrites reaching toward the OPL and a thin axon (arrow) exiting from the cell’s soma into the IPL. Scale = 10 μm.

Immunohistochemistry
To unequivocally identify rod and cone bipolar cells and AII amacrine cells, we stained vibratome sections with antibodies against protein kinase C (PKC; to label rod bipolar cells) or calretinin (to label AII amacrine cells) in a single retina. We did not achieve adequate antibody penetration with whole-mount retinas, so we cut sections from five different eccentricities (AC, 1, 4, and 8 mm dorsal to AC, and 4 mm ventral to AC). Small pieces, approximately 2 mm2, were dissected from the sclera, embedded in agarose (low melting point; Sigma, St. Louis, MO), and sectioned at a thickness of 50 μm using a vibratome. Sections were incubated in 1% sodium borohydride for 30 min, rinsed in sodium phosphate buffer (3 × 10 min), and blocked overnight at 4°C in 4% normal donkey serum with 0.5% Triton X-100. The next day, retinas were rinsed in buffer and incubated at 4°C with 2% normal donkey serum, 0.5% Triton X-100, and mouse anti-PKC (1:200; Upstate, Temecula, CA) or rabbit anti-calretinin (1:200; Swant, Bellinzona, Switzerland). After 3 days, the retinas were rinsed thoroughly in buffer and incubated for 2 h with Alexa Fluor 488 donkey anti-mouse IgG (1:200; Invitrogen, Eugene, OR) or Alexa Fluor 488 donkey anti-rabbit IgG (1:200; Invitrogen) and 4 μ m ethidium homodimer (Invitrogen). After rinsing, sections were mounted onto glass slides, coverslipped in Vectashield (Vector Labs, Burlingame, CA), and imaged at high power in the confocal microscope.
Approximately 20 optical sections, spaced 1 μm apart, were imaged in through-focus series in the confocal for each of the five eccentricities studied. At each depth, the tissue was sequentially excited with fluorescein and Texas Red filters to selectively excite the ethidium homodimer and Alexa Fluor labels. Z-series stacks were opened using Neurolucida (MBF Bioscience, Williston, VT), and all ethidium-stained nuclei in the INL were identified by scrolling through the stacks of images. The midpoint of each nucleus was determined and that point marked on the image to ensure that the cells in multiple images were counted only once. Using the same procedures, we identified all PKC- or calretinin-labeled cells in the same optical sections and computed the fraction of all doubled-labeled cells. The samples comprised at least 400 cells at each of the five retinal eccentricities. Partially sectioned cells were omitted from the first image of the series and included from the last image of the stack.
Results
Identification of cell classes within the INL
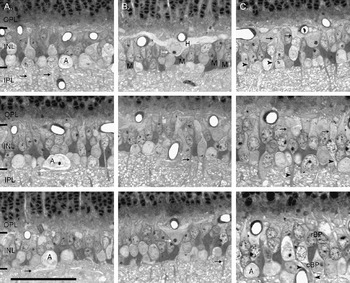
There is a clear difference in the soma sizes and staining patterns of amacrine, bipolar, horizontal, and Müller cells, and they were easily differentiated in the prepared tissue. In the INL, amacrine cell somas occupied the innermost layer of cell bodies. Their rounded somas ranged in size from 8 to 12 μm in diameter, and all but a thin rim of cytoplasm was occupied by the nucleus, which tended to stain more palely than that of bipolar cells. Often, stout proximal dendrites could be seen extending from the base of the somas to enter the IPL (Fig. 3, column A, black arrows); no processes were observed traveling from these cell bodies toward the OPL.
Vertical sections showing examples of the four cell classes found in the INL. (A) Amacrine cells were found in the innermost portion of the INL, were round in shape, and had pale-staining matrix. They had variously sized cell somas with proximal dendrites (black arrows) that extended into the INL. (B) Horizontal cells (white arrows) stained lightly and were found in the outermost layer of the INL and had thick dendritic processes that extended laterally within the OPL. The nonneuronal Müller cells were elongate in shape and had very dark-staining somas and stalk-like processes that projected into the plexiform layers (black arrows). (C) Bipolar cells were elongate in shape and had dendrites that projected toward the OPL (arrows) and thin axons that projected into the IPL (arrowheads). They were most often observed in the middle and outer parts of the INL, but in peripheral retina, they intermixed with amacrine cells (lower panel). Cone bipolar cells typically had larger cell somas and paler staining cytoplasm when compared to rod bipolar cells, which were small darkly stained cells that tended to be located in the outer part of the INL. A, amacrine; H, horizontal; M, Müller; rBP, rod bipolar; cBP, cone bipolar. Scale = 25 μm.

Horizontal cells were the largest cells in the cat retina but were also the least numerous (Fig. 3, column B, white arrows). Their large somas had round nuclei with one or two prominent nucleoli and were always positioned close to the OPL. The cytoplasmic matrix was relatively unstained, and stout lateral processes could be followed exclusively into the OPL. No vitreal-directed processes were ever observed.
Müller cells had darkly stained matrix and a large amorphous shape that was wedged between amacrine and bipolar cell somas in the middle of the INL. Their processes appeared as thick dark-staining stalks that extended from the cell body to the OPL and to the IPL (Fig. 3, column B, black arrows).
Bipolar cells varied most in their location within the INL, staining characteristics of their cell nuclei and matrix, and the size of their somas. The cell somas ranged in size from 6 to 10 μm, with the larger cells tending to have pale matrix as previously described for cone bipolar cells (Cohen & Sterling, Reference Cohen and Sterling1990) and the smaller sclerally placed cells stained darkly with ovoid nuclei similar to those found in rod bipolar cells. Nearly all bipolar cell somas occupied the middle of the INL with elongate shapes and processes exiting from both proximal and distal aspects of the cell bodies (Fig. 3, column C), although in peripheral retina, it was not uncommon to see cone bipolar cells sharing the vitreal layer with amacrine cells (Fig. 3C, lower panel). In these instances, cone bipolar cells were distinguished from amacrine cells on the basis of their smaller size, the direction of their processes, and the larger more prominent nucleoli of the amacrine cells.
In most cases, the largest cells in the INL were found in a single layer located at the boundaries of the INL (amacrine and horizontal cells) with bipolar and Müller cells occupying the middle of the layer. The cells increased in size and the INL decreased in thickness with increasing distance from AC.
Distribution of cell classes
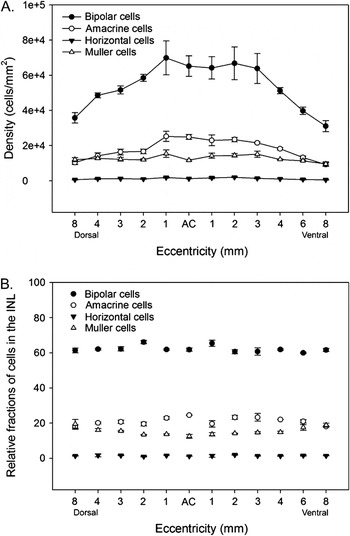
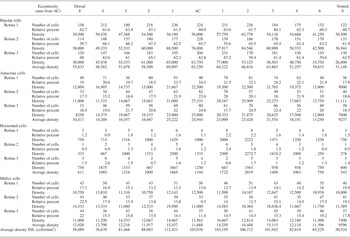
After identifying all cells in consecutive semithin sections, the numbers of cells within each class were counted at 12 eccentricities in dorsal and ventral retina and the fractions computed (Table 1). In each of the three retinas, the cell densities varied between individuals as well as between retinas of a single animal, but the cells showed similar topographic distributions (Table 1). The highest density of INL cells was located in central retina, just outside AC (~112,000 cells/mm2), reached a plateau in midperipheral retina (~80,000 cells/mm2), and then gradually declined toward the periphery (~50,000 cells/mm2) (Fig. 4A).
(A) Density of INL cell classes counted from three retinas. Bars represent standard errors. (B) Percent of cell classes in the INL of cat retina computed from three retinas with standard errors indicated. Bipolar cells accounted for the largest fraction of cells in the INL of cat retina.

Distribution of cell classes in the INL of cat retina

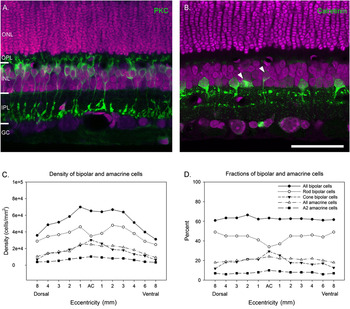
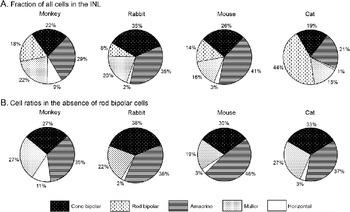
Regardless of differences in density between individuals, the relative fractions of the cell classes were remarkably constant, as has been previously shown for rabbit, monkey, and mouse retinas (Fig. 4). In our tissue, bipolar cells made up the largest fraction of cells in the INL and accounted for 63% of all cells. Amacrine cells and Müller cells accounted for 21 and 15% of cells, and horizontal cells were the least numerous cell class and accounted for 1% of the total (Fig. 4). Curiously, bipolar cells in the cat retina made up a significantly larger fraction of INL cells than have been observed in other mammals (Strettoi & Masland, Reference Strettoi and Masland1995; Jeon et al., Reference Jeon, Strettoi and Masland1998). In rabbit, mouse, and monkey retinas, bipolar cells accounted for 40–43% of cells in the INL compared with 63% that we observed in cat retina. To look more closely at the distribution of bipolar cells in cat retinas, we stained a transect of retina along the vertical meridian with an antibody against PKC and counterstained the retina with ethidium homodimer to label all cells present in the section. Outside central retina, PKC labeled 43% of ethidium homodimer–labeled cells in the INL (Fig. 5). Since bipolar cells accounted for 63% of INL cells in the cat retina, we could reasonably estimate that ~70% of the total bipolar cell population are rod bipolar cells. This number is significantly larger than the fraction of rod bipolar cells that has been counted in rabbit and monkey retinas, which have been estimated to make up between 8 and 18% of INL cells (Fig. 6A) (Martin & Grünert, Reference Martin and Grünert1992; Strettoi & Masland, Reference Strettoi and Masland1995; Jeon et al., Reference Jeon, Strettoi and Masland1998). In AC, the pattern was somewhat different. Here exists the highest density of cones and the lowest density of rods in the cat retina (Steinberg et al., Reference Steinberg, Reid and Lacy1973) and only at this eccentricity did we observe a smaller fraction of rod bipolar cells compared with the numbers of cone bipolar cells (Fig. 5). Rod bipolar cells had a density of ~35,000 cells/mm2 in AC compared to a maximum density of ~46,100 cells/mm2 only 1 mm away. The overall density of bipolar cells did not drop in central retina, however, because the decline in rod bipolar cells was offset by an increase in the density of cone bipolar cells, which peaked at 30,200 cells/mm2.
(A) A retinal section stained with an antibody against PKC to label rod bipolar cells (green) and ethidium homodimer (magenta) and to label all cell nuclei. PKC labeled approximately 44% of all cells in the INL. (B) A retinal section stained with rabbit anti-calretinin to label AII amacrine cells (green) and ethidium homodimer (magenta). Calretinin stained approximately 7% of all INL cell nuclei. Occasionally, bipolar cells and non-AII amacrine cells were also stained (arrowheads). (C) Graph shows the densities of bipolar and amacrine cells across the INL. There was a decline in the numbers of rod bipolar cells in AC and a corresponding increase in the numbers of cone bipolar cells. (D). Graph shows the percent of bipolar and amacrine cells at different eccentricities across the retina. Scale = 50 μm.

(A) Fractions of bipolar, amacrine, horizontal, and Müller cells in monkey, rabbit, and cat retinas. (B) Ratio of cone bipolar, amacrine, horizontal, and Müller cells in monkey, rabbit, and cat retinas computed without rod bipolar cells. Data for rabbit, mouse, and monkey retinas are from Strettoi and Masland (Reference Strettoi and Masland1995), Jeon et al. (Reference Jeon, Strettoi and Masland1998), and Strettoi and Volpini (Reference Strettoi and Volpini2002).

Since the fraction of rod bipolar cells was considerably greater than that observed in other mammalian species, we wanted to see whether this increase was limited to the rod bipolar cell population or whether there was an expansion of the rod pathway through the INL. Rod bipolar cells do not synapse directly with ganglion cells but rather indirectly via AII amacrine cells (Kolb & Famiglietti, Reference Kolb and Famiglietti1974; Kolb & Nelson, Reference Kolb and Nelson1983; Strettoi et al., Reference Strettoi, Raviola and Dacheux1992). If rod bipolar cells account for a larger fraction of bipolar cells in cats, one might expect that AII cells would account for a larger fraction of amacrine cells in cat retina compared to other mammals as well. Results from staining a transect of the retina with rabbit anti-calretinin showed that approximately 7% of all cells in the INL stained with rabbit anti-calretinin (Fig. 5). The fraction of cells was highest in AC (~10%) and then declined to ~6.5% in midperipheral retina and the periphery. Since amacrine cells account for only ~21% of all cells in the INL, this would suggest that AII amacrine cells account for approximately one third of all amacrine cells in the cat retina, a fraction 3 times larger than in rabbit and mouse retinas (Vaney, Reference Vaney and Osborne1990; Vaney et al., Reference Vaney, Gynther and Young1991; Rice & Curran, Reference Rice and Curran2000). In AC, AII amacrine cells accounted for 40% of all amacrine cells, approximately 35% of amacrine cells 1 mm away and then 30% in the midperiphery. In mouse, rabbit, and monkey retinas, AII cells account for only 11% of all amacrine cells (Strettoi & Masland, Reference Strettoi and Masland1996; Mills & Massey, Reference Mills and Massey1999; Rice & Curran, Reference Rice and Curran2000), suggesting that the expansion of the rod pathway in cat retina includes both rod bipolar and AII amacrine cell types.
Discussion
We found that the overall ratio of amacrine cells, Müller cells, and horizontal cells in cat retina is nearly identical to what has been observed in the retinas of rabbits, monkeys, and mice (Martin & Grünert, Reference Martin and Grünert1992; Strettoi & Masland, Reference Strettoi and Masland1995; Strettoi & Volpini, Reference Strettoi and Volpini2002). However, cats have a disproportionately large fraction of bipolar cells. Bipolar cells significantly outnumbered all other cell classes and accounted for approximately 63% of cells in the INL, while amacrine cells accounted for only 21% of all cells. This is in contrast to other mammals, which show a more even distribution of all cell classes in the INL, suggesting that bipolar cells in the cat retina have undergone morphological specializations that underlie function.
The major discrepancy in the fractions of the cell classes between cats and other mammalian retinas can be explained by the large fraction of rod bipolar cells. Approximately 45% of all cell somas in the cat INL stained for the rod bipolar cell marker, PKC, indicating that 70% of all bipolar cells in cat retinas are rod bipolar cells. This is in contrast to rabbit, mouse, and monkey retinas, which have significantly smaller rod bipolar cell populations (8–18%). When the fractions of rod bipolar cells are excluded, the relative distribution of the remaining cell classes in cats is indistinguishable from the distributions of amacrine, Müller, horizontal, and cone bipolar cells in other mammalian retinas (Fig. 6). These results suggest that retina of the cat contains species-specific alterations in the composition of the INL tied to the large fraction of rod photoreceptors.
Comparisons with other studies
In mammals, the rod pathway is made up of three essential cell types: rod photoreceptors, which are highly sensitive to light, a single type of rod bipolar cell that transmits rod signals to the IPL, and the AII amacrine cells that receive inputs from rod bipolar cells on their arboreal dendrites and make outputs with ON- and OFF-cone bipolar cell processes (reviewed by Bloomfield & Dacheux, Reference Bloomfield and Dacheux2001). It would make sense that an expansion of the rod pathway would include changes to each of these cell types. In cat retinas, the distribution profile of rod photoreceptors is inversely related to that of cones. Rod density is lowest in AC (200,000 cells/mm2) where a peak in cone density occurs, rapidly increases to 350,000 cells/mm2 within 1 mm of AC and reaches a peak density of 550,000 cells/mm2 in the dorsal periphery (Steinberg et al., Reference Steinberg, Reid and Lacy1973; Freed et al., Reference Freed, Smith and Sterling1987; Greferath et al., Reference Greferath, Grunert and Wassle1990; Williams et al., Reference Williams, Cavada and Reinoso-Suarez1993). Assuming that the numbers of rod bipolar cells are closely tied to the rod photoreceptor profile, we would expect to see a drop in the fraction of rod bipolar cells within AC and a corresponding increase in the cone bipolar cells. This seems to be the case. When we stained a retinal transect with PKC, the fraction of PKC-labeled cells was smallest in AC (34%) and then increased in the retinal periphery (49%) (Fig. 5). Greferath et al. (Reference Greferath, Grunert and Wassle1990) observed a similar pattern in the density and distribution of rod bipolar cells after staining cat retinas with PKC. In AC, the density of rod bipolars was 42,000 cells/mm2, increased to 46,000 cells/mm2 at eccentricities of 1–2 mm from AC and then declined to 20,000 cells/mm2 in the periphery (Greferath et al., Reference Greferath, Grunert and Wassle1990). The slight drop in rod bipolar cell density in AC can be explained by fewer rods populating central retina (Steinberg et al., Reference Steinberg, Reid and Lacy1973; Greferath et al., Reference Greferath, Grunert and Wassle1990; Williams et al., Reference Williams, Cavada and Reinoso-Suarez1993), necessitating fewer numbers of rod bipolar cells. The overall fraction of bipolar cells is relatively unchanged because of an increased number of cone bipolar cells that corresponds to the increased numbers of cones (Fig. 5).
The overall fractions of cells we counted are in close agreement with earlier reports on the composition of the cat retina. In their analysis of the glycinergic pathway, Wässle et al. (Reference Wässle, Schafer-Trenkler and Voigt1986) counted cells in horizontal sections of cat retinas and classified them as amacrine, horizontal, or bipolar cells by the diameter of their somas and their depth within the INL. At the eccentricity studied, about 24% of all neurons were amacrine cells (16,300 cells/mm2), 75% were bipolar cells (51,400 cells/mm2), and about 1% were horizontal cells (1050 cells/mm2), proportions similar to our results. They suggested that at least half of all bipolar cells must be rod bipolar cells if each rod contacts at least one rod bipolar cell and each rod bipolar cell contacted at least 15 rods (Kolb & Nelson, Reference Kolb and Nelson1983). Freed et al. (Reference Freed, Smith and Sterling1987) reached similar conclusions from examining bipolar cell arrays in AC. They estimated that the rod bipolar cell density was ~36,000 cells/mm2 in AC, which is close to our estimate of 35,000 cells/mm2 (Table 1).
Distribution of AII amacrine cells
Unlike the predictable distributions of the major cell classes in the cat retina, the topographic distribution of AII amacrine cells does not match the distribution profile of the rods and rod bipolar cells. Vaney (Reference Vaney1985) first showed that the density distribution of AII amacrine cells in cat retina is not matched to the topography of the rod photoreceptors. AII cells in whole mounts of fixed retina had a density of 5300 cells/mm2 in central retina and declined exponentially toward the retinal periphery (500 cells/mm2). Our results showed a similar distribution of AII cell densities, although our density estimates were twice the values predicted by Vaney (Reference Vaney1985) (Fig. 5). Some of these differences can be attributed to method; Vaney’s (Reference Vaney1985) counts may have underestimated the true density because of compression of the retina by the coverslip, and our counts were collected from vertical serial sections with the density computed by calculating the fraction of calretinin-stained cells as a fraction of all INL cells. In our tissue, there were also occasional non-AII amacrine cells labeled by calretinin. We did not include these in our counts when the cells were obviously not AII cells (Fig. 5B), but it is possible that some of these non-AII cells were inadvertently included, artificially increasing the observed ratio of AII cells in cat retina. This is in contrast to rabbit, mouse, and monkey retinas, in which AII cells account for approximately 11% of all amacrine cells regardless of eccentricity (Strettoi & Masland, Reference Strettoi and Masland1996; Rice & Curran, Reference Rice and Curran2000). This suggests that the fraction of AII cells is higher in central retina, where the density of rod bipolar cells is lowest, helping to reduce convergence of the rod signal and improve the spatial resolution of the rod pathway in central retina.
What is the significance of the expanded rod pathway in cat retinas?
While cats have been described as primarily nocturnal animals (e.g., Ross, Reference Ross2000; Linberg et al., Reference Linberg, Cuenca, Ahnelt, Fisher and Kolb2001), there is sufficient evidence to indicate that they occupy both daytime and nighttime environments (Kavanau, Reference Kavanau1970, Reference Kavanau1971; Kuwabara et al., Reference Kuwabara, Seki and Aoki1986). Cats also show peaks in activity during the transitions between day and light (a behavioral pattern termed crepuscular; Petter, Reference Petter1962), but their activity patterns are not limited to these times. Instead, cats display multiple instances of sleeping and waking episodes during the nighttime and daytime (Kavanau, Reference Kavanau1971; Kuwabara et al., Reference Kuwabara, Seki and Aoki1986). This type of dual-activity pattern requires versatility in the specializations of the retina that serve to optimize vision in both light and dark domains, and it is likely that the composition of the INL in the cat is part of the balance required to be successful in both environments. The cat has both rods and cones, and an expansion of the rod system makes sense when compared to the macaque monkey and translates to an improved sensitivity of the visual array by reducing the light intensity needed to activate a single dark-adapted rod (Copenhagen et al., Reference Copenhagen, Hemila and Reuter1990).
Unlike the purely crepuscular rabbit, the cat has need of more rods to subserve vision in purely nocturnal environments. As a result, rod photoreceptors in cats are smaller and about 5 times more numerous than those found in rabbits (Hughes, Reference Hughes and Crescitelli1977). Even though the convergence ratio of rods to rod bipolar cells is similar in cats and rabbits, the increased numbers of rods in the cat allow for a better developed sensitivity in the dark (Sterling et al., Reference Sterling, Freed and Smith1988).
It is not immediately clear why the rod system of the cat is expanded relative to that of the mouse. The density of rods in mouse retina is higher than that found in other mammals (Steinberg et al., Reference Steinberg, Reid and Lacy1973; Greferath et al., Reference Greferath, Grunert and Wassle1990; Williams et al., Reference Williams, Cavada and Reinoso-Suarez1993; Jeon et al., Reference Jeon, Strettoi and Masland1998). However, the fraction of bipolar cells is not significantly different from rabbits and monkey (Jeon et al., Reference Jeon, Strettoi and Masland1998; Strettoi & Volpini, Reference Strettoi and Volpini2002), which suggests that in the mouse, the numbers of rods converging onto rod bipolar cells are significantly greater, thereby limiting their visual acuity. The increased number of AII amacrine cells in cats would also improve the resolution of the rod pathway by limiting convergence of the existing rod bipolar cells onto smaller and more numerous AII amacrine cells (Vaney, Reference Vaney1985). Thus, the expansion of rods in the cat may also serve to increase resolution in low-light conditions.
The mechanism for generating the increased number of rod bipolar cells and AII amacrine cells in cat retina is not known, although we believe this feature was shaped by evolutionary adaptation. Evolutionary pressures are sufficient to induce these types of rapid changes to anatomical structures. In a study comparing the retina and lateral geniculate nucleus (LGN) of Spanish wildcats and domesticated cats, Williams et al. (Reference Williams, Cavada and Reinoso-Suarez1993) found the brain size of wildcats to be 50% larger than their more derived relations and had 30–35% more retinal ganglion cells and neurons in the LGN. Even so, the population of rods in the domestic cat retina was at least as great as that observed in the Spanish wildcat, and the number of alpha ganglion cells was unchanged compared with other ganglion cell types. This suggests that in the domestic cat lineage, genetic and epigenetic mechanisms for maintaining scotopic and motion sensitivity were maintained despite the large decline in LGN size and retinal ganglion cell numbers. Williams et al. (Reference Nathans1993) suggest that the major mechanism driving these differences may be due to a modulation in the rate of cell death during development. Alternatively, the large numbers of rods could be generated by a protracted period of retinal cell progenitor proliferation, similar to that shown in the retinas of nocturnal owl monkeys (Dyer et al., Reference Dyer, Martins, da Silva Filho, Muniz, Silveira, Cepko and Finlay2009). In either instance, since the rod bipolar and AII amacrine cells are more recently derived elements of the retina (Nathans, Reference Nathans1999) and likely evolved together, as the numbers of rods increased, it would follow that more rod bipolar and AII amacrine cells would be maintained at constant proportions across the retina to preserve and even improve retinal acuity.
Our results have revealed a substrate for the functional expansion of the scotopic pathway in the cat retina. We have shown that rod bipolar cells and AII amacrine cells represent a larger fraction of cells in the INL that could be useful for improving visual acuity under scotopic conditions. These results argue against a static structure of the INL in all mammals but rather a flexible plan that takes advantage of organisms’ ecological demands.
Acknowledgments
We thank Ms. Claire Folger and Dr. Janet Rollins for help with embedding and serially sectioning the retinas. This work was supported by NIH grants GM 08153 and NS33975 and funding from the PSC-CUNY, #61371-00 39.