





1 Introduction
Rayleigh–Bénard (RB) convection serves as a commonly used system for studying natural convection, which is ubiquitous in many nature and engineering environments. RB convection refers to a fluid layer which is heated from below and cooled from above, and is subject to an external gravitational field. Such system has been extensively studied in recent years, e.g. see the reviews of Ahlers, Grossmann & Lohse (Reference Ahlers, Grossmann and Lohse2009), Lohse & Xia (Reference Lohse and Xia2010) and Chillà & Schumacher (Reference Chillà and Schumacher2012). One key question is how the scalar flux and flow velocity depend on the control parameters. The unifying theory for the flux and flow velocity (‘GL theory’ Grossmann & Lohse Reference Grossmann and Lohse2000, Reference Grossmann and Lohse2001, Reference Grossmann and Lohse2002, Reference Grossmann and Lohse2004), which are measured respectively by the Nusselt number
 $\mathit{Nu}$
and the Reynolds number
 $\mathit{Re}$
, has achieved great success for RB flows (Ahlers et al.
Reference Ahlers, Grossmann and Lohse2009; Stevens et al.
Reference Stevens, van der Poel, Grossmann and Lohse2013), and now has predictive power for the absolute values of
 $\mathit{Nu}$
and
 $\mathit{Re}$
for given control parameters, i.e. the Rayleigh number
 $\mathit{Ra}$
and the Prandtl number
 $\mathit{Pr}$
.
However, in many cases the convection flow can be more complex than in the idealized RB system, e.g. as in the case of external rotation (e.g. King et al. Reference King, Stellmach, Noir, Hansen and Aurnou2009; Horn & Shishkina Reference Horn and Shishkina2015; Wei, Weiss & Ahlers Reference Wei, Weiss and Ahlers2015), inhomogeneities of the top and bottom boundaries (e.g. Wang, Huang & Xia Reference Wang, Huang and Xia2017; Bakhuis et al. Reference Bakhuis, Ostilla-Mónico, van der Poel, Verzicco and Lohse2018), or wall roughness (e.g. Roche et al. Reference Roche, Castaing, Chabaud and Hébral2001; Shishkina & Wagner Reference Shishkina and Wagner2011; Salort et al. Reference Salort, Liot, Rusaouen, Seychelles, Tisserand, Creyssels, Castaing and Chillà2014; Wagner & Shishkina Reference Wagner and Shishkina2015; Xie & Xia Reference Xie and Xia2017; Zhu et al. Reference Zhu, Stevens, Verzicco and Lohse2017; Jiang et al. Reference Jiang, Zhu, Mathai, Verzicco, Lohse and Sun2018). In this study we will investigate another type of complexity, i.e. RB convection driven by two different scalar components. Multiple-component convection is commonly encountered in natural environments. For instance, the density of seawater is mainly determined by temperature and salinity, and chemical reaction flows usually have more than one species. In the ocean, the vertical convection flow driven by both temperature and salinity gradients is usually referred to as double diffusive convection (DDC) (Turner Reference Turner1985; Radko Reference Radko2013). Our previous study on DDC was confined in the so-called fingering regime, where the fluid layer experiences an unstable salinity gradient and a stable temperature gradient (Yang et al. Reference Yang, van der Poel, Ostilla-Mónico, Sun, Verzicco, Grossmann and Lohse2015; Yang, Verzicco & Lohse Reference Yang, Verzicco and Lohse2016). DDC can also happen in an electrodeposition cell with heat and ion concentration as two scalars (Hage & Tilgner Reference Hage and Tilgner2010; Kellner & Tilgner Reference Kellner and Tilgner2014).
Here we will focus on convection flow driven simultaneously by two scalar components with different molecular diffusivities. Our previous study showed that the original GL model can be used to describe the salinity transfer in fingering DDC flow (Yang et al.
Reference Yang, van der Poel, Ostilla-Mónico, Sun, Verzicco, Grossmann and Lohse2015, Reference Yang, Verzicco and Lohse2016). The theory has also been applied to DDC in the diffusive regime, in which the fluid layer is subjected to an unstable temperature gradient and a stable salinity gradient (Hieronymus & Carpenter Reference Hieronymus and Carpenter2016). In the present study the RB convection is driven by two scalar components which are both unstably stratified. Recall that the key idea of the GL theory is to divide both the momentum and thermal fields into their own boundary layer and bulk regions. Then scaling relations are developed for the two respective contributions to the respective dissipation rates, leading to
 $\mathit{Nu}(\mathit{Ra},\mathit{Pr})$
and
 $\mathit{Re}(\mathit{Ra},\mathit{Pr})$
. It is straightforward to generalize this type of argument to multiple scalar fields. We will validate this generalization of the GL theory by direct numerical simulations. We stress that not a single new fitting parameter is introduced; we simply take those determined in Stevens et al. (Reference Stevens, van der Poel, Grossmann and Lohse2013).
The paper is organized as follows. In § 2 we will provide the governing dynamical equations of the system and the details of our simulations. In § 3 we will present the generalization and application of the GL theory to the two-scalar RB convection. Finally § 4 concludes the paper.
2 Governing equations and numerical simulations
The flow under consideration is incompressible and the density
 $\unicode[STIX]{x1D70C}$
is determined by two scalar components, say temperature
 $\unicode[STIX]{x1D703}(\boldsymbol{x},t)$
and concentration field
 $s(\boldsymbol{x},t)$
. The Oberbeck–Boussinesq approximation is adopted, i.e. the fluid density depends linearly on both scalars as
 $\unicode[STIX]{x1D70C}(\unicode[STIX]{x1D703},s)=\unicode[STIX]{x1D70C}_{0}[1-\unicode[STIX]{x1D6FD}_{\unicode[STIX]{x1D703}}\unicode[STIX]{x1D703}+\unicode[STIX]{x1D6FD}_{s}s]$
.
 $\unicode[STIX]{x1D70C}_{0}$
is a reference density, while
 $\unicode[STIX]{x1D703}$
and
 $s$
are the temperature and concentration relative to their respective reference values.
 $\unicode[STIX]{x1D6FD}_{\unicode[STIX]{x1D701}}$
is the positive expansion coefficient respectively for temperature (
 $\unicode[STIX]{x1D701}=\unicode[STIX]{x1D703}$
) and concentration (
 $\unicode[STIX]{x1D701}=s$
). From now on the subscript
 $\unicode[STIX]{x1D701}=\unicode[STIX]{x1D703}$
or
 $s$
stands for a quantity associated with scalar
 $\unicode[STIX]{x1D701}$
. The signs before the two terms indicate that the density is bigger for either lower temperature or higher concentration, which are the usual cases in practice.
The governing equations consist of the momentum equation and the advection–diffusion equations for two scalars, which read
 $$\begin{eqnarray}\displaystyle & \displaystyle \unicode[STIX]{x2202}_{t}u_{i}+u_{j}\unicode[STIX]{x2202}_{j}u_{i}=-\unicode[STIX]{x2202}_{i}p+\unicode[STIX]{x1D708}\unicode[STIX]{x2202}_{j}^{2}u_{i}+g\unicode[STIX]{x1D6FF}_{i3}(\unicode[STIX]{x1D6FD}_{\unicode[STIX]{x1D703}}\unicode[STIX]{x1D703}-\unicode[STIX]{x1D6FD}_{s}s), & \displaystyle\end{eqnarray}$$
 $$\begin{eqnarray}\displaystyle & \displaystyle \unicode[STIX]{x2202}_{t}\unicode[STIX]{x1D703}+u_{j}\unicode[STIX]{x2202}_{j}\unicode[STIX]{x1D703}=\unicode[STIX]{x1D705}_{\unicode[STIX]{x1D703}}\unicode[STIX]{x2202}_{j}^{2}\unicode[STIX]{x1D703}, & \displaystyle\end{eqnarray}$$
 $$\begin{eqnarray}\displaystyle & \displaystyle \unicode[STIX]{x2202}_{t}s+u_{j}\unicode[STIX]{x2202}_{j}s=\unicode[STIX]{x1D705}_{s}\unicode[STIX]{x2202}_{j}^{2}s. & \displaystyle\end{eqnarray}$$
 $u_{i}$
with
 $i=1,~2,~3$
are the three velocity components,
 $p$
is the kinematic pressure,
 $\unicode[STIX]{x1D708}$
is the kinematic viscosity,
 $g$
is the gravitational acceleration and
 $\unicode[STIX]{x1D705}_{\unicode[STIX]{x1D701}}$
is the molecular diffusivity, respectively. The dynamic system is further constrained by the continuity equation
 $\unicode[STIX]{x2202}_{i}u_{i}=0$
.
The fluid layer is between two parallel plates which are perpendicular to gravity and separated by a height
 $H$
. At each plate both the temperature and concentration are kept constant. The scalar difference between two plates is denoted by
 $\unicode[STIX]{x1D6E5}_{\unicode[STIX]{x1D701}}$
. The top plate has lower temperature and higher concentration, thus the flow is driven by both scalars. The flow has four control parameters, namely two Prandtl numbers and two Rayleigh numbers,
 $$\begin{eqnarray}\mathit{Pr}_{\unicode[STIX]{x1D701}}=\frac{\unicode[STIX]{x1D708}}{\unicode[STIX]{x1D705}_{\unicode[STIX]{x1D701}}},\quad \mathit{Ra}_{\unicode[STIX]{x1D701}}=\frac{g\unicode[STIX]{x1D6FD}_{\unicode[STIX]{x1D701}}\unicode[STIX]{x1D6E5}_{\unicode[STIX]{x1D701}}H^{3}}{\unicode[STIX]{x1D705}_{\unicode[STIX]{x1D701}}\unicode[STIX]{x1D708}}.\end{eqnarray}$$
Another useful parameter, which is borrowed from the DDC community, is the density ratio
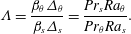 $$\begin{eqnarray}\unicode[STIX]{x1D6EC}=\frac{\unicode[STIX]{x1D6FD}_{\unicode[STIX]{x1D703}}\unicode[STIX]{x1D6E5}_{\unicode[STIX]{x1D703}}}{\unicode[STIX]{x1D6FD}_{s}\unicode[STIX]{x1D6E5}_{s}}=\frac{\mathit{Pr}_{s}\mathit{Ra}_{\unicode[STIX]{x1D703}}}{\mathit{Pr}_{\unicode[STIX]{x1D703}}\mathit{Ra}_{s}}.\end{eqnarray}$$
 $\unicode[STIX]{x1D6EC}$
measures the relative strength of the buoyancy force induced by the temperature difference to that induced by the concentration difference.
 $\unicode[STIX]{x1D6EC}<1$
indicates that the buoyancy force of the concentration difference is stronger than that of the temperature field, which we refer to as the ‘concentration-dominant’ (CD) regime. Accordingly,
 $\unicode[STIX]{x1D6EC}>1$
is referred to as the ‘temperature-dominant’ (TD) regime. The three key responses of the system are the scalar fluxes and the flow velocity, which are measured by the two Nusselt numbers and the Reynolds number
 $$\begin{eqnarray}\mathit{Nu}_{s}=\frac{\langle u_{3}s-\unicode[STIX]{x1D705}_{s}\unicode[STIX]{x2202}_{3}s\rangle _{h}}{\unicode[STIX]{x1D705}_{s}\unicode[STIX]{x1D6E5}_{s}H^{-1}},\quad \mathit{Nu}_{\unicode[STIX]{x1D703}}=\frac{\langle u_{3}\unicode[STIX]{x1D703}-\unicode[STIX]{x1D705}_{\unicode[STIX]{x1D703}}\unicode[STIX]{x2202}_{3}\unicode[STIX]{x1D703}\rangle _{h}}{\unicode[STIX]{x1D705}_{\unicode[STIX]{x1D703}}\unicode[STIX]{x1D6E5}_{\unicode[STIX]{x1D703}}H^{-1}},\quad \mathit{Re}=\frac{u_{rms}H}{\unicode[STIX]{x1D708}}.\end{eqnarray}$$
Here
 $\langle \cdot \rangle _{h}$
represents the average over time and a horizontal plane at arbitrary height. In this work we calculate the two Nusselt numbers by the scalar gradients on the two plates.
 $u_{rms}$
is the root-mean-square value of the velocity magnitude calculated over the entire domain.
Summary of the control parameters, numerical details and the global responses. For all cases
 $\mathit{Pr}_{\unicode[STIX]{x1D703}}=1$
. Columns from left to right: Prandtl number of concentration field, Rayleigh numbers of temperature and concentration, density ratio, aspect ratio of domain (horizontal length over height), horizontal resolution of base mesh (refinement factor of refined mesh), vertical resolution of base mesh (refinement factor of refined mesh), two Nusselt numbers and Reynolds number. Note that some cases appear repeatedly for the completeness of each group.

The governing equations (2.1) are numerically solved by a highly efficient code developed in our group (Ostilla-Mónico et al.
Reference Ostilla-Mónico, Yang, van der Poel, Lohse and Verzicco2015), which has been used intensively in our previous DDC studies (Yang et al.
Reference Yang, van der Poel, Ostilla-Mónico, Sun, Verzicco, Grossmann and Lohse2015, Reference Yang, Verzicco and Lohse2016). The code employs a multiple-grid method, which solves different flow quantities on either a base mesh or a refined mesh. Specifically, momentum and scalars with
 $\mathit{Pr}\leqslant 1$
are always solved on the base mesh. Scalars with
 $\mathit{Pr}>1$
usually require higher resolution and are solved on the refined mesh. The flow quantities are non-dimensionalized by the height
 $H$
, the free-fall velocity defined by concentration difference
 $U_{s}=\sqrt{g\unicode[STIX]{x1D6FD}_{s}\unicode[STIX]{x1D6E5}_{s}H}$
and the scalar differences
 $\unicode[STIX]{x1D6E5}_{\unicode[STIX]{x1D701}}$
, respectively. At two plates no-slip boundary conditions are applied and both scalars are kept constant. In the two horizontal directions the periodic boundary conditions are employed. We fix
 $\mathit{Pr}_{\unicode[STIX]{x1D703}}=1$
and change
 $\mathit{Ra}_{\unicode[STIX]{x1D703}}$
,
 $\mathit{Ra}_{s}$
and
 $\mathit{Pr}_{s}$
. For
 $\mathit{Pr}_{s}<\mathit{Pr}_{\unicode[STIX]{x1D703}}$
(
 $\mathit{Pr}_{s}>\mathit{Pr}_{\unicode[STIX]{x1D703}}$
) concentration diffuses faster (slower) than temperature.
The simulated cases are summarized in table 1. All cases are sorted into five groups, as shown in table 1. Within each group we only vary one control parameter and fix all the others. To ensure the resolution is adequate, the mesh size is chosen to meet the criteria proposed in Stevens, Verzicco & Lohse (Reference Stevens, Verzicco and Lohse2010), i.e. for momentum the mesh size is smaller than the Kolmogorov length scale and for each scalar smaller than the Batchelor length scale, respectively. Furthermore, for the case with
 $\mathit{Pr}_{s}=10$
,
 $\mathit{Ra}_{s}=\mathit{Ra}_{\unicode[STIX]{x1D703}}=10^{7}$
we run another simulation with a higher resolution
 $n_{x}(m_{x})=512(4)$
and
 $n_{z}(m_{z})=384(2)$
as a benchmark. Two different resolutions generate similar Nusselt and Reynolds numbers, with differences smaller than
 $1\,\%$
. In the table we also give the three responses of the flow, i.e.
 $\mathit{Nu}_{s}$
,
 $\mathit{Nu}_{\unicode[STIX]{x1D703}}$
and
 $\mathit{Re}$
. The uncertainty is measured by the standard deviation of temporal fluctuation.
In figure 1 we show the scalar fields for three runs with very different flow morphologies. The case shown in figure 1(a,b) has
 $(\mathit{Pr}_{s},\mathit{Ra}_{s},\mathit{Ra}_{\unicode[STIX]{x1D703}})=(10,10^{7},10^{5})$
, which corresponds to
 $\unicode[STIX]{x1D6EC}=0.1$
. Thus, the buoyancy force is dominated by the concentration difference. However, for this case the molecular diffusivity of temperature is ten times bigger than that of concentration, and the typical size of the temperature plumes is much larger than the concentration ones due to the fast horizontal diffusion. In figure 1(c,d) we show the case with
 $(\mathit{Pr}_{s},\mathit{Ra}_{s},\mathit{Ra}_{\unicode[STIX]{x1D703}})=(10,10^{7},10^{7})$
and
 $\unicode[STIX]{x1D6EC}=10$
. Now the temperature difference dominates the buoyancy force, and the temperature plumes are very active. The concentration plumes become thin filaments embedded within temperature plumes due to the slow diffusion. Figure 1(e,f) displays the case with
 $(\mathit{Pr}_{s},\mathit{Ra}_{s},\mathit{Ra}_{\unicode[STIX]{x1D703}})=(0.1,10^{5},10^{7})$
, or
 $\unicode[STIX]{x1D6EC}=10$
. Although the temperature difference dominates the buoyancy force as is the case in figure 1(c,d), the concentration field has larger molecular diffusivity and therefore the concentration plumes have bigger horizontal size than the temperature plumes.
Three-dimensional volume rendering of the temperature (a,c,e) and the concentration (b,d,f) for three runs with different control parameters. The control parameters
 $(\mathit{Pr}_{s},\mathit{Pr}_{\unicode[STIX]{x1D703}},\mathit{Ra}_{s},\mathit{Ra}_{\unicode[STIX]{x1D703}},\unicode[STIX]{x1D6EC})$
are
 $(10,1,10^{7},10^{5},0.1)$
for the (a,b),
 $(10,1,10^{7},10^{7},10)$
for the (c,d) and
 $(0.1,1,10^{5},10^{7},10)$
for the (e,f), respectively. Note that given
 $\mathit{Pr}_{s}$
,
 $\mathit{Pr}_{\unicode[STIX]{x1D703}}$
,
 $\mathit{Ra}_{s}$
and
 $\mathit{Ra}_{\unicode[STIX]{x1D703}}$
, giving the value for
 $\unicode[STIX]{x1D6EC}$
(by 2.3) is redundant information, but useful for the interpretation of the figures.

Figure 2 displays the profiles of the flow quantities for the three cases shown in figure 1. All profiles are calculated by averaging over time and two horizontal directions. The mean profiles of the scalars suggest that both scalar fields have two boundary-layer regions with high gradient adjacent to the plates, and in between a well-mixed bulk region with nearly constant mean values (see figure 2
a,c,e). In figure 2(b,d,f) we plot the root-mean-square (r.m.s.) profiles of the fluctuations of the scalars and one horizontal velocity component near the bottom plate (the mean profiles of two horizontal velocity components are very similar to each other). As in the RB flow, the peak location in r.m.s. profile can be regarded as the height of the boundary layers. For both figure 2(b,d),
 $\mathit{Pr}_{s}=10$
and
 $\mathit{Ra}_{s}=10^{7}$
. Both scalar boundary layers are always nested inside the momentum one. As
 $\mathit{Ra}_{\unicode[STIX]{x1D703}}$
increases from
 $10^{5}$
in figure 2(b) to
 $10^{7}$
in figure 2(d), all three boundary-layer thicknesses decrease due to the stronger buoyancy force. Interestingly, the concentration boundary layer also becomes thinner even though
 $\mathit{Ra}_{s}$
is the same for the two cases. The cases of panels figure 2(d,f) have the same
 $\mathit{Ra}_{\unicode[STIX]{x1D703}}=10^{7}$
and
 $\unicode[STIX]{x1D6EC}=10$
, and temperature difference dominates the buoyancy force. The temperature and momentum boundary layers have very similar heights for the two cases. However, among the three fields the thickness of the concentration boundary layer is the smallest for
 $\mathit{Pr}_{s}=10$
(figure 2
d) and the largest for
 $\mathit{Pr}_{s}=0.1$
(figure 2
f).
Mean profiles of two scalars (a,c,e) and the root-mean-square of scalars and one horizontal velocity component (b,d,f) for the three cases shown in figure 1(a–f). For clarity of the near wall region and due to the symmetry about
 $z=0.5$
, in (b,d,f) we only show the lower half of the domain. The vertical lines mark the peak locations.

3 Generalized Grossmann–Lohse theory
3.1 Key idea of the original Grossmann–Lohse theory
The GL theory was originally developed for RB flow (Grossmann & Lohse Reference Grossmann and Lohse2000, Reference Grossmann and Lohse2001, Reference Grossmann and Lohse2002, Reference Grossmann and Lohse2004) to provide an unifying theory to account for the dependences
 $\mathit{Nu}(\mathit{Ra},\mathit{Pr})$
and
 $\mathit{Re}(\mathit{Ra},\mathit{Pr})$
, and indeed successfully does so for most of the existing experimental and numerical results (Ahlers et al.
Reference Ahlers, Grossmann and Lohse2009; Stevens et al.
Reference Stevens, van der Poel, Grossmann and Lohse2013). Here we will briefly describe the theory for completeness, and then discuss the extension to the current two-scalar convection flow. For full details the readers are referred to the original references.
The GL theory is built upon the exact relations between the dissipation rates and the global fluxes. For convection flow driven by an active scalar (e.g. temperature), these exact relations read (Shraiman & Siggia Reference Shraiman and Siggia1990)
 $$\begin{eqnarray}\displaystyle & \displaystyle \unicode[STIX]{x1D716}_{\unicode[STIX]{x1D703}}\equiv \left\langle \unicode[STIX]{x1D705}_{\unicode[STIX]{x1D703}}[\unicode[STIX]{x2202}_{i}\unicode[STIX]{x1D703}]^{2}\right\rangle =\unicode[STIX]{x1D705}_{\unicode[STIX]{x1D703}}\,\unicode[STIX]{x1D6E5}_{\unicode[STIX]{x1D703}}^{2}\,H^{-2}\,\mathit{Nu}_{\unicode[STIX]{x1D703}}, & \displaystyle\end{eqnarray}$$
 $$\begin{eqnarray}\displaystyle & \displaystyle \unicode[STIX]{x1D716}_{u}\equiv \left\langle \unicode[STIX]{x1D708}[\unicode[STIX]{x2202}_{i}u_{j}]^{2}\right\rangle =\unicode[STIX]{x1D708}^{3}H^{-4}\,\mathit{Ra}_{\unicode[STIX]{x1D703}}\,\mathit{Pr}_{\unicode[STIX]{x1D703}}^{-2}(\mathit{Nu}_{\unicode[STIX]{x1D703}}-1). & \displaystyle\end{eqnarray}$$
 $\langle \cdot \rangle$
represents the average over time and the entire domain. The key idea of the theory is to split the flow domain into boundary-layer and bulk regions and thus
 $$\begin{eqnarray}\unicode[STIX]{x1D716}_{\unicode[STIX]{x1D703}}=\unicode[STIX]{x1D716}_{\unicode[STIX]{x1D703},bl}+\unicode[STIX]{x1D716}_{\unicode[STIX]{x1D703},bulk},\quad \unicode[STIX]{x1D716}_{u}=\unicode[STIX]{x1D716}_{u,bl}+\unicode[STIX]{x1D716}_{u,bulk}.\end{eqnarray}$$
The individual contributions
 $\unicode[STIX]{x1D716}_{bl}$
and
 $\unicode[STIX]{x1D716}_{bulk}$
can be modelled for both momentum and thermal fields. For the bulk region, by using the Kolmogorov’s energy-cascade picture,
 $\unicode[STIX]{x1D716}_{bulk}$
can be estimated as the scaling laws of
 $Re$
defined by a characteristic velocity of the bulk flow. For the boundary-layer region,
 $\unicode[STIX]{x1D716}_{bl}$
can be estimated by assuming the Prandtl–Blasius–Pohlhausen profiles in the boundary layers and by using the scaling laws for the boundary-layer thicknesses. Then a cross-over function
 $f$
is introduced to model the transition from the regime where the kinetic boundary layer is nested in the thermal one to the regime where the thermal boundary layer is thinner than the kinetic one. Another cross-over function
 $g$
is employed to account for the saturation limit at small
 $Re$
when the kinetic boundary-layer thickness is of the order of the domain height. By combining all the modelling, one obtains the original GL theory
 $$\begin{eqnarray}\displaystyle (\mathit{Nu}_{\unicode[STIX]{x1D703}}-1)\mathit{Ra}_{\unicode[STIX]{x1D703}}\mathit{Pr}_{\unicode[STIX]{x1D703}}^{-2} & = & \displaystyle c_{1}\frac{\mathit{Re}^{2}}{g\left(\sqrt{\mathit{Re }_{c}/\mathit{Re}}\right)}+c_{2}\mathit{Re}^{3},\end{eqnarray}$$
 $$\begin{eqnarray}\displaystyle \mathit{Nu}_{\unicode[STIX]{x1D703}}-1 & = & \displaystyle c_{3}\mathit{Re}^{1/2}\,\mathit{Pr}_{\unicode[STIX]{x1D703}}^{1/2}\left\{f\left[\frac{2a\mathit{Nu}_{\unicode[STIX]{x1D703}}}{\sqrt{\mathit{Re }_{c}}}g\left(\sqrt{\frac{\mathit{Re }_{c}}{\mathit{Re}}}\right)\right]\right\}^{1/2}\nonumber\\ \displaystyle & & \displaystyle +\,c_{4}\mathit{Re}\,\mathit{Pr}_{\unicode[STIX]{x1D703}}\,f\left[\frac{2a\mathit{Nu}_{\unicode[STIX]{x1D703}}}{\sqrt{\mathit{Re }_{c}}}g\left(\sqrt{\frac{\mathit{Re }_{c}}{\mathit{Re}}}\right)\right].\end{eqnarray}$$
 $a$
and
 $c_{i}$
with
 $i=1,2,3,4$
.
 $Re_{c}$
can be calculated as
 $4a^{2}$
. Stevens et al. (Reference Stevens, van der Poel, Grossmann and Lohse2013) explained in detail how these coefficients were fitted based on only four (experimental or numerical) data points
 $\mathit{Nu}(\mathit{Ra}_{\unicode[STIX]{x1D703},j},\mathit{Pr}_{\unicode[STIX]{x1D703},j})$
,
 $j=1,2,3,4$
and one measure of Reynolds number, giving
 $$\begin{eqnarray}c_{1}=8.05,\quad c_{2}=1.38,\quad c_{3}=0.487,\quad c_{4}=0.0252,\quad a=0.922.\end{eqnarray}$$
Stevens et al. (Reference Stevens, van der Poel, Grossmann and Lohse2013) also showed that the theory successfully accounts for most of the existing RB results. Since for different flow configurations the Reynolds number can be defined by different characteristic velocities, to correctly predict the Reynolds number a transformation coefficient
 $\unicode[STIX]{x1D6FC}$
needs to be determined and the procedure is described in Grossmann & Lohse (Reference Grossmann and Lohse2002) and in Stevens et al. (Reference Stevens, van der Poel, Grossmann and Lohse2013). Such transformation does not change the theoretical prediction of the Nusselt number and merely accommodates the specific definition of Reynolds number in the flow investigated.
3.2 Extension to two-scalar convection and rational of the coefficients
Extend the GL theory to the current two-scalar RB flow is straightforward. First of all, exact relations similar to (3.1) still exist and read
 $$\begin{eqnarray}\displaystyle & \displaystyle \unicode[STIX]{x1D716}_{\unicode[STIX]{x1D703}}\equiv \left\langle \unicode[STIX]{x1D705}_{\unicode[STIX]{x1D703}}[\unicode[STIX]{x2202}_{i}\unicode[STIX]{x1D703}]^{2}\right\rangle =\unicode[STIX]{x1D705}_{\unicode[STIX]{x1D703}}\,\unicode[STIX]{x1D6E5}_{\unicode[STIX]{x1D703}}^{2}\,H^{-2}\,\mathit{Nu}_{\unicode[STIX]{x1D703}}, & \displaystyle\end{eqnarray}$$
 $$\begin{eqnarray}\displaystyle & \displaystyle \unicode[STIX]{x1D716}_{s}\equiv \left\langle \unicode[STIX]{x1D705}_{s}[\unicode[STIX]{x2202}_{i}s]^{2}\right\rangle =\unicode[STIX]{x1D705}_{s}\,\unicode[STIX]{x1D6E5}_{s}^{2}\,H^{-2}\,\mathit{Nu}_{s}, & \displaystyle\end{eqnarray}$$
 $$\begin{eqnarray}\displaystyle & \displaystyle \unicode[STIX]{x1D716}_{u}\equiv \left\langle \unicode[STIX]{x1D708}[\unicode[STIX]{x2202}_{i}u_{j}]^{2}\right\rangle =\unicode[STIX]{x1D708}^{3}H^{-4}\,\left[\mathit{Ra}_{\unicode[STIX]{x1D703}}\,\mathit{Pr}_{\unicode[STIX]{x1D703}}^{-2}(\mathit{Nu}_{\unicode[STIX]{x1D703}}-1)+\mathit{Ra}_{s}\,\mathit{Pr}_{s}^{-2}(\mathit{Nu}_{s}-1)\right]. & \displaystyle\end{eqnarray}$$
 $s^{2}$
,
 $\unicode[STIX]{x1D703}^{2}$
and
 $u^{2}/2-g\unicode[STIX]{x1D6FD}_{\unicode[STIX]{x1D703}}z\unicode[STIX]{x1D703}+g\unicode[STIX]{x1D6FD}_{s}zs$
by the procedure given in Shraiman & Siggia (Reference Shraiman and Siggia1990). We then notice that for the current flow the momentum and both scalar fields can still be divided into boundary-layer and bulk regions, as supported by figures 1 and 2. Thus for each field the dissipation rate can be modelled separated for the boundary-layer and bulk regions as in the original theory. Intuitively we assume that in the current flow the same scaling relations still hold for the dissipation rates in each region. By following the same arguments as in the original theory, one readily obtains the GL theory for the turbulent two-scalar convective flow, namely
 $$\begin{eqnarray}\displaystyle & & \displaystyle (\mathit{Nu}_{s}-1)\mathit{Ra}_{s}\mathit{Pr}_{s}^{-2}+(\mathit{Nu}_{\unicode[STIX]{x1D703}}-1)\mathit{Ra}_{\unicode[STIX]{x1D703}}\mathit{Pr}_{\unicode[STIX]{x1D703}}^{-2}=c_{1}\frac{\mathit{Re}^{2}}{g\left(\sqrt{\mathit{Re }_{c}/\mathit{Re}}\right)}+c_{2}\mathit{Re}^{3},\end{eqnarray}$$
 $$\begin{eqnarray}\displaystyle & & \displaystyle \mathit{Nu}_{\unicode[STIX]{x1D703}}-1=c_{3}\mathit{Re}^{1/2}\,\mathit{Pr}_{\unicode[STIX]{x1D703}}^{1/2}\left\{f\left[\frac{2a\mathit{Nu}_{\unicode[STIX]{x1D703}}}{\sqrt{\mathit{Re }_{c}}}g\left(\sqrt{\frac{\mathit{Re }_{c}}{\mathit{Re}}}\right)\right]\right\}^{1/2}\nonumber\\ \displaystyle & & \displaystyle \phantom{\mathit{Nu}_{\unicode[STIX]{x1D703}}-1=}+\,c_{4}\mathit{Re}\,\mathit{Pr}_{\unicode[STIX]{x1D703}}\,f\left[\frac{2a\mathit{Nu}_{\unicode[STIX]{x1D703}}}{\sqrt{\mathit{Re }_{c}}}g\left(\sqrt{\frac{\mathit{Re }_{c}}{\mathit{Re}}}\right)\right],\end{eqnarray}$$
 $$\begin{eqnarray}\displaystyle & & \displaystyle \mathit{Nu}_{s}-1=c_{3}\mathit{Re}^{1/2}\,\mathit{Pr}_{s}^{1/2}\left\{f\left[\frac{2a\mathit{Nu}_{s}}{\sqrt{\mathit{Re }_{c}}}g\left(\sqrt{\frac{\mathit{Re }_{c}}{\mathit{Re}}}\right)\right]\right\}^{1/2}\nonumber\\ \displaystyle & & \displaystyle \phantom{\mathit{Nu}_{s}-1=}+\,c_{4}\mathit{Re}\,\mathit{Pr}_{s}\,f\left[\frac{2a\mathit{Nu}_{s}}{\sqrt{\mathit{Re }_{c}}}g\left(\sqrt{\frac{\mathit{Re }_{c}}{\mathit{Re}}}\right)\right].\end{eqnarray}$$
Note that (3.6b
) and (3.6c
) have the same coefficients. The physical reason for this necessity is that, as explained in Yang et al. (Reference Yang, van der Poel, Ostilla-Mónico, Sun, Verzicco, Grossmann and Lohse2015), when either of the two scalar differences decreases to zero, the flow must still reduce to the traditional RB flow with one scalar and the theory must degenerate to the original form. Thus the generalized theory still has the very same five coefficients
 $c_{i}$
with
 $i=1,2,3,4$
and
 $a$
, and not two extra ones for the second scalar field, as one may naively (but erroneously) expect. Furthermore, the values of these coefficients can directly be taken from Stevens et al. (Reference Stevens, van der Poel, Grossmann and Lohse2013), i.e. those given in (3.4).
3.3 Application to the current numerical results
We now apply the theory to the current numerical results. As we explained before, a transformation coefficient
 $\unicode[STIX]{x1D6FC}$
needs to be determined to correctly predict the Reynolds number for the current flow. Here we fix
 $\unicode[STIX]{x1D6FC}=1.453$
by using the Reynolds number of the case with
 $\mathit{Pr}_{s}=10$
,
 $\mathit{Ra}_{\unicode[STIX]{x1D703}}=\mathit{Ra}_{s}=10^{7}$
. Figure 3 shows both the theoretical predictions and the numerical measurements for the five groups of the cases listed in table 1. The overall trends of all three global responses, namely
 $\mathit{Nu}_{\unicode[STIX]{x1D703}}$
,
 $\mathit{Nu}_{s}$
and
 $\mathit{Re}$
, are very well captured by the theory. Moreover, the theory can even predict the absolute values for most of the cases with good accuracy. Specifically, the relative error of
 $\mathit{Nu}_{\unicode[STIX]{x1D703}}$
prediction is always smaller than
 $20\,\%$
. For the
 $\mathit{Re}$
prediction over
 $90\,\%$
of all cases have a relative error smaller than
 $20\,\%$
. The theory has the least accuracy for the
 $\mathit{Nu}_{s}$
prediction, but still the relative error for over
 $50\,\%$
of all cases are smaller than
 $20\,\%$
. The largest error is always smaller than
 $50\,\%$
for both
 $\mathit{Nu}_{s}$
and
 $\mathit{Re}$
.
Comparison of the GL theory (lines) to the numerical results (symbols). Each plot shows a group of cases listed in table 1. The error bars are comparable or smaller than the size of symbols. The vertical grey line indicates the location
 $\unicode[STIX]{x1D6EC}=1$
, which separates the CD and TD regimes.

Among the three global responses, the theoretical prediction for the concentration flux
 $\mathit{Nu}_{s}$
exhibits the biggest deviation from the numerical results, especially in the deep TD regime (with large
 $\unicode[STIX]{x1D6EC}$
) for
 $\mathit{Pr}_{s}>1$
(see the left panel of figure 3
a–c,e). In this regime the flow is mainly driven by the temperature difference, such as the case shown in figure 1(c,d). All the concentration plumes are very thin and stay in the core regions of the temperature plumes, therefore the buoyancy anomaly associated with concentration and its effects on the momentum field are confined inside the temperature plumes due to the slow sideward diffusion. The morphology and dynamics of such thin concentration plumes are very different from the traditional RB plumes, thus the original scaling arguments of the GL theory become less accurate.
For the opposite reason in the deep CD regime (with small
 $\unicode[STIX]{x1D6EC}$
), although the buoyancy force is mainly generated by the concentration component, the temperature anomaly diffuses faster in the lateral direction and is not confined inside the concentration plumes. The temperature anomaly can directly interact with the momentum field and thus more similar to the situation in the RB flows. Therefore the GL theory performs better in the CD regime than in the TD regime, as shown in figure 3(a–c).
4 Conclusions and discussion
In summary, we conducted direct numerical simulations of the RB convection driven by two scalar components. The flow morphology changes for different ratios of the buoyancy forces associated with the two scalar differences. We have generalized the GL theory for the single-scalar RB convection to the current problem. The results show that the theory captures the overall trends of the dependences of scalar fluxes and flow velocity on the control parameters. For most of the cases the theory predicts the absolute values with good accuracy. This comparison demonstrates the applicability of the GL theory to multiple-component convection flows. The accuracy of the theory decreases when temperature difference dominates the buoyancy force, i.e. in the TD regime, and when the concentration has large Prandtl number. We argue that in this regime, the structures of the concentration plumes are different from those in the traditional RB flows, and the argument in the original GL theory becomes less accurate. A more refined generalization of the GL theory should assume that the coefficients are not constant but some functions of the density ratio
 $\unicode[STIX]{x1D6EC}$
, and they recover the original GL values when the system degenerates to a single-scalar RB flows.
Acknowledgements
This study is supported by the Dutch Foundation for Fundamental Research on Matter (FOM), and by the Netherlands Centre for Multiscale Catalytic Energy Conversion (MCEC), an NWO Gravitation programme funded by the Ministry of Education, Culture and Science of the government of the Netherlands. The simulations were conducted on the Cartesius supercomputer at the Dutch national e-infrastructure of SURFsara, and the Marconi supercomputer based in CINECA, Italy through the PRACE project no. 2016143351. Y.Y. also acknowledges the partial support from the ‘Young Professionals of the Thousand Talent Plan’ of China.


 Open access

