

Introduction
Expired-air CO measurement is an objective, non-invasive method to biochemically assess recent smoking exposure. With an average half-life of 4 hours, expired-air CO has been shown to be sensitive to recent smoking exposure (i.e., < 24 hours; Benowitz et al., Reference Benowitz, Jacob, Hall, Tsoh, Ahijevych and Jarvis2002). Clinical research uses CO values as a method to confirm abstinence in treatment studies (typically for >24 hours) or brief deprivation (e.g., overnight) prior to laboratory testing of symptoms such as craving or withdrawal (Addicott et al., Reference Addicott, Baranger, Kozink, Smoski, Dichter and McClernon2012; Perkins, Jao, & Karelitz, Reference Perkins, Jao and Karelitz2013a; Perkins, Karelitz, Conklin, Sayette, & Giedgowd, Reference Perkins, Karelitz, Conklin, Sayette and Giedgowd2010). Still others have used CO level as an inclusion criterion to ensure current status as a smoker (Froeliger, Modlin, Wang, Kozink, & McClernon, Reference Froeliger, Modlin, Wang, Kozink and McClernon2012; VanderVeen, Cohen, Cukrowica, & Trotter, Reference VanderVeen, Cohen, Cukrowicz and Trotter2008) or to assess current amount of smoke exposure (Perkins, Karelitz, & Jao, Reference Perkins, Karelitz and Jao2013b). Unlike the primary biochemical method to assess exposure to nicotine per se, salivary or urinary cotinine, CO measurement has the benefit of not being affected by nicotine replacement therapies used in some cessation interventions (Benowitz et al., Reference Benowitz, Jacob, Hall, Tsoh, Ahijevych and Jarvis2002).
Although a variety of CO monitors are available (European Respiratory Society, n.d.), the most widely used monitors in smoking research are from Bedfont Scientific (Kent, United Kingdom) and Vitalograph (Lenexa, KS). A Google Scholar (www.scholar.google.com) search over a ten year period (2004–2014; performed August, 2015) using the keywords ‘CO monitor’ and ‘smoking’ returned 745 publications. Surprisingly, 434 (58%) of the articles did not disclose the monitor type. Of the 311 that did, the vast majority used Bedfont (189, or 61%) or Vitalograph (109, 35%) monitors, while just 11 used Micro Medical (Kent, United Kingdom) and 2 used CO Sleuth (Breathe E-Z Systems, Leawood, KS).
Possible variation in measurement between monitors may have implications for the results reported in studies using CO values to confirm current smoking or recent duration of abstinence. Using Bedfont monitors, Erb, Raiff, Meredith, and Dallery (Reference Erb, Raiff, Meredith and Dallery2015) identified CO values < 8 ppm as maximizing both sensitivity and specificity for classifying smokers from non-smokers. By contrast, Perkins et al. (Reference Perkins, Karelitz and Jao2013b) found < 5 ppm to be the optimal cutoff for 24-hour abstinence when using the Vitalograph BreathCO monitor, similar to < 4 ppm found by Javors, Hatch, and Lamb (Reference Javors, Hatch and Lamb2005), Cropsey et al. (Reference Cropsey, Trent, Clark, Stevens, Lahti and Hendricks2014) and Emery and Levine (Reference Emery and Levine2015) when also using the Vitalograph monitor. This discrepancy suggests there may be variation between these brands of CO monitors in validating abstinence and raises concern over whether they can be used interchangeably.
The aim of this study was to examine the level of agreement in measurement between two very commonly used CO monitors, the Vitalograph BreathCO and the Bedfont piCO+ Smokerlyzer, through Bland–Altman analysis of agreement (Bland & Altman, Reference Bland and Altman1986) of continuous values and comparison of dichotomous smoking abstinence classifications. Bland–Altman analysis determines the level of agreement in measurement between monitors rather than their accuracy (i.e., closeness to true value) or precision (i.e., closeness between repeated measures) (Mantha, Roizen, Fleisher, Thisted, & Foss, Reference Mantha, Roizen, Fleisher, Thisted and Foss2000), both of which have been reported elsewhere per each monitor (CoVita, 2010; Javors et al., Reference Javors, Hatch and Lamb2005; Moscato, Poscia, Gargaruti, Capelli, & Cavaliere, Reference Moscato, Poscia, Gargaruti, Capelli and Cavaliere2014; Vitalograph, n.d.). Knowing whether these monitors agree (e.g., 4 ppm for one is 4 ppm for the other) will allow for the monitors and diagnostic criteria to be used interchangeably. If the monitors do not agree in measurement, monitor-specific abstinence criteria may be necessary. Additionally, there are implications for replication of studies between researchers using different monitors.
Methods
Participants
To provide a range of recent smoking exposure, participants (n = 78) were those from studies using CO values to confirm 24-hour abstinence (verified by < 5 ppm; Perkins et al., Reference Perkins, Karelitz and Jao2013b), 12-hour (overnight) abstinence (verified by ≤ 10 ppm, Javors et al., Reference Javors, Hatch and Lamb2005), or no abstinence (i.e., current ad lib smoking, verified by > 10 ppm). Participants agreed to provide additional expired-air samples for this comparison between monitors, secondary to the main study in which they were enrolled. Those studies included an initial evaluation of a novel smoking cessation medication in those wanting help to quit (Perkins et al., Reference Perkins, Karelitz and Michael2016), and laboratory studies in those not wanting to quit that examined responses during non-abstinence and overnight abstinence conditions (Perkins, Karelitz, & Michael, Reference Perkins, Karelitz and Michael2015), including one that is ongoing. Values were assessed between April 2014 and January 2015. Participants were recruited through print and online notices for the respective studies, placed in the surrounding University of Pittsburgh community. All were healthy adults (44 M, 34 F) who met inclusion criteria for each study, both involving smoking ≥ 10 cigarettes per day for ≥ 1 year and meeting DSM-IV nicotine dependence criteria (American Psychiatric Association, 1994), those very typically recruited for studies of smoking behavior and abstinence (e.g., Addicott et al., Reference Addicott, Baranger, Kozink, Smoski, Dichter and McClernon2012; Benowitz et al., Reference Benowitz, Jacob, Hall, Tsoh, Ahijevych and Jarvis2002, Perkins et al., Reference Perkins, Karelitz, Conklin, Sayette and Giedgowd2010; Reference Perkins, Jao and Karelitz2013a). Mean (SD) sample characteristics were 16.2 (5.3) cigarettes per day, 28.8 (8.9) years old, and 5.1 (1.8) Fagerström Test of Cigarette Dependence score (previously known as Fagerström Test of Nicotine Dependence, Fagerström, Reference Fagerström2012; Heatherton, Kozlowski, Frecker, & Fagerström, Reference Heatherton, Kozlowski, Frecker and Fagerström1991).
CO Monitors
Expired-air samples were obtained using Vitalograph BreathCO monitors and Bedfont piCO+ Smokerlyzer monitors. The Bedfont piCO+ Smokerlyzer has an LCD screen to guide the participant through the expired-air CO process. The Vitalograph BreathCO monitor requires an administrator to guide the participant through the entire process (described in detail below). Both monitors have a range of measurement of 0–100 ppm and display CO values in 1 ppm increments. The monitors were calibrated to brand specific standards (Vitalograph 50 ppm, Bedfont 20 ppm) prior to testing and then as recommended by each respective manufacturer (Vitalograph every 12 months, Bedfont every 6 months). Three Vitalograph BreathCO monitors and three Bedfont piCO+ Smokerlyzer monitors were used for this study. In 2014, before the study began, the Vitalograph monitors had new sensors installed by the manufacturer and all three Bedfont monitors were purchased new. According to each respective CO monitor's manual, the BreathCO monitor is accurate ±3 ppm (Vitalograph, n.d.) and the pico+ Smokerlyzer is accurate ±2% (CoVita, 2010). Previous studies have found both monitors to have high internal consistency, with intraclass correlation coefficients for the Vitalograph ranging from 0.935 to 0.994 (Javors et al., Reference Javors, Hatch and Lamb2005) and 0.985 for the Bedfont monitor (Moscato et al., Reference Moscato, Poscia, Gargaruti, Capelli and Cavaliere2014).
Procedure
Participants were observed as they provided air samples following the instructions specific to each brand. Because observed CO values can be affected by speed of exhalation (Raiff, Faix, Turturici, & Dallery, Reference Raiff, Faix, Turturici and Dallery2010), participants were instructed to exhale slowly when providing all samples across CO monitors. For the Vitalograph monitor, participants were told to take a deep breath and hold for 20 sec (measured by experimenter via digital timer) then exhale fully into the mouthpiece attached the monitor. For the Bedfont monitor, the participant double-clicked a button on the monitor, initiating the breath sample collection. The Bedfont monitor then guided the participant through the entire procedure using pictures on an LED screen. Participants were instructed to hold their breath for 15 sec (measured by the Bedfont monitor) and then exhale fully through the mouthpiece attached to the monitor. All pairs of air samples were collected with at least 5 min, but no more than 10 min, between samples, with the Vitalograph monitor administered before the Bedfont monitor in all cases. The number of visits varied between studies, resulting in a varying number of paired observations from each participant.
Statistical Analysis
As noted, the outcome results for expired-air CO values were compared at clinical criteria for 24-hour abstinence (< 5 ppm), overnight abstinence (12 hours, ≤ 10 ppm), and ad lib smoking (> 10 ppm). Of primary interest was the agreement in classification between monitors, particularly determining how many participants would meet abstinent or ad lib criteria for one monitor when the criterion is met under the other monitor.
A Bland–Altman analysis of agreement (Bland & Altman, Reference Bland and Altman1986) was performed to measure the level of agreement between CO monitors. This analysis relies on a plot of the difference between monitors (Bedfont–Vitalograph) against the mean reading for both combined ((Bedfont + Vitalograph)/2), determined for each pair of observations. Typically, a new scale or measurement type is compared against an existing or ‘gold standard’ method. Bland and Altman (Reference Bland and Altman1995) explicitly stated that comparing the difference between measurements to a standard method would inflate the risk for Type I error. Following their suggestion, and not having an established standard to compare against, the mean reading between monitors was used as a proxy for the ‘true’ CO value. The Bland–Altman plot shows how the agreement in measurement between monitors varies as a function of an increase in CO level due to recent smoking exposure. The mean difference between monitors (bias) is computed, along with the 95% LoA. The 95% LoA form a band around the mean bias and act as 95% confidence intervals. A narrow LoA band width indicates good agreement between methods and a wide LoA band width indicates poor agreement. A two-step regression-based analysis was used to calculate the 95% LoA, due to data with non-constant variance in the differences, repeated measures, and varying number of observations from each participant. Details of this method have been described in previous articles (Altman, Reference Altman1993; Bland & Altman, Reference Bland and Altman1999; Brown & Richmond, Reference Brown and Richmond2005). All analyses were performed using SPSS version 22.0.
The Bland–Altman analysis does not provide a level of statistical significance; however, observed differences are compared against an a priori threshold of clinical significance. If the observed differences fall within the threshold of clinical significance, it is presumed that the methods can be used interchangeably. This analysis is preferred over more familiar statistics (i.e., correlation), due to its ability to evaluate the difference in measurement rather than assess the degree of association between methods of measurement. The threshold of clinical significance for this study was defined as ±20% of the average reading between monitors. This value was chosen as it would allow for ±1 ppm variation at an average reading between monitors of 5 ppm, a 24-hour abstinence cutoff level shown to have high levels of sensitivity and specificity (Perkins et al., Reference Perkins, Karelitz and Jao2013b). It also would allow for ±2 ppm variation for confirming 12-hour abstinence (at CO < 10 ppm). For those ad lib smoking, ±20% of the average CO reading for those ad lib smoking allowed for an acceptable range of variation that was in proportion to the CO value obtained across all levels of measurement. At these higher levels of CO, a proportionally larger level of variation was considered acceptable as these specific values are typically not used to guide diagnostic or clinical decisions.
Results
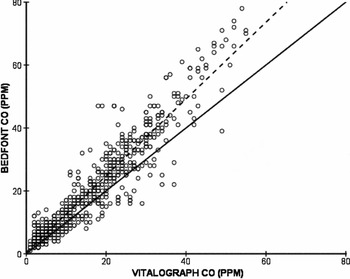
A scatterplot of paired CO values from each monitor is shown in (Figure 1), with a regression line (dashed) showing best fit and a diagonal line (solid) illustrating perfect agreement. Across the entire sample (654 pairs of observations), the Bedfont monitor gave a mean (±SEM) reading 3.83 (±0.23) ppm higher than the Vitalograph monitor.
Scatterplot of paired CO values from each monitor, with the solid line illustrating perfect agreement and dashed line showing regression line of best fit.

Comparisons of Dichotomous Abstinence Duration Criteria
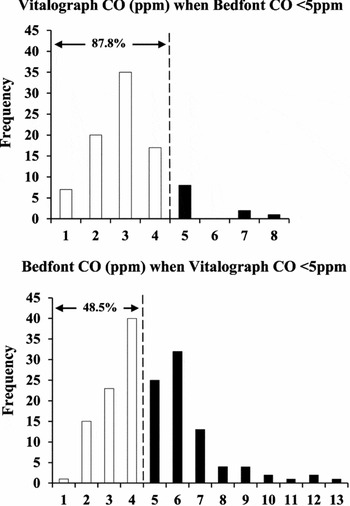
In comparisons of the monitors for verifying 24-hour abstinence, (Figure 2) contains a pair of bar graphs displaying frequencies of CO values from each monitor when the opposite monitor is < 5 ppm. For the set of breath measurements when CO was < 5 ppm using the Bedfont, 87.8% of the values obtained with the Vitalograph were also < 5 ppm (79 out of 90). Conversely, when Vitalograph values were < 5 ppm, the Bedfont values ranged from 1 ppm to 13 ppm, with only 48.5% of values also < 5 ppm (79 out of 163).
Frequencies of CO values from each monitor (Vitalograph top, Bedfont bottom) when 24-hour abstinence criterion (< 5 ppm) is met under the other monitor.

When looking at those meeting the 12 hour abstinence criterion (≤ 10 ppm) using the Bedfont monitor, Vitalograph CO values ranged from 1 ppm to 16 ppm, with 96.7% of values ≤ 10 ppm. When the same criterion was met using the Vitalograph monitor, Bedfont CO values ranged from 1 ppm to 17 ppm, with 88.4% ≤ 10 ppm.
For confirming no abstinence, those classified as ad lib smoking (CO >10 ppm) using the Bedfont monitor had Vitalograph values ranging from 2 ppm to 55 ppm, with 90.8% >10 ppm. When the ad lib smoking criterion was met using the Vitalograph monitor, Bedfont CO values ranged from 8 ppm to 78 ppm, with 97.5% >10 ppm.
Bland–Altman Comparison of Continuous Values
Combining all CO values and regressing the differences between monitors (Bedfont–Vitalograph) on the average reading ((Bedfont + Vitalograph)/2) provided the mean bias across the range of samples, β = 0.26, t(653) = 20.21, p < 0.00001, with an intercept of −0.65. Such bias suggests for each ten-unit increase in CO, the Bedfont monitor will provide CO readings about 3 ppm higher than the average between the two monitors. To calculate the 95% LoA, the absolute values of the residuals from the first regression were regressed on the average CO readings between monitors, resulting in a significant linear relationship, β = 0.09, t(653) = 9.58, p < 0.00001, with an intercept of 1.57. This equation was combined with the earlier equation to form the 95% LoA bands.
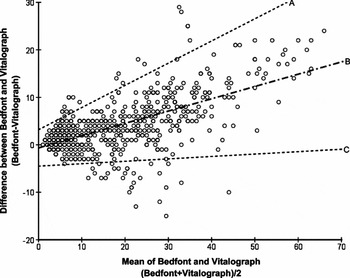
The Bland–Altman graph is displayed in (Figure 3), plotting the difference between monitors (Bedfont–Vitalograph) against their mean reading. The regression-obtained mean bias is shown (line ‘B’), along with the 95% LoA (lines ‘A’ and ‘C’). If the monitors were in complete agreement across the range of measurement, the mean bias would be a flat (statistically non-significant) line with an intercept close to zero. Inspection of (Figure 3) shows widening LoA bands as the average CO values increase with a similarly increasing mean bias showing that agreement between monitors decreases as CO values increase.
Bland–Altman plot. Line ‘B’ is the regression-obtained mean difference between monitors with lines ‘A’ and ‘C’ forming the 95% limits of agreement.

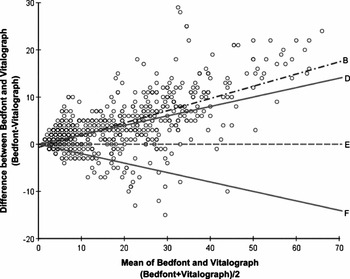
Figure 4 is a Bland–Altman plot with a horizontal line at zero (line ‘E’) illustrating complete agreement (e.g., no difference) between monitors, with bands forming the upper and lower limits of clinical significance (±20% of the average CO value; lines ‘D’ and ‘F’). These limits of clinical significance show the acceptable amount of variation in measurement of CO between monitors. Also shown in (Figure 4) is the regression-obtained mean bias for comparison to the limits of clinical significance. The regression-obtained mean bias falls outside of the a priori limits of clinical significance, indicating a lack of agreement in measurement of CO between monitors.
Bland–Altman plot. Line ‘E’ illustrates no difference between monitors, with bands forming the upper (line ‘D’) and lower limits (line ‘F’) of clinical significance, ±20% of the mean CO value. Line ‘B’ is the regression-obtained mean difference between monitors.

Discussion
We compared agreement in abstinence duration classification (24 hour, 12 hour, none–ad lib smoking) and overall expired-air CO measurement between two commonly used CO monitors, the Vitalograph BreathCO and the Bedfont piCO+ Smokerlyzer. Values obtained from the Bedfont monitor were consistently higher than those from the Vitalograph monitor. The elevated CO values obtained from the Bedfont monitors are consistent with a previous study finding overestimation of CO by roughly 20% when measuring known concentrations of CO of 5 ppm and 9.9 ppm (Moscato et al., Reference Moscato, Poscia, Gargaruti, Capelli and Cavaliere2014).
When confirming 24-hour abstinence (< 5 ppm) in dichotomous fashion, as typically reported in smoking cessation research (e.g., Javors et al., Reference Javors, Hatch and Lamb2005; Perkins et al., Reference Perkins, Karelitz and Jao2013b), the Vitalograph monitors agreed with the Bedfont classifications 87.8% of the time. However, when the same criterion was met using the Vitalograph monitors, the Bedfont monitors agreed less than half of the time (48.5%), indicating reported results for abstinence rates in clinical trials could be influenced by the monitor used. Yet, there was greater agreement in determining 12-hour abstinence and ad lib smoking. The Bedfont monitors agreed with Vitalograph readings of ≤ 10 ppm 88.4% of the time and 97.5% of the time when Vitalograph values >10 ppm, while the Vitalograph values agreed with 96.7% of the Bedfont values ≤ 10 ppm and with 90.8% of the Bedfont values >10 ppm.
In order to test whether the CO monitors could be used interchangeably in studies of recent smoking exposure, we performed a regression-based Bland–Altman analysis of agreement, which compares CO values in continuous fashion. Values obtained from the Bedfont monitors were consistently higher than those from the Vitalograph monitors, with larger absolute differences as the CO values increased. Thus, along with less agreement when confirming abstinence dichotomously, the monitors also show less agreement in comparisons of continuous CO values with greater or more recent smoking exposure. The Bland–Altman plot illustrated this variation of differences along the range of CO measurement. The LoA calculated using the Bland–Altman procedure provided upper and lower limits between which 95% of future measurements are estimated to fall, similar to confidence intervals. This band of limits was more narrow at the lower range of measurement (e.g., closer to CO cutoff values for abstinence) than at the higher range of measurement. Comparison of the regression-based mean bias to the a priori level clinical significance (±20% of the average CO reading) showed the mean difference in measurement between monitors was outside of the range of accepted difference, indicating a lack of agreement in CO measurement between monitors. In other words, these two CO monitors may not be appropriate to use interchangeably.
Our study had a few limitations. First, we did not counterbalance the order of monitors, always administering the Vitalograph monitors before the Bedfont monitors. The Vitalograph monitor was administered first to standardize the primary measure of CO in all studies, whereas the Bedfont monitors were administered solely for the comparisons described in this paper. However, any effect of this order is uncertain, as repeated testing of expired-air CO levels has been shown to yield both higher (Jarvis, Belcher, Vesey, & Hutchison, Reference Jarvis, Belcher, Vesey and Hutchison1986) and lower values (Middleton & Morice, Reference Middleton and Morice2000) between samples within the same monitor. A slight decline with the second testing might be expected, given that CO half-life is influenced by respiration (Benowitz et al., Reference Benowitz, Jacob, Hall, Tsoh, Ahijevych and Jarvis2002), but the second test was always done here with the Bedfont, which tended to read higher rather than lower. Second, the duration of breath holding prior to exhaling into each monitor was different between monitor types, as per each respective set of brand specific instructions. Previous research has found that shorter breath hold duration, as with the Bedfont instructions, was associated with lower levels of expired-air CO (West, Reference West1984), which again is the opposite of what was found in this study. Future replications of this study design should test the effect of breath holding duration to eliminate this as a possible source of difference between monitors.
There were multiple strengths in our study and its design. The within-subjects design allowed our data to withstand individual differences that have been shown to influence expired-air CO measurement, such as speed of exhalation (Raiff et al., Reference Raiff, Faix, Turturici and Dallery2010), time of last cigarette (Benowitz et al., Reference Benowitz, Jacob, Hall, Tsoh, Ahijevych and Jarvis2002), and other health issues (i.e., lactose intolerance, liver sepsis, etc.; McNeill, Owen, Belcher, Sutherland, & Fleming, Reference McNeill, Owen, Belcher, Sutherland and Fleming1990; Morimatsu et al., Reference Morimatsu, Takahashi, Matsusaki, Hayashi, Matsumi and Shimizu2010). Additionally, we collected air samples from smokers across a spectrum of smoking abstinence duration levels to determine if the agreement between monitors might be relevant only for studies of acute smoking behavior or of cessation. Further, the regression-based Bland–Altman statistic was robust enough to handle repeated measurements with varying numbers of observations per subject (Bland & Altman, Reference Bland and Altman1999). This statistic is widely regarded as the ideal way to compare methods of measurement, employing a practical and clinically relevant way to determine whether methods are able to be used interchangeably (Bland & Altman, Reference Bland and Altman2003; Hanneman, Reference Hanneman2008; Ludbrook, Reference Ludbrook2002).
The lack of agreement in classification of abstinence status and measurement of CO between these monitors has several implications. First, it is important to report the specific brand and model of CO monitor used in any smoking study, especially when comparing results across different studies. As the current work demonstrated, these monitors can differ significantly, making interpretation of clinical results and future replication difficult without knowing how the data were collected. Second, the brand of CO monitor used to verify recent abstinence may need to be considered when evaluating the numbers of participants above versus below a study's dichotomous cutoff criterion for 24-hour abstinence (i.e., quit rate) as a result of different treatment conditions, as the observed CO values may depend on the monitor. These monitor specific values should be taken into consideration when determining abstinence standards for future studies. Similarly, studies of acute smoking exposure that rely on absolute CO values in continuous fashion may also need to report the monitor used, as the difference in CO values between these monitors increased with greater recent smoking. Third, reasons for why these monitors systematically vary in CO readings may warrant research attention, such as the instructions to participants or the actual components in the monitors.
Additional research is suggested by the findings of the current study. First, replication of these results in studies counter-balancing the order of the monitors being compared would be important to fully document variation in measurement between CO monitors. Second, it may be useful to identify monitor-specific cutoffs to determine smoking abstinence. The optimal CO value that maximizes sensitivity and specificity for identifying those quit versus not quit should be determined for each monitor type and compared between types, especially within the same participants. Such research may benefit by using other biomarkers of recent nicotine exposure (e.g., cotinine) as a reference point, similar to methods used by Cropsey et al. (Reference Cropsey, Trent, Clark, Stevens, Lahti and Hendricks2014). The use of additional biomarkers as reference would strengthen future studies as these measures would not be affected by other combustibles (e.g., marijuana) and would be sensitive to non-combustible sources of nicotine (e.g., electronic cigarettes, NRT, etc.).
Aside from absolute CO values to confirm abstinence durations, as in this study, percent reduction in CO values has also been used to verify minimum durations of cigarette smoking abstinence (Dallery & Raiff, Reference Dallery and Raiff2007; Lamb, Morral, Galbicka, Kirby, & Iguchi, Reference Lamb, Morral, Galbicka, Kirby and Iguchi2005). This method requires participants to demonstrate some duration of abstinence (usually < 24 hour) through a reduction in CO relative to a previously obtained baseline value. Because the current study examined differences in absolute CO values between monitors, we cannot directly determine if magnitude of CO decline from baseline may vary as a function of monitor brand.
Finally, CO values from new CO monitors should be compared with existing monitors using the Bland and Altman procedure to ensure the values obtained between monitors varying in make and/or age are similar and the monitors can be used interchangeably. For example, as Bland and Altman (Reference Bland and Altman1986) have pointed out, significant correlations between monitors only indicate the strength of the linear relationship, not the agreement or difference between them. Additional research is needed to further elucidate the differences in CO measurement between monitors. Comparing agreements in measurement of known CO values across a range of concentrations would be the most direct way to assess this and could be another step in this line of research.
Financial Support
This work was supported by National Institutes of Health (K.A.P., UH3 TR00958 from NCATS; DA35774 from NIDA; and DA35968 from NIDA). This research was also supported in part by an NIH training grant to the Cardiovascular Behavioral Medicine Research Training Program at the University of Pittsburgh (J.L.K., T32 HL756033).
Conflict of Interests
The authors do not have any financial interests in either of the CO monitor companies discussed in this paper. None of the authors have any other potential conflicts of interest to report.
Ethical Standards
The authors assert that all procedures contributing to this work comply with the ethical standards of the relevant national and institutional committees on human experimentation and with the Helinski Declaration of 1975, as revised in 2008.