Introduction
In nature, predators and parasitoids move over a broad range of spatial scales, and it is of vital importance to understand the dispersal characteristics of these beneficial insects for biological control of agricultural pests. Different marking and tracking techniques have been developed in order to evaluate the movement or identify the sources of several species of arthropods (Lavandero et al., Reference Lavandero, Wratten, Hagler, Tylianakis, Gurr, Wratten and Altieri2004; Jones et al., Reference Jones, Hagler, Brunner, Baker and Wilburn2006; Wanner et al., Reference Wanner, Gu, Günther, Hein and Dorn2006; Goubault & Hardy, Reference Goubault and Hardy2007; Scarratt et al., Reference Scarratt, Wratten and Shishehbor2008; Stephens et al., Reference Stephens, Barrington, Bush, Fletcher, Mitchell and Suckling2008). However, those useful methods have a major inconvenience for field studies; either the insects or the plants need to be marked beforehand.
Many predators are omnivores, consuming plant provided foods at least during part of their life cycles (Albajes & Alomar, Reference Albajes, Alomar and Capinera2004; Wäckers et al., Reference Wäckers, van Rijn and Bruin2005). Enhancing the availability of such food sources within or close to crops provides resources, which enhance populations of natural enemies, and adds to their colonization of the target crop, increasing the effectiveness of biological control (Landis et al., Reference Landis, Wratten and Gurr2000; Gurr et al., Reference Gurr, Wratten and Altieri2004). Pollen grains, present either on the exoskeleton or within the gut, have been used to confirm feeding on certain plant species (Silberbauer et al., Reference Silberbauer, Yee, Del Socorro, Wratten, Gregg and Bowie2004). However, procedures for morphological pollen identification are too time consuming, and not all predators feed on pollen.
In recent years, several studies have developed DNA-based techniques to analyse predator gut contents in arthropods, mainly in those where the feeding does not leave remains that can be morphologically identified. The first attempts developed specific SCAR (sequence characterized amplified region) markers (Agustí et al., Reference Agustí, De Vicente and Gabarra1999, Reference Agustí, de Vicente and Gabarra2000); but, more recently, other regions like the internal transcribed spacer region 1 (ITS-1) (Hoogendoorn & Heimpel, Reference Hoogendoorn and Heimpel2001) or the cytochrome c oxidase subunits I and II (COI and COII) mitochondrial genes have been used to develop prey-specific primers (Agustí et al., Reference Agustí, Shayler, Harwood, Vaughan, Sunderland and Symondson2003a,b; Greenstone et al., Reference Greenstone, Rowley, Weber and Hawthorne2007; Weber & Lundgren, Reference Weber and Lundgren2009). Based on this, an alternative way to track movement of omnivorous predators from their refuges would be the identification of ingested plant DNA within whole insects, as similarly done in predation gut contents analysis studies. Even if the COI region has been mainly used for primer design in gut analysis of predation, it is not clear which region would be most appropriate for the detection of ingested plant DNA. ITS 1–2 together with trnH-psbA region have been proposed to have a faster gene evolution rate than COI in plants (Chase et al., Reference Chase, Salamin, Wilkinson, Dunwell, Kesanakurth, Haidar and Savolainen2005).
Macrolophus pygmaeus (Rambur) (Heteroptera: Miridae) is a polyphagous predator that feeds on several arthropod species. Until recently, M. pygmaeus on tomato has been misidentified as M. melanotoma (Costa) (=M. caliginosus Wagner) and is still named as M. caliginosus by commercial beneficial producers (Martinez-Cascales et al., Reference Martinez-Cascales, Cenis, Cassis and Sanchez2006; Gemeno et al., personal communication). This species spontaneously colonizes field and greenhouse crops from refuges present in the agricultural landscape of the Mediterranean basin (Alomar et al., Reference Alomar, Goula and Albajes2002; Castañé et al., Reference Castañé, Alomar, Goula and Gabarra2004; Gabarra et al., Reference Gabarra, Alomar, Castañé, Goula and Albajes2004). Like most mirids, it is an omnivore that also feeds on plant tissues; therefore, it was selected as a candidate for our study. Because M. pygmaeus is a small sucking insect and it is not known whether it feeds either on phloem or on leaf cells, we suspected that prohibitively small quantities of plant DNA would be present in its gut leading on a low detection of plant DNA. For this reason, we also tested two insects with chewing habits that would ingest a large amount of plant cells: Helicoverpa armigera (Hübner) (Lepidoptera: Noctuidae) and Tuta absoluta (Meyrick) (Lepidoptera: Gelechiidae) larvae, both important tomato pests.
Here, we show that molecular markers can be used to specifically identify plant DNA in herbivorous/omnivorous insects. We have developed a tomato-specific marker which allows the detection of tomato DNA in the gut of three different insect species with different feeding types (sucking or chewing insects) and showed the detection percentages of tomato DNA within their gut with digestion time. Finally, we have also shown that this marker allows the identification of plant DNA within field insects collected in tomato greenhouses with just a PCR reaction, avoiding the process of sequencing.
Materials and methods
Insects and plants
Macrolophus pygmaeus were reared at IRTA facilities as explained by Agustí & Gabarra (Reference Agustí and Gabarra2009a,Reference Agustí and Gabarrab). This colony is renewed every year with introductions of new field collected insects near Barcelona (NE Spain). They were maintained on tobacco plants (Nicotiana tabacum L.) and Ephestia kuehniella Zeller (Lepidoptera: Pyralidae) eggs. Helicoverpa armigera and T. absoluta larvae were collected in tomato fields near Barcelona and maintained on artificial diet and on tomato plants, respectively. All insects were maintained under controlled conditions of 25±1°C, 70±10% RH and L16:D8 photoperiod. Ephestia kuehniella eggs were provided by Biotop (Valbonne, France).
Tomato (Solanum lycopersicum L.), cabbage (Brassica oleracea L.) and tobacco (Nicotiana tabacum L.) plants were cultivated in greenhouses at IRTA. Potato (Solanum tuberosum L.), aubergine (Solanum melongena L.), pepper (Capsicum annum L.), zucchini (Cucurbita pepo L.) and cucumber (Cucumis sativus L.) plants were obtained from fields in the vicinity of our facilities. Carlina corymbosa L., Ononis natrix L., Verbascum thapsus L. and Solanum nigrum L. plants were obtained from the margins of the previously cited crops in the same area.
DNA extraction
Whole individual insects were homogenized in clean microcentrifuge tubes to avoid possible contamination by its own faeces, and DNA extractions were done using the DNeasy Tissue Kit (QIAGEN, Hilden, Germany; protocol for insects). Plant DNA was extracted from a 1 cm diameter leaf disc using the DNeasy Plant Mini Kit (QIAGEN) following the manufacturer's protocol. Total DNA was eluted with 100 ml in the AE buffer provided in the kit. All DNA extracts were stored at −20°C.
PCR amplification
Specific tomato primers were designed from the ITS 1–2 region by comparison with sequences of other solanaceous plants with CLUSTALW (Larkin et al., Reference Larkin, Blackshields, Brown, Chenna, McGettigan, McWilliam, Valentin, Wallace, Wilm, Lopez, Thompson, Gibson and Higgins2007). Sequences obtained from GenBank were: S. lycopersicum (AF244747), S. tuberosum (AY875827), S. nigrum (AJ300211) and N. tabacum (AJ300215). Guidelines proposed for the design of efficient and specific primers by Innis & Gelfand (Reference Innis, Gelfand, Innis, Gelfand, Sninsky and White1990) and Saiki (Reference Saiki, Innis, Gelfand, Sninsky and White1990) were followed. Primers were synthesized by Roche Diagnostics, Basel, Switzerland. DNA amplifications were performed in a 10 μl reaction volume containing 1 μl of DNA extract, 5 μl of master mix of Multiplex Kit (QIAGEN) and 1 μl of primer mix (10 μM). Samples were amplified in a 2720 thermal cycler (Applied Biosystems, CA, USA) for 40 cycles at 94°C for 30 s; 62°C for 2 min and 72°C for 90 s. A first cycle of denaturation at 95°C for 15 min and a final extension at 72°C for 10 min were carried out. Tomato DNA and water were always included as positive and negative controls, respectively. PCR products were separated by electrophoresis in 1.5% agarose gels stained with ethidium bromide and visualized under UV light.
Species specificity
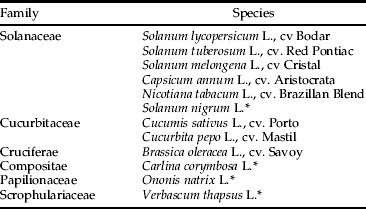
The specificity of the tomato primers was tested by attempting to PCR-amplify DNA from leaf discs of 11 other cultivated and non-cultivated plant species belonging to six families (table 1) (n=2). These species were all selected as being present in the studied area and could potentially be fed on by the targeted insects. Starved M. pygmaeus, H. armigera and T. absoluta (n=10) were also tested.
Plant species used in the specificity test (n=2).
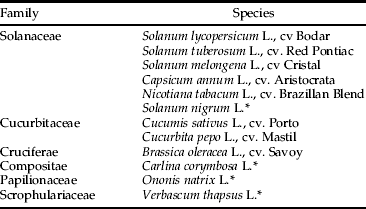
* Species marked with * are non-crop plants.
Feeding trials and detection periods
Clean tomato leaves were cut in small discs (2.5 cm diameter) which included a fragment of the central leaf vein, where mirids usually feed. Each tomato leaf disc was put on a 0.5-cm thick layer of an agar solution (5‰) in small plastic boxes (2.6 cm diameter). A starved 48 h (at 25°C) M. pygmaeus female was introduced in each plastic box for three hours at room temperature and was observed every 10 min. Only those individuals that had been seen with the stylet inserted into the leaf at least three times were considered to have fed and were frozen until tested by PCR. Lepidopteran feeding trials were prepared in the same way, but with a tomato leaf disc of 1 cm diameter and without the agar layer. In each of the plastic boxes, a third or fourth instar larva starved for 48 h was individually confined for three hours at room temperature. Lepidopteran larvae were only considered for the analysis if they had consumed at least 10 mm² of the tomato leaf.
Once the insects had been observed feeding, they were either immediately frozen at −20°C (t=0) or maintained at 25°C for 2, 4 or 8 h (M. pygmaeus); 6, 8 or 24 h (H. armigera) and 8 or 24 h (T. absoluta). After that, they were frozen at −20°C. Twenty M. pygmaeus females were assayed at t=0 and 8 h and 16 at t=4 h. Ten lepidopteran larvae were assayed for all times. Positive (tomato DNA) and negative (free DNA) control samples were included in all PCRs. Each sample was tested up to three times and considered positive if tomato DNA was detected in one of these three replicates. Negative exponential equations were fitted to describe the decay in the percentage of positive responses with time and R2 was calculated (JMP 8.0.1; SAS Institute Inc.). From these equations, the half-lives (50% positive detection) were estimated (Greenstone et al., Reference Greenstone, Rowley, Weber and Hawthorne2007).
Analysis of field collected Macrolophus pygmaeus
We analyzed M. pygmaeus collected from several tomato greenhouses in the studied area. Those predators were part of another study that has analyzed predation on two whitefly species and their parasitoids (Moreno-Ripoll et al., Reference Moreno-Ripoll, Gabarra and Agustí2009; personal communication). Once collected, those predators (25 males, 31 females and 83 nymphs) were frozen at −20°C prior to DNA extraction. Each individual was analyzed by PCR using the tomato specific primers developed in this work.
Results
Development of ITS markers
Sequences of ITS-1, 5.8S and ITS-2 regions of S. lycopersicum, S. tuberosum, S. nigrum and N. tabacum were aligned and compared in order to design one pair of tomato-specific primers. These primers were named Le2F and Le1R and their sequence was 5′-CCGAGGCGCGCAAGCTCTTC-3′ and 5′-TAAAGCCTTGCGGCGTGCGAG-3′, respectively. They amplified a fragment of 332 bp for S. lycopersicum including part of ITS-1 and ITS-2, and the whole 5.8S region.
Species specificity and detection periods
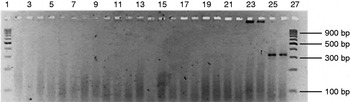
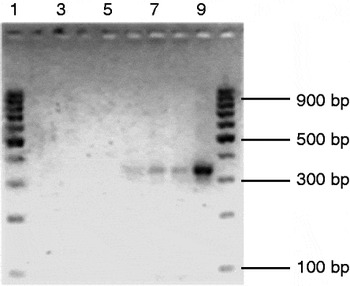
These primers were tomato specific. No other plant species, neither cultivated nor weeds, amplified a band of the same length in the cross-reactivity test (fig. 1). Even if a band of a very high molecular weight was amplified in N. tabacum, this does not interfere with detection of the specific tomato band. Besides, a fragment of that size is unlikely to be detected after digestion. None of the starved insects tested (M. pygmaeus, H. armigera and T. absoluta) gave false positive results (fig. 2).
PCR products obtained using the tomato-specific ITS primers (332 bp). Lanes 3–26 show different plant species: 3–4, Verbascum Thapsus; 5–6, Ononis natrix; 7–8, Carlina corymbosa; 9–10, Brassica oleracea; 11–12, Cucurbita pepo; 13–14, Cucumis sativus; 15–16, Capsicum anuun; 17–18, Solanum nigrum; 19–20, Solanum melongena; 21–22, Solanum tuberosum; 23–24, Nicotiana tabacum; 25–26, Solanum lycopersicum. Lane 2, negative control. Lane 1 and 27, 100 bp molecular-size marker.

PCR products obtained using the tomato-specific ITS primers (332 bp). Lane 3, starved M. pygmaeus; lane 4, starved T. absoluta; lane 5, starved H. armigera; lane 6, M. pygmaeus fed on tomato; lane 7, T. absoluta fed on tomato; lane 8, H. armigera fed on tomato; lane 9, tomato. Lane 2, negative control. Lane 1 and 10, 100 bp molecular-size marker.

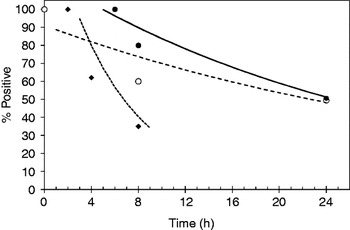
Tomato DNA was detected within all individuals of the three insect species tested after they had fed on tomato leaf discs with 100% detection in both chewing and sucking insects immediately after feeding (t=0) (fig. 3). In all three species, tomato DNA detection decreased with time since t=0 within T. absoluta and after 2 h and 6 h within M. pygmaeus and H. armigera, respectively (fig. 3). Detection curves were fitted to a negative exponential equation starting with the last detection time where 100% detection was obtained. Equations were: y=133.1exp−0.17x, R2=0.98; y=114.7exp−0.03x, R2=0.95 and y=88.7exp−0.026x, R2=0.81 for M. pygmaeus, H. armigera and T. absoluta, respectively. From these equations, half-lives of tomato DNA detection within their gut were estimated as 5.8 h for M. pygmaeus, 27.7 h for H. armigera and 28.7 h for T. absoluta.
Detectability of tomato DNA in the gut of M. pygmaeus, T. absoluta and H. armigera at different times after ingestion. Equations and R2 values are shown in the text (●, H. armigera;  , T. absoluta; ⧫, M. pygmaeus).

Analysis of field collected M. pygmaeus
Tomato DNA was found in 30.2% of field-collected M. pygmaeus (n=139), being much higher in nymphs (36.1%) and females (32.3%) than in males (8%).
Discussion
In this study, we show the detection of plant DNA within the gut of three insect species by the use of a specific molecular marker. Tomato-specific primers were highly specific, showing no cross-reactivity either with other closely-related plant species or with the insect species tested.
The COI region has been applied extensively in animal barcoding; but, it is known that, for most of the plant species, it is not suitable due to its much slower rate of COI gene evolution in higher plants than in animals (Kress et al., Reference Kress, Wurdack, Zimmer, Weigt and Janzen2005). There is a lack of consensus on the most appropriate barcoding locus and criteria to be used in plants (Hollingsworth et al., Reference Hollingsworth, Clark, Forrest, Richardson, Pennington, Long, Cowan, Chase, Gaudeul and Hollingsworth2009; Valentini et al., Reference Valentini, Pompanon and Taberlet2009a). Kress et al. (Reference Kress, Wurdack, Zimmer, Weigt and Janzen2005) proposed ITS and trnH-psbA as the best candidate regions for the design of plant-specific molecular markers, and ITS has been shown to work on many plant groups and has been recommended (Chase et al., Reference Chase, Salamin, Wilkinson, Dunwell, Kesanakurth, Haidar and Savolainen2005; Sass et al., Reference Sass, Little, Stevenson and Specht2007; Chen et al., Reference Chen, Yao, Han, Liu, Song, Shi, Zhu, Ma, Gao, Pang, Luo, Li, Li, Jia, Lin and Leon2010). According to these considerations, we have designed a pair of primers from the ITS region that amplifies a fragment, 332 bp long, that proved very effective for the detection of tomato DNA within the gut of the insects tested. As previously suggested (Agustí et al., Reference Agustí, De Vicente and Gabarra1999), those primers were designed to amplify relatively short fragments to make possible the detection of semi-digested DNA fragments.
In this study, tomato DNA was detected in both a small sucking insect (around 4 mm long) (M. pygmaeus) and two bigger chewing insects (T. absoluta and H. armigera). Even with this sucking insect, where the amount of ingested DNA was expected to be much lower than the bigger amount of leaf material (and then plant DNA) ingested by the chewers, the detection was possible in 100% of cases at t=0. As we expected, a faster loss of detection was found within the sucking insect. Some other authors obtained longer detection periods within other sucking insects species compared with chewing ones (Greenstone et al., Reference Greenstone, Rowley, Weber and Hawthorne2007; Hosseini et al., Reference Hosseini, Schmidt and Keller2008); but, as they also mention, detection depends not only on the size of the species analyzed but on the species itself. Degradation of the plant DNA through digestion probably also depends on other biotic and abiotic factors, as happens with insect DNA (Lövei et al., Reference Lövei, Sopp and Sunderland1990; Agustí et al., Reference Agustí, De Vicente and Gabarra1999; Weber & Lundgren, Reference Weber and Lundgren2009).
Tomato DNA was identified in many field individuals of unknown age and feeding history, which shows that even with a relatively quick digestion of tomato DNA within M. pygmaeus, this technique is useful to identify plant DNA in the gut contents of field-collected insects. As with other predators (Agustí et al., Reference Agustí, Unruh and Welter2003b; Harwood et al., Reference Harwood, Desneux, Yoo, Rowley, Greenstone, Obrycki and O'Neil2007; Juen & Traugott, Reference Juen and Traugott2007), it is possible to analyze feeding events in the field and opens the possibility for more detailed studies to confirm the use of a range of food plants.
Such techniques can also be used to understand trophic interactions of omnivorous predators. In predatory Heteroptera, the functions of omnivory and the functional relationships between plant and prey feeding are still poorly understood; and it is not clear to what extent they depend on relative availability, amount or nutritional value of the food types (Gillespie & McGregor, Reference Gillespie and McGregor2000; Sinia et al., Reference Sinia, Roitberg, McGregor and Gillespie2004; Albajes et al., Reference Albajes, Castañé, Gabarra, Alomar, Bigler, Babendreier and Kuhlmann2006). In some cases, the digestive capabilities of these omnivorous predators may vary through their lives (Lundgren & Weber, Reference Lundgren and Weber2010). Comparing our data with those obtained by Moreno-Ripoll et al. (2009; personal communication) using specific primers of two whiteflies and their parasitoids, 13.7% of all individuals were positive for both tomato and insect prey, whereas only-plant or only-prey remains were found in 16.6% and 25.9% of their guts. Simultaneous detection of both food sources was much higher on nymphs than on females and males (19.3%, 6.5% and 4%, respectively). The fact that tomato DNA was detected in many field-collected M. pygmaeus clearly shows that plant material was consumed within a few hours of capture. Detection of both plant and prey within the same individual suggests dietary mixing, mainly in nymphs, according to a model where plant feeding is essential for predation (Sinia et al., Reference Sinia, Roitberg, McGregor and Gillespie2004).
Recently, some studies (Miller et al., Reference Miller, Muller, Kravchenko, Junnila, Vernon, Matheson and Hausmann2006; Matheson et al., Reference Matheson, Muller, Junnila, Vernon, Hausmann, Miller, Greenblatt and Schlein2007; Jurado-Rivera et al., Reference Jurado-Rivera, Vogler, Reid, Petitpierre and Gómez-Zurita2009; Valentini et al., Reference Valentini, Miquel, Nawaz, Bellemain, Coissac, Pompanon, Gielly, Cruaud, Nascetti, Wincker, Swenson and Taberlet2009b) have identified plant meal composition in insects by molecular methods. In these studies, plant DNA fragments from insect guts were sequenced and compared for homologies in the BLAST database (http://blast.ncbi.nlm.nih.gov) in an attempt to identify the ingested plant species. Such procedures, a very powerful tool when identifying unknown ingested plants, are not very practical in field studies where the aim is to confirm the ingestion of a limited number of host plants and where a very high number of insects should be analysed (e.g. to confirm plant sources of predators in crop colonization studies). That would not only require sequencing each DNA fragment found in their gut, but even cloning each fragment when several DNA fragments are present within the insect at the same time. In this case, it is much cheaper and more suitable to develop specific plant primers, in order to identify plant DNA with just a PCR as it has been done in most of the studies about molecular detection of predation and parasitism (King et al., Reference King, Read, Traugott and Symondson2008; Gariepy et al., Reference Gariepy, Kuhlmann, Gillott and Erlandson2007; Agustí et al., Reference Agustí, Bourguet, Spataro, Delos, Eychenne, Folcher and Arditi2005). If several plant DNAs are expected, a multiplex PCR can be used by developing one specific pair of primers for each of the plant species, avoiding the cloning and sequencing needed in the previously cited studies.
This study shows the detection of tomato DNA within the gut of insects by using a specific molecular marker. This marker allows knowing the percentage of insects which have been found to consume tomato plant in an insect population. This is a promising technique in conservation biological control because it can speed up the identification of food plants of colonizing species in the agricultural landscape surrounding target crops.
Acknowledgements
We thank Rafael Moreno-Ripoll and Rosa Gabarra for sharing DNA extractions of field-collected M. pygmaeus with us in order to analyze tomato DNA gut contents. We also thank Thaïs Aznar for her technical assistance and two anonymous reviewers for their comments. This work was funded by projects AGL2006-08726 and AGL2008-00546. NA was supported by the Ramon y Cajal Program and LP by a FPI doctorate studentship both from the Spanish Ministry of Science and Innovation (MICINN).