I. INTRODUCTION
In recent years significant progress has been made in mm-wave sources based on frequency synthesis techniques starting with a fundamental oscillator in the region around 10 GHz and subsequent frequency multiplication. This has led to the development of mm-wave/THz spectrometers for molecular absorption spectroscopy [Reference Medvedev, Neese, Plummer and De Lucia1, Reference Pearson2]. Recently, sensor systems for gas spectroscopy in the mm-wave region, which are based on commercial available components, have been reported, which use frequency synthesis techniques in the region around 10 GHz, with frequency multiplication to 210–270 GHz [Reference Medvedev, Neese, Plummer and De Lucia1]. In [Reference Medvedev, Neese, Plummer and De Lucia1] the mm-wave power was propagated quasi optically with horn antennas and lenses through a 1.2 m long gas absorption cell. Using this technique a chemical analysis of exhaled human breath was performed, and this sensor system may become the technique of choice for a broad range of chemicals [Reference Fosnight, Moran and Medvedev3]. The capability of an mm-wave/THz spectrometer for breath analysis has been demonstrated [Reference Fosnight, Moran and Medvedev3]. It was shown that for selected species, unambiguous detection at a ppt level is possible [Reference Fosnight, Moran and Medvedev3]. The high specificity is due to the very high spectral resolution (0.1 MHz) in combination with large spectral coverage (30 GHz). This results in 300 000 spectral channels, allowing identification of many different molecules and their isotopologues. Another push for mm-wave/THz spectroscopy comes from the rapid developments regarding silicon semiconductor technology and circuits. Silicon technology has made progress toward ever higher device cut-off frequencies, enabling the development of circuits in SiGe for mm-wave applications beyond 200 GHz. Key circuits have been developed and demonstrated [Reference Öjefors, Heinemann and Pfeiffer4–Reference Tomkins8]. SiGe BiCMOS technologies have become very attractive, as they allow high integration, low-cost and combination with digital CMOS control circuits. The European project DOTFIVE has developed novel process modules to push SiGe BiCMOS toward 500 GHz fmax [Reference Pfeiffer9]. This has allowed the utilization of SiGe BiCMOS technology for circuits operating in the frequency range above 200 GHz. Implementing transmitters(TX) and receivers(RX) with integrated antenna in SiGe BiCMOS for applications in the range 200–300 GHz requires an innovative architecture to fulfill all requirements concerning performance, low power dissipation, and low cost. For the receiver architecture, an advantage can be obtained by applying subharmonic mixing, to improve the performance [Reference Öjefors, Heinemann and Pfeiffer5]. For the TX in the frequency range up to 300 GHz, an advantage is obtained by applying frequency multiplication using frequency triplers and frequency doublers, for improved performance and reduced power dissipation [Reference Öjefors, Heinemann and Pfeiffer4]. The implementation of integrated mm-wave radiation sources and detectors offer a path toward a compact and low cost system for gas spectroscopy. Mm-wave sources and detectors for this frequency range are now available as demonstrated by integrated TX and receivers RX [Reference Öjefors, Heinemann and Pfeiffer4, Reference Öjefors, Heinemann and Pfeiffer5, Reference Schmalz, Wang, Borngräber, Debski, Winkler and Meliani10, Reference Schmalz11] in advanced SiGe technology. A TX for the range 240–251 GHz has been presented consisting of a push–push voltage controlled oscillator (VCO) tuned by an external PLL, a power amplifier (PA), a frequency doubler, and an integrated antenna [Reference Schmalz, Wang, Borngräber, Debski, Winkler and Meliani10]. A RX for 245 GHz has been reported consisting of a push–push VCO for the 122 GHz range, which can be tuned by an external PLL, a LNA, a Gilbert-cell subharmonic mixer (SHM), and an integrated antenna [Reference Schmalz11].
This paper is an extended and updated version of our paper [Reference Schmalz12], which presents now a considerably higher sensitivity for our gas spectroscopy system due to applying frequency modulation (FM). This paper presents a system for in-situ gas spectroscopy at about 245 GHz, which consists of 245 GHz TX- and RX-chips, whose local oscillator (LO) frequencies are swept by two external PLLs with constant frequency offset. This frequency region was chosen, because many volatile organic compounds and toxic industrial chemicals have characteristic fingerprint-like absorption spectra around 250 GHz [Reference Neese, Medvedev, Plummer, Frank, Ball and De Lucia13]. Compared to similar systems based on GaAs or InP technology, SiGe offers the potential to be more cost-efficient. In comparison with laser-based systems, for example a Nd:YAG laser in combination with a master oscillator/power oscillator, a SiGe TX/RX in-situ absorption spectrometer can be more compact and less power-consuming [Reference Sun, Ding and Zotova14]. The effective antenna gain of the TX and RX, respectively, is increased by a dielectric lens to allow the implementation of a 0.6 m long gas absorption cell. The performance of the system is demonstrated by measuring the absorption spectrum of gaseous methanol. Methanol was chosen, because it has a rich absorption spectrum. At this stage no systematic spectroscopic investigation of many different gases and gas mixtures has been performed, because this has been demonstrated already with the other more conventional GaAs-based TX/RX systems [Reference Neese, Medvedev, Plummer, Frank, Ball and De Lucia13, Reference Neumaier, Schmalz, Borngräber, Wylde and Hübers15]. In Section II of this paper, we describe the design of the circuits, which were used for the RX and TX. Section III is dedicated to the design of the integrated antenna, used for the RX and TX, and the design of the lens, which is used to increase the effective antenna gain for the gas spectroscopy system. The measurement results of the RX and TX are presented in Section IV, followed by the presentation of the gas spectroscopy system in Section V. Finally, this paper ends with conclusions.
II. CIRCUIT DESIGN OF RECEIVER AND TRANMITTER
The RX and TX of the sensor system were fabricated in the new generation of IHP's 0.13 µm SiGe BiCMOS technology [16]. The RX and TX was designed with the design kit of IHP for its 0.13 µm BiCMOS technology with seven metal layers, and with high-speed SiGe:C heterojunction bipolar transistors (HBTs) featuring a transit frequency (f T ) of 300 GHz and a maximum oscillation frequency (f max) of 500 GHz [17]. We used subsequent fabrication runs of this technology for the fabrication of our RX- and TX-chips.
We used the GoldenGate® RF integrated circuit simulator to design and optimize the RX and TX. The subcircuits of the RX and TX, respectively, were designed using GoldenGate and ADS from Agilent. The transmission lines and transformers were simulated with a 2.5D planar EM-simulator (momentum). For the transformers we applied S-parameter-based models. The passive circuits for frequencies around 245 GHz were simulated using three-dimensional EM-simulator (EMPro from Agilent).
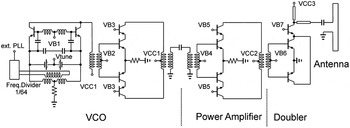
The building blocks for the gas spectroscopy system are a TX- and a RX-chip including on-chip-antenna with localized backside etching (LBE). An integrated LO is used for the TX as well as for the RX, whose frequency is tuned by an external PLL. The two PLLs of the system are controlled by the two external reference frequencies with frequency offset to realize a constant IF frequency in the range up to about 100 MHz during a frequency sweep. The very small change in the IF-signal amplitude due to gas absorption is used for gas spectroscopy. The LO of the TX and the RX, respectively, consists of a 120 GHz push–push VCO with an 1/64 frequency divider for the fundamental frequency, and a 120 GHz differential one-stage PA (see Fig. 1).
Schematic of the 245 GHz transmitter: 120 GHz push–push VCO with 1/64 frequency divider, the one-stage 120 GHz PA, the frequency doubler, and the antenna.

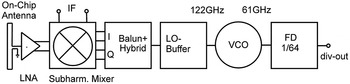
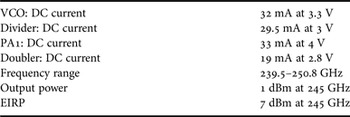
The PA uses one-stage with a differential cascode, transformer-coupled topology. The PA draws 33 mA at 4 V supply voltage. The TX consists of the 120 GHz LO, which is coupled to a frequency doubler, whose single-ended output feeds an on-chip antenna, as shown in Fig. 1. The TX output power is 1 dBm at 245 GHz [Reference Schmalz, Borngräber, Heinemann, Rücker and Scheytt18]. The RX consists of the 120 GHz LO as described, a Gilbert-cell based SHM, a LNA, and the same on-chip antenna as used for the TX (see Fig. 2).
Schematic of the 245 GHz subharmonic receiver.

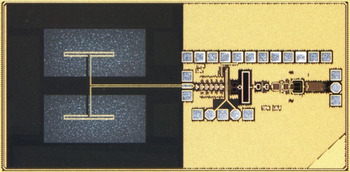
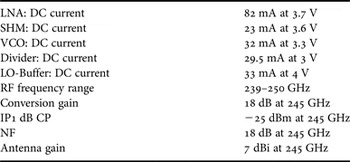
The quadrature LO outputs are generated by a differential 90° −3-dB transmission line coupler, similar as described in [Reference Öjefors, Heinemann and Pfeiffer5], which is connected to the LO-buffer by a 120 GHz Marchand balun. The LNA is a five-stage design with amplifier stages, which are coupled by identical transformers, and baluns at the input and output transformer, respectively, as reported in [Reference Schmalz, Borngräber, Mao, Rücker and Weber19]. Each stage contains four HBTs with A E = 8 × (0.12 × 0.96) µm2. We used weak emitter degeneration in three stages to ensure stability of the 245 GHz LNA. A measured gain of 18 dB and a measured noise figure of 11 ± 1 dB have been achieved for the LNA at 245 GHz [Reference Schmalz, Borngräber, Mao, Rücker and Weber19]. The LNA draws 82 mA at 3.7 V supply voltage. We used a SHM design based on two stacked switching quads [Reference Schmalz, Mao, Borngräber, Neumaier and Hübers6, Reference Tomkins8]. The mixer core contains ten HBTs with A E = 8 × (0.12 × 0.96) µm2. The differential IF output was obtained by emitter followers connected to 150 Ω load resistors. The SHM draws 23 mA at 3.6 V supply voltage. Figure 3 shows the micrograph of the fabricated RX-chip with integrated antenna. The die area is 2.7 × 1.3 mm. Breakup circuits of this RX are described in [Reference Schmalz11].
Micrograph of the receiver chip with on-chip antenna.

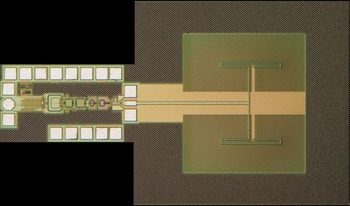
Figure 4 depicts the micrograph of the fabricated TX-chip with integrated antenna. The die area is 2.34 ×1.3 mm.
Micrograph of the transmitter chip with on-chip antenna.

III. ANTENNA AND LENS DESIGN
In the following, we describe the on-chip antenna design and the design of the external lens, which increases the effective antenna gain.
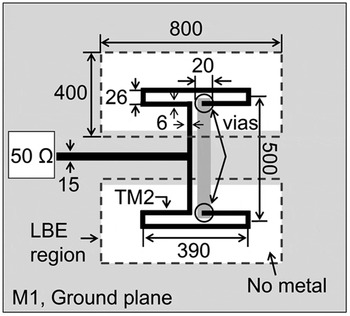
The LBE available at IHP is an effective way to improve the efficiency of the on-chip antenna by removing the lossy silicon under the radiator. This technique is part of a standard through silicon via (TSV) process. The antenna design is shown in Fig. 5.
Geometry of the on-chip antenna (units is µm).

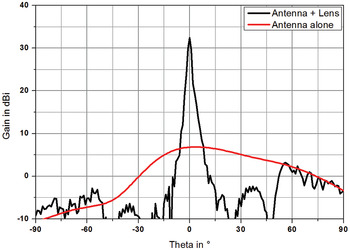
The antenna design is shown as part of the RX-chip and TX-chip, in Figs 3 and 4, respectively. The top thick layer TM2 is used to realize the radiators and the feeding transmission lines, whereas M1 serves as ground layer for both the circuit and the feeding lines. The antenna is composed of two half-wavelength folded dipoles. The ground plane of the module acts as a reflector for the antenna. The thickness of the silicon substrate is 200 µm for optimal performance. To improve the gain a dielectric lens has been attached above the antenna. The lens is made of high density polyethylene with a permittivity of ε r = 2.32 and has a diameter of 40 mm and a focal length of 25 mm. It is of plano-convex type with two refracting surfaces. Thus energy reflected at the lens surface is not radiated back toward the antenna and hence it does not disturb its performance. Figure 6 shows the simulated radiation pattern of the on-chip antenna alone and of the antenna together with the lens. As it can be seen the gain increases from 7 to 33 dBi. The half power beamwidth (HPBW) decreases from 62 to 2.1°. The lens itself is shown as part of the gas spectroscopy system in Fig. 13.
Radiation pattern in e-plane of the antenna alone and together with the lens.

An additional advantage of the dielectric lens is that its focal distance can be used to tune the gain of the antenna-lens combination. Thus for each application the best compromise between HPBW and gain can be chosen.
IV. RECEIVER AND TRANSMITTER RESULTS
In the following, we describe the performance of the RX and TX used in our gas spectroscopy system, and we present the parameters of their subcircuits.
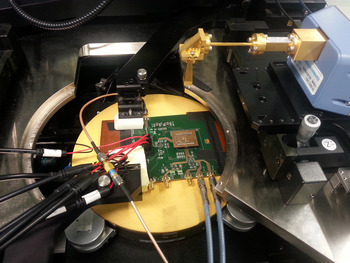
The measurements of 245 GHz receiver were carried out in the setup shown in Fig. 7. The 245 GHz receiver chip was bonded on a plug-in board. An efficient thermal backside contact of the RX-chip with the large Cu-layer of the board was realized using liquid metal. The plug-in board was then mounted on the carrier board with the PLL device (ADF4007 with divide ratio 8) (see Fig. 7).
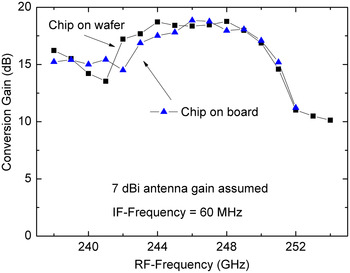
The VCO of the RX was controlled by the PLL to obtain a stable IF signal at frequencies up to 130 MHz. The reference signal (about 120 MHz) for the PLL was delivered from a high-quality signal generator (SML01 from R&S) to enable reception of the RF signal in the 235–253 GHz range. The mm-wave signal was generated by a commercial transmitter (R&S® ZVA-Z325 Converter) attached to a standard WR-3.4 horn antenna with 25 dBi gain (specified at 270 GHz). The distance between the horn antenna and the on-chip antenna was set to 9.5 cm. Assuming far field conditions, we calculated the conversion gain from the received input power and the IF output power (see Fig. 8).
Photograph of the quasi-optical set-up for on-wafer measurements: the carrier board with PLL and the small plug-in board with 245 GHz receiver chip.

Conversion gain versus RF-frequency with 60 MHz IF-frequency: (i) receiver-chip on wafer, (ii) receiver-chip mounted on board with external PLL.

We assumed for this estimation a 7 dBi antenna gain as obtained for the on-chip antenna [Reference Sun, Ding and Zotova14]. Applying the same setup, we performed also on-wafer measurements for the RX with LBE to obtain the RX conversion gain. We observed 18 dB conversion gains at 245 GHz (see Fig. 8), in agreement with the results for the RX-chip on the plug-in board. As the conversion gain of RX decreases considerably at higher temperature [Reference Schmalz11], this result indicates that the thermal contact of the RX-chip with the plug-in board is sufficient to avoid a decreased conversion gain of the RX-chip due to its relatively large power dissipation of 0.6 W. According to the −3 dB gain bandwidth the RX can be used in the frequency range from 238 to 250 GHz. Table 1 presents the technical data of the RX.
Performance of the RX-chip.

Table 2 summarizes the technical data of the TX.
Performance of the TX-chip.

V. SIGE GAS SPECTROSCOPY SYSTEM
In the following, we describe our gas spectroscopy system, and we present spectra of gaseous methanol observed with this system.
Prior to implementation into the gas spectroscopy system the TX and RX were characterized. To improve their effective antenna gain a lens as described in Section III was mounted at a distance of 22 mm in front of each module. We used an optical rail for movable mounting of the TX and RX boards with the lenses (see Fig. 9).
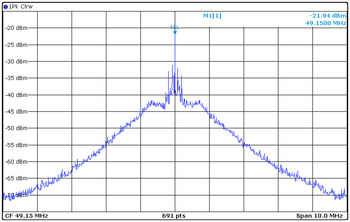
The effective antenna gain of the TX and RX, respectively, is increased by the lens. Figure 10 shows the received IF spectrum for 2 m distance between the apex of the lenses of the TX and RX (peak value: −21.9 dBm at 49.1 MHz).
Optical rail with TX-module (left) and RX-module (right).

The IF-spectrum of the received signal: IF-center frequency at 49.1 MHz; single-ended IF; TX and RX modules with lenses; 2 m distance between TX and RX.

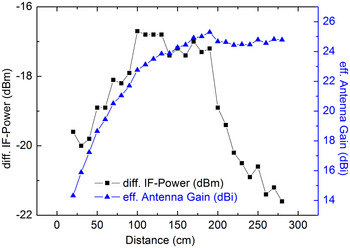
Figure 11 presents the received IF power as function of the distance between TX and RX. The effective antenna gain, estimated by Friis radio link formula, reaches saturation for far-field conditions (distance >2.6 m) with a gain of 25 dBi. The measured effective antenna gain is somewhat lower than the simulated gain of 33 dBi probably due to a misalignment of the TX and RX modules. The IF power increases from −19 to −17 dBm when the distance between TX and RX increases from 0.5 to 1 m. This IF-signal strength is sufficient for performing gas spectroscopy with our 56-cm long absorption cell.
Differential IF-power of the receiver and effective antenna gain of the on-chip antenna in combination with lens: the parameter is the distance between transmitter and receiver.

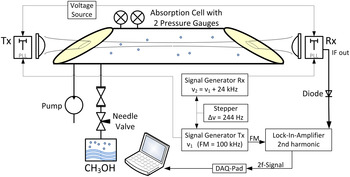
The block diagram of the sensor system is shown in Fig. 12. The reference signals for the PLLs were delivered from two signal generators with a frequency offset of 24 kHz (corresponding to 2048 × 24 kHz = 49.152 MHz for IF). The frequency step of the frequency sweep was set by the stepper for the reference frequency at the signal generator. A step size of 244 Hz corresponds to a frequency step of 2048 × 244 Hz = 0.5 MHz. FM with an amplitude (frequency deviation) of 1.38 MHz (2048 × 675 Hz) for the TX frequency and a FM of 100 kHz was applied to the reference frequency of the TX-PLL.
Block diagram of the TX/RX sensor system with gas absorption cell, TX-module, and RX-module.

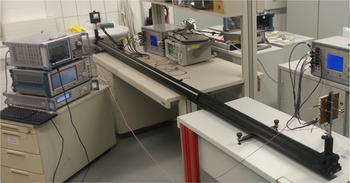
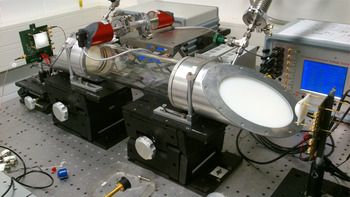
We have used a 0.6 m long gas absorption cell between the TX and RX for gas spectroscopy [Reference Schmalz, Mao, Borngräber, Neumaier and Hübers6] (see Fig. 13). The effective antenna gain of the TX and RX, respectively, is increased by the external dielectric lenses as described above. The second harmonic content (2f) of the absorption spectrum was obtained by detecting the IF power of the RX using a diode power sensor connected to a lock-in amplifier. The 100 kHz modulation frequency serves as the reference for the lock-in amplifier. A DAQPad multifunction data acquisition device provided the connectivity for acquiring the output data of the lock-in amplifier.
Photograph of the TX/RX system demonstrator with lenses and the gas absorption cell: left – RX-module, right – TX-module..

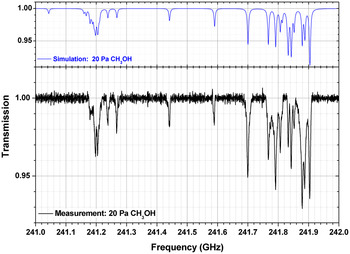
The applicability of our SiGe sensor system is demonstrated by measuring spectra of gaseous methanol. For this purpose methanol was evaporated from a small container with liquid methanol. The gaseous methanol was introduced into the absorption cell through a series of a two needle valve, which controlled the gas flow. A turbo molecular pump was used for obtaining the low pressure in the range from 0.1 to 30 hPa, which is needed for the gas spectroscopy. The pressure in the absorption cell is measured with a capacitive pressure gauge. The spectra were obtained by applying frequency ramps to the reference frequency of TX and RX, respectively, with a constant frequency offset to generate the 50 MHz IF signal of RX. The IF-power was recorded during ramping by a spectrum analyzer. The ramping time was 1616s to measure the spectrum shown in Fig. 14. The spectrum analyzer recorded 16 160 data points during this time. Along with the measured spectra, simulated spectra of methanol are also shown. These spectra were calculated using the HITRAN [Reference Rothman20] spectral data base. Note the excellent agreement between the simulated and the measured spectrum. Figure 14 shows a spectrum taken without FM after data processing (baseline correction and averaging).
Calculated (top) and measured (bottom) absorption spectrum of methanol at a pressure of 20 Pa.

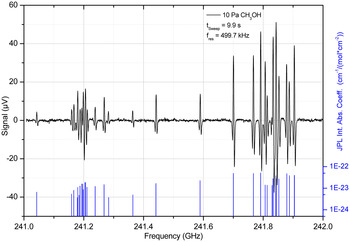
Figure 15 presents the 2f absorption spectrum at a gas pressure of 10 Pa for a sweep time of 10 s after baseline correction and the simulated spectrum of the absorption coefficient.
Measured 2f absorption spectrum of methanol (top), and simulated spectrum of absorption coefficient (bottom).

It is worth noting, that the frequency sweep time is considerably shorter in the case of 2f absorption spectroscopy with FM compared with the sweep time in the case of spectroscopy without FM.
VI. CONCLUSION
A system for gas spectroscopy in the frequency range 240–250 GHz is presented consisting of a SiGe TX and RX, whose internal local oscillators are tuned by external PLLs. The RX and the TX are fabricated in 0.13 µm SiGe:C BiCMOS technology with f T /f max of 300 GHz/500 GHz. The effective antenna gain of the RX and TX is increased using additional dielectric lenses. Using a 0.6 m long gas absorption cell between the TX and RX, the absorption spectrum of methanol has been measured. The performance of the sensor system is also demonstrated by measuring the 2f absorption spectrum (second harmonic detection) of gaseous methanol using FM. Our mm-wave SiGe spectroscopy system presents the highest integration level of such a system reported so far. An extension of the frequency range is feasible by modifying the internal local oscillator. The further development of the presented spectroscopic system will be aimed to meet a wider frequency range. The relevant frequency ranges are, e.g. from 230 to 260 GHz for breath analysis, and from 240 to 280 GHz for the detection of important toxic gases. The wide frequency span could be addressed by switchable local oscillators in the transmitter and receiver.
 K. Schmalz obtained his Ph.D. degree in Physics in 1978, and worked in the field of silicon semiconductor technologies and research for some time and has expertize in the area of thermally induced defects and characterization of Si/SiGe structures. After training in RF circuit design at UCLA in Los Angeles, 1998–1999, he changed his scientific focus to RF analog circuit design. Now, his research interest is the design of SiGe BiCMOS analog circuits for wireless communication with emphasis on RF front-ends for different standards and mm-wave circuits for sensor applications. He has authored and co-authored more than 100 papers. K. Schmalz is currently with IHP, Frankfurt (Oder), Germany.
 R. Wang received his bachelor's degree from Tianjin University, China, in 2006, and master's degree in Electrical Engineering from Chalmers University of Technology, Sweden, in 2008, respectively. He is currently a research member with IHP in Frankfurt (Oder), Germany. His research interests include millimeter-wave antenna and packaging designs.
 W. Debski was born in Krakow, Poland in 1977. He received M.S. degree in Electronics Engineering from the University of Science and Technology, Krakow, Poland in 2002, and Ph.D. degree in Electrical Engineering from the Brandenburg University of Technology, Cottbus, Germany in 2007. He joined Siliconradar GmbH, Frankfurt (Oder), in 2007, where he is involved in the development of radar components and systems.
 H. Gulan received the Dipl.-Ing. (FH) degree from the University of Applied Science Esslingen, Germany, in 2008 and the Dipl.-Ing. degree from the Karlsruhe Institute of Technology (KIT), Germany in 2010. Since 2011, he is working as research staff member at the Institut für Hochfrequenztechnik und Elektronik (IHE) at the KIT and is currently working towards his Ph.D. His research interests include millimeter and sub-millimeter wave antennas, lens antenna design and millimeter-wave packaging. He also has experience in designing waveguide filter components for spaceborne applications.
 J. Borngräber received his Diploma of Mathematics from Humboldt University, Berlin, Germany, in 1981. Since 1994, he is working in the Department of Circuit Design at IHP Microelectronics GmbH. Currently his special interest is in noise figure and phase noise measurement techniques in the millimeter-wave range.
 P. F.-X. Neumaier was born in Landshut, Germany, in 1984. He received his Diploma degree in Physics from the University of Freiburg, Germany in 2012, and is currently working toward the Ph.D. degree in the field of THz physics and spectroscopy at the Technical University of Berlin, Germany. From 2010 to 2012 he was with Fraunhofer Institute for Physical Measurement Techniques IPM in Freiburg, Germany where he worked on gas sensing microelectronics with surface physics and semiconducting metal-oxides. From 2012, he has been with the German Aerospace Center, Berlin, Germany, while working toward the Ph.D. degree.
 H.W. Hübers received the diploma degree and Dr. rer. nat. degree in Physics from the Universität Bonn, Germany, in 1991 and 1994, respectively. From 1991 to 1994, he was with the Max-Planck-Institut für Radioastronomie in Bonn, Germany. In 1994, he joined Deutsches Zentrum für Luft- und Raumfahrt (German Aerospace Center, DLR) in Berlin, Germany, and became head of the department in 2001. From 2009 to 2014 he has been professor of experimental physics at Technische Universität Berlin, Germany, and head of the department “Experimental Planetary Physics” at DLR. In 2014 he became director of DLR's Institute of Optical Sensor Systems and professor at Humboldt-Universität zu Berlin. His research interests are in THz physics and spectroscopy, particularly in THz systems for astronomy, planetary research, and security. Professor Hübers has received the Innovation Award on Synchrotron Radiation (2003) and the Lilienthal Award (2007).