





Introduction
Corn (Zea mays L.)–soybean (Glycine max L.) rotations dominate row-crop production across the U.S. Midwest and underpin both regional productivity and agroecosystem sustainability (Guo, Marquart-Pyatt and Robertson, Reference Guo, Marquart-Pyatt and Robertson2023; Weidhuner et al., Reference Weidhuner, Zandvakili, Koduru, Krausz, Cook, Hanauer, Jones and Sadeghpour2026). In recent decades, increasing attention has been directed toward integrating winter cover crops into these systems to address soil degradation and nutrient losses associated with intensive annual cropping (Guzel et al., Reference Guzel, Guzel, Guzel, Brevik, Ola and Sadeghpour2026). Cover crops can reduce soil erosion, enhance soil organic carbon (C) and nitrogen (N) cycling, improve soil structure (Blanco-Canqui and Ruis, Reference Blanco-Canqui and Ruis2020; Liptzin et al., Reference Liptzin, Norris, Cappellazzi, Mac Bean, Cope, Greub, Rieke, Tracy, Aberle, Ashworth and Tavarez2022; Shahrivar et al., Reference Shahrivar, Ola, Javid, Brevik, Williard, Schoonover, Gage and Sadeghpour2026), and decrease nitrate-N (NO3-N) losses to surface and groundwater (Nouri et al., Reference Nouri, Lukas, Singh, Singh and Machado2022; Gentry et al., Reference Gentry, Green, Mitchell, Andino, Rolf, Schaefer, Nafziger, Schaefer and Nafziger2024). Within Midwest soybean systems, cereal rye (CR; Secale cereale L.) has emerged as the most widely adopted cover crop due to its winter hardiness, rapid spring growth, and strong capacity to scavenge residual soil nutrients during the fallow period (Krueger et al., Reference Krueger, Ochsner, Porter and Baker2011; Hashemi et al., Reference Hashemi, Farsad, Sadeghpour, Weis and Herbert2013; Vaughn et al., Reference Vaughn, Adeyemi, Zandvakili, Hunter, Nair, Still and Sadeghpour2022; Marcos et al., Reference Marcos, Acharya, Parvej, Robertson and Licht2023; Wang et al., Reference Wang, Timlin, Thapa, Fleisher, Beegum, Han, Schomberg, Mirsky, Sun, Reddy, Horton and Tully2025; Kula et al., Reference Kula, Baker, Samadi, Afshar, Koduru, Javid and Sadeghpour2026).
Despite these environmental benefits, soybean performance following CR remains sensitive to management. In particular, excessive residue accumulation following CR termination can influence planting conditions, soil temperature and moisture dynamics, and early-season cash crop establishment (Sadeghpour et al., Reference Sadeghpour, Adeyemi, Hunter, Luo and Armstrong2021; Nunes et al., Reference Nunes, Wallace, Arneson, Johnson, Young, Norsworthy, Ikley, Gage, Bradley, Jha, Lancaster, Kumar, Legleiter and Werle2024). Beyond residue quantity, residue quality, often expressed as C:N ratio, plays a critical role in governing decomposition rates and short-term N availability. High C:N residues can slow residue breakdown and temporarily immobilize soil N, potentially affecting soybean reproductive development even when vegetative growth appears unaffected (Greub and Roberts, Reference Greub and Roberts2023). These interactions highlight the need to manage CR to preserve ecosystem services while avoiding unintended agronomic trade-offs.
Seeding rate is a primary management practice through which producers influence CR growth, residue persistence, and nutrient dynamics. Across the Midwest, CR is commonly seeded at rates ranging from approximately 67 to 135 kg ha−1 when drilled, particularly where maximizing ground cover and weed suppression are prioritized (Boyd et al., Reference Boyd, Brennan, Smith and Yokota2009; Ryan et al., Reference Ryan, Mirsky, Mortensen, Teasdale and Curran2011; Koehler-Cole and Elmore, Reference Koehler-Cole and Elmore2020; Sadeghpour et al., Reference Sadeghpour, Adeyemi, Reed, Fry and Keshavarz Afshar2022; Vaughn et al., Reference Vaughn, Adeyemi, Zandvakili, Battaglia, Babaei, Nair, Still, Burkett and Sadeghpour2024). However, higher seeding rates increase input costs and often generate large quantities of high-C:N residue, which may elevate the risk of soybean yield penalties (Singh et al., Reference Singh, Thilakarathne, Williard, Schoonover, Cook, Gage and McElroy2020). Evidence increasingly suggests that seeding rates above approximately 67 kg ha−1 do not consistently produce proportional gains in biomass or functional benefits, especially in soybean-based systems (Haramoto, Reference Haramoto2019; Reed and Karsten, Reference Reed and Karsten2022; Brockmueller et al., Reference Brockmueller, Sexton, Osborne and Chim2023; Baker et al., Reference Baker, Kula, Babaei, Burkett, Brevik and Sadeghpour2026).
Recent studies have demonstrated that reduced CR seeding rates can maintain comparable biomass production and agronomic performance while lowering costs and limiting excessive residue loads. Haramoto (Reference Haramoto2019) reported that although ground cover increased from 34 to 112 kg ha−1, weed suppression and biomass accumulation did not improve. In soybean systems, Reed and Karsten (Reference Reed and Karsten2022) found that a seeding rate of 34 kg ha−1 produced CR biomass comparable to higher rates (67 and 134 kg ha−1) without reducing soybean yield. Similarly, Ficks, VanGessel and Wallace (Reference Ficks, VanGessel and Wallace2022) observed that a seeding rate of 51 kg ha−1 provided weed suppression equivalent to 135 kg ha−1 in the Mid-Atlantic region. Collectively, these findings suggest that lower seeding rates may deliver key ecosystem services while reducing economic and agronomic risks.
However, very low CR seeding rates (<28 kg ha−1) remain poorly evaluated, particularly in poorly or somewhat poorly drained Alfisols common to southern Illinois and neighboring regions (e.g., Kentucky and Missouri), where residue persistence and spring soil conditions may disproportionately affect soybean establishment and reproductive allocation. Moreover, few studies have explicitly linked CR residue quantity and quality to soybean yield components, harvest index, and economic outcomes under current conservation incentive frameworks. As financial incentive eligibility increasingly shapes producer decision-making, understanding how seeding rate influences both biological and economic performance is essential for developing practical, systems-level recommendations. We hypothesized that reducing CR seeding rates to low or moderate levels would maintain residue-driven benefits while minimizing soybean yield penalties, and that the economically optimal seeding rate would be determined more by financial incentive eligibility than by maximizing CR biomass alone. The objectives of this study were to evaluate the effects of CR seeding rate on: (i) aboveground biomass production, residue C and N concentration, C:N ratio, and nutrient accumulation; (ii) soybean establishment, biological yield, grain yield, harvest index, and yield components; and (iii) net economic returns under contrasting conservation financial incentive scenarios.
Materials and methods
Site description
Two-phase field experiments were conducted during the 2022–2024 growing seasons at the Southern Illinois University Agronomy Research Center in Carbondale, IL. The first-year experiment (2022–2023) was conducted at 37.699472° N, 89.239639° W, and the second-year experiment (2023–2024) at 37.698222° N, 89.242917° W. The soil at both study sites was classified as a Stoy silt loam (fine-silty, mixed, superactive, mesic Fragiaquic Hapludalfs), a soil type common in southern Illinois soybean production systems.
Before trial initiation, composite soil samples (24 cores per trial) were collected from the 0 to 15 cm depth using a soil probe to characterize baseline soil chemical properties and to ensure that nutrient limitations did not confound treatment effects. Soil pH (1:1 soil:water), organic matter (loss on ignition at 360 °C), Bray-1 extractable P (Bray and Kurtz, Reference Bray and Kurtz1945), and Mehlich-3 extractable K (Mehlich, Reference Mehlich1984) were determined prior to CR establishment each year.
In the first year of the study (Field 1; 2022–2023), soil pH was 6.6, soil organic matter was 19 g kg−1, Bray-1 P was 43 mg kg−1, and Mehlich-3 K was 155 mg kg−1. In the second year (Field 2; 2023–2024), soil pH was 5.9, soil organic matter was 22 g kg−1, Bray-1 P was 24.5 mg kg−1, and Mehlich-3 K was 154 mg kg−1. Soil P and K were within recommended ranges for soybean production in southern Illinois in both fields, and lime (CaCO3) was applied at 3.36 Mg ha−1 to Field 2 before planting to bring the pH within the recommended range. The region has a humid-temperate climate, with a mean annual air temperature of 14.4 °C and a mean annual precipitation of 1,123 mm during the 2022–2024 study period. Historical and in-season weather data were obtained from the Illinois Climate Network (ICN) Carbondale station Water and Atmospheric Resources Monitoring Program (WARM), located at the Southern Illinois University Agronomy Research Center. Growing degree days (GDD) were calculated to characterize thermal conditions during the CR growing period and were included as environmental variables in multivariate analyses. The GDD were calculated as

where T max and T min are daily maximum and minimum air temperatures, respectively, and T base was set at 4 °C for CR (Mirsky et al., Reference Mirsky, Curran, Mortenseny, Ryany and Shumway2011). If the daily mean temperature was less than T base, GDD was set to zero. Weather conditions during the study are summarized in Table 1.
Average monthly temperature, cumulative monthly precipitation, and growing degree days (GDD) for cereal rye and soybean in 2 years of the study in Carbondale (ARC)

Table 1. Long description
The table is organized into two main sections: Rye and Soybean.
Header Columns:
1. Crop phase and Month.
2. Mean temperature in degrees Celsius for 2022-2023 and 2023-2024.
3. Cumulative monthly precipitation in millimeters for 2022-2023 and 2023-2024.
4. G G D (Growing Degree Days) for 2022-2023 and 2023-2024.
Rye Section (October to June):
- Mean temperatures range from -0.3 to 24 degrees Celsius.
- Precipitation peaks in March 2023 (220 mm) and May 2024 (222 mm).
- Total precipitation was 909 mm in 2022-2023 and 833 mm in 2023-2024.
- Total G G D was 1,796 in 2022-2023 and 1,765.7 in 2023-2024.
Soybean Section (June to October):
- Mean temperatures range from 13 to 25 degrees Celsius.
- Precipitation peaks in July 2022 (164 mm) and September 2023 (198 mm).
- Total precipitation was 453 mm in 2022-2023 and 424 mm in 2023-2024.
- Total G G D was 1,369.6 in 2022-2023 and 1,594.3 in 2023-2024.
Footnote: G G D is calculated as the average of daily maximum and minimum temperatures minus the base temperature (4 degrees Celsius for rye and 10 degrees Celsius for soybean).
* GDD were calculated as GDD = [(T max + T min)/2 − T base], where T max and T min are daily maximum and minimum air temperatures, respectively. Base temperatures (T base) were 4 °C for cereal rye and 10 °C for soybean. When the daily mean temperature was less than T base, GDD was set to zero.
Experimental design
The study was conducted over two growing seasons during 2022–2023 and 2023–2024 in two different fields. The two fields were located in close proximity within the Southern Illinois University Agronomy Research Center and had both been previously planted to corn, with a separate field used each year to maintain the planned corn–soybean rotation. Both fields were mapped as the same soil series but differed in baseline pH and Bray-1 P as explained in the site description section. Field 2 was limed before CR establishment to bring pH within the recommended range for soybean production; Bray-1 P was within the recommended range in both fields. Because year and field were not independently replicated in this design, year effects reported here represent the combined influence of growing-season weather and any residual field-level differences. The experiment was arranged in a randomized complete block design (RCBD) with four replications and five treatments. Treatments included a no-cover crop (NOCC) control and four CR seeding rates: 14, 28, 42, and 56 kg ha−1, corresponding to 25, 50, 75, and 100% of the full recommended rate for Illinois. Individual plots measured 3.1 × 12.2 m, with alleys maintained between plots to minimize treatment interference.
Cereal rye management
Seeding rates and establishment
Cereal rye was drill-seeded in 19-cm row spacing using a John Deere 450 series grain drill (John Deere, Moline, IL, USA) on 5 Nov 2022 for the 2022–2023 season and on 28 Oct 2023 for the 2023–2024 season. In both years, the CR cultivar used was Guardian. The 1,000-seed weight of CR was 24.35 g, equivalent to approximately 41,100 seeds kg−1. Based on this value, the 14, 28, 42, and 56 kg ha−1 seeding rates corresponded to approximately 58, 115, 173, and 230 seeds m−2, respectively. CR was terminated with glyphosate (0.87 kg a.e. ha−1) prior to soybean planting. Termination occurred on 26 June 2023 in the first year and on 4 June 2024 in the second year. The termination date used in this study was later than typical Illinois practice for full-season soybean by design, rather than by logistical constraints, and was held constant across all seeding rate treatments within each year. This design also reflects conditions under which wet spring weather can delay both CR termination and soybean planting in the Midwest; spring precipitation was considerable in both study years, although its timing differed (Table 1). Earlier in the season, lower-density stands can partly compensate for fewer plants through tillering (Boyd et al., Reference Boyd, Brennan, Smith and Yokota2009), reducing differences in biomass among seeding rates. Delaying termination into later spring substantially increases CR biomass accumulation (Marcos et al., Reference Marcos, Acharya, Parvej, Robertson and Licht2023). This produced a wider range of residue loads across seeding rates than an earlier, standard termination date would have permitted, and therefore, greater resolution for detecting seeding rate effects on biomass, N accumulation, and residue quality, the primary responses of interest in this study.
Biomass sampling and quality analysis
Immediately prior to termination, aboveground CR biomass was sampled using two quadrats per plot, each measuring 0.225 m2. Samples were oven-dried at 60 °C to constant weight and expressed on a kg ha−1 basis. The oven-dried samples were first ground to pass a 1-mm screen using a Wiley Mill, and then pulverized using a ball mill. The ground samples were placed into coin envelopes. Prior to tissue analysis, plant tissue samples were once again placed into a forced-air oven (60 °C) for 72 h to ensure plant tissue moisture was not a confounding factor. The oven-dried samples were then analyzed for N and C content using dry combustion (Flash 2000 Elemental Analyzer, Thermo Scientific, Cambridge, UK). This process is well explained in Weidhuner et al. (Reference Weidhuner, Afshar, Luo, Battaglia and Sadeghpour2019).
C and N accumulation (kg ha−1) were calculated by multiplying measured aboveground biomass by corresponding C or N concentrations. Residue C:N ratio was calculated on a mass basis from measured C and N concentrations.
Soybean management and measurements
A four-row John Deere 7200 (John Deere, Moline, IL, USA) planter was used for planting soybean cultivar AG40XF5 directly into terminated CR residue on 28 June 2023 and 7 June 2024. Soybean was planted 2 and 3 days after glyphosate application in 2023 and 2024, respectively, when CR had received a lethal glyphosate dose but had not yet reached complete visual senescence, consistent with the normal glyphosate translocation and kill timeline. A similarly short pre-plant termination interval (3 days before planting) has been used in previous CR seeding rate and termination timing research (Marcos et al., Reference Marcos, Acharya, Parvej, Robertson and Licht2023). Soybean was seeded at 395,000 seeds ha−1 in 76-cm row spacing using a no-till planter. Soybean was harvested on 17 Oct 2023 and 16 Oct 2024, respectively. No nitrogen fertilizer was applied to soybean plants. Fertility, weed control, and pest management practices were consistent across all treatments and followed Illinois Extension recommendations (Nafziger, Reference Nafziger and Nafziger2009).
Stand establishment
Soybean plant population was assessed at the R8 growth stage by counting all plants in the two center rows of each plot. Each row was 12 m in length, and total plant counts were converted to plants ha−1. Stand establishment ratio (%) was calculated as the proportion of established plants relative to the target planting population.
Biological yield, grain yield, yield components, and harvest index
At physiological maturity (R8), aboveground soybean biomass, including grain, was hand-harvested from two 1-m row segments sampled from the two center rows of each plot (1 m per row). Harvested biomass was oven-dried at 60 °C to constant weight and weighed to determine biological yield, which was expressed in kg ha−1. Yield components were determined from the same R8 harvest subsamples used for biological yield estimation, together with grain yield data. Components included seed number and total seed weight. Seed number (seeds m−2) was calculated by dividing grain yield by mean individual seed mass, and total seed weight (g m−2) was calculated from harvested grain weight and plot area. Harvest index (%) was calculated according to Orlowski et al. (Reference Orlowski, Haverkamp, Laurenz, Marburger, Wilson, Casteel, Conley, Naeve, Nafziger, Roozeboom, Ross, Thelen and Lee2016) as the ratio of grain yield (seed yield) to total above-ground biological yield (including stems, leaves, pods, and grain), expressed as a percentage:

Economic analysis
An economic analysis was conducted to evaluate the trade-offs between CR seeding rate, soybean yield response, and eligibility for conservation financial incentives. Net returns were calculated for each CR seeding rate under a no-cover scenario and four conservation incentive programs relevant to Illinois producers. These included the Environmental Quality Incentives Program (EQIP), Conservation Stewardship Program (CSP), the Regional Conservation Partnership Program (RCPP; I-COVER), and the Pandemic Cover Crop Program (PCCP).
The PCCP, a temporary USDA Risk Management Agency initiative implemented during the 2021–2022 crop years, was included for comparative and historical benchmarking purposes only, as the program is no longer active. Financial incentive programs were evaluated independently, and payment stacking was not assumed.
Soybean revenue was calculated using a representative cash market price of $10.30 bu−1 (equivalent to $0.378 kg−1), consistent with Illinois soybean prices reported by the USDA Agricultural Marketing Service (USDA AMS, 2025). Cover crop costs included CR seed, planting, and termination. CR seed cost was $0.64 kg−1, while drill-seeding ($33.11 ha−1) and termination ($37.07 ha−1) costs were held constant across seeding rates based on University of Illinois farmdoc machinery and termination cost estimates (Schnitkey, Coppess and Paulson, Reference Schnitkey, Coppess and Paulson2016; Swanson et al., Reference Swanson, Schnitkey, Coppess and Armstrong2018). Total cover crop cost for CR seeding rates greater than zero was calculated as

where
$ C(r) $
 is the total CR cover crop cost ($ ha−1) and
$ r $
 is the CR seeding rate (kg ha−1). The constant 70.18 represents the combined drill-seeding and termination costs ($ ha−1), whereas 0.64 is the CR seed cost ($ kg−1).
Net return ($ ha−1) was calculated as soybean revenue minus cover crop costs plus any applicable incentive payments. Incentive payments were applied only to CR seeding rates ≥34 kg ha−1, consistent with NRCS-aligned agronomically reasonable establishment guidelines. Lower seeding rates were treated as non-eligible scenarios (Midwest Cover Crops Council, 2025).
Incentive payment values used in the analysis were $184 ha−1 for EQIP, $212 ha−1 for RCPP/I-COVER, $20.40 ha−1 for CSP, and $12 ha−1 for PCCP, representing typical Illinois program payment levels during the study period (Illinois Department of Agriculture, 2025; USDA-NRCS, 2025a; , 2025b; USDA-RMA, 2022).
Soybean grain yield at the 34 kg ha−1 seeding rate was not directly measured because this rate was not included as a field treatment. The four experimental seeding rates (14, 28, 42, and 56 kg ha−1) were selected for the agronomic evaluation, whereas 34 kg ha−1 represents the minimum seeding rate required for eligibility under NRCS conservation financial incentive programs. Therefore, yield at this rate was estimated using the fitted quadratic regression model describing soybean yield response to CR seeding rate (y = −0.44x 2 + 12.06x + 3,291.30; R 2 = 0.96, RMSE = 96.29 kg ha−1). The estimated yield (3,193 kg ha−1) was used to maintain consistency between the agronomic results and the economic analysis.
Calculations and statistical analysis
All statistical analyses were conducted using SAS (version 9.4; SAS Institute, Cary, NC, USA, 2017). Data were analyzed using the PROC MIXED procedure. CR seeding rate, year, and their interactions were treated as fixed effects, and block was treated as a random effect. When the year × seeding rate interaction was not significant (p > 0.1), treatment means and regression relationships were evaluated across years. When significant, responses were analyzed and presented separately by year. Mean separations were conducted using Fisher’s protected least significant difference (LSD) test at α = 0.1.
Regression analyses were performed to describe relationships between CR seeding rates and measured response variables. Model selection was based on statistical significance (p value), coefficient of determination (R 2), and root mean square error (RMSE).
Principal component analysis (PCA) biplots were generated based on the correlations, and two principal components were chosen based on eigenvalues and scree plot outputs using JMP Pro (SAS Institute Inc., Cary, NC, USA). Variables included CR aboveground biomass, tissue C and N concentrations (C, N), C accumulation (Caccum), N uptake (Nuptake), and residue C:N ratio, together with planting date (PD), termination date (TD), growing degree days accumulated from planting to March (GDD1) and from March to termination (GDD2), and precipitation from planting to March (Preci1), from March to termination (Preci2), and from May to termination (Preci3).
Results
Cereal rye biomass and residue properties
Cereal rye aboveground biomass was influenced by year (p < 0.0001) and seeding rate (p = 0.0036), whereas the year × seeding rate interaction was not significant (p = 0.1395). Averaged across seeding rates, CR biomass was significantly greater in 2024 (12,206 kg ha−1) than in 2023 (8,135 kg ha−1), indicating strong interannual variability in growing conditions.
Averaged over the 2 years, CR biomass increased consistently with increasing seeding rate, ranging from 7,858 kg ha−1 at 14 kg ha−1 to 12,069 kg ha−1 at 56 kg ha−1 (Fig. 1A). Intermediate seeding rates produced biomass levels of 10,031 and 10,724 kg ha−1 at the 28 and 42 kg ha−1 rates, respectively. A strong linear relationship described the response between seeding rate and CR biomass (R 2 = 0.96; Table 2), with the fitted model (y = 95.18x + 6,839.10) indicating an increase of approximately 95 kg ha−1 of biomass for every 1 kg ha−1 increase in seeding rate.
Effects of cereal rye (CR) seeding rate on (A) aboveground biomass, (B) tissue nitrogen (N) concentration, (C) N uptake, (D) carbon (C) accumulation, and (E) residue C:N ratio at termination. Points represent treatment means ± standard error SE. Dashed lines represent fitted regression models for 2023 and dotted lines represent fitted regression models for 2024. Separate regressions are shown for 2023 and 2024 in panels (D) and (E).

Figure 1. Long description
A multi-panel figure with five line graphs labeled A through E. All graphs share a common x-axis at the bottom representing Seeding rate in k g h a super -1 with tick marks at 0, 14, 28, 42, and 56.
* Panel A: Rye biomass in k g h a super -1 on the y-axis from 0 to 15000. Data points show a linear increase from approximately 8000 to 12000. A dashed blue line represents the model y = 95.18x + 6839.10 with R super 2 = 0.96.
* Panel B: N in g k g super -1 on the y-axis from 0 to 20. Data points show a linear decrease from approximately 14 to 11. A dashed blue line represents the model y = -0.08x + 15.13 with R super 2 = 0.95.
* Panel C: N uptake in k g h a super -1 on the y-axis from 0 to 150. Data points show a slight quadratic curve peaking around 125. A dashed blue line represents the model y = -0.02x super 2 + 1.70x + 88.02 with R super 2 = 0.96.
* Panel D: C accumulation in k g h a super -1 on the y-axis from 0 to 8000. Two datasets are shown. 2023 (solid circles) shows a shallow linear increase (y = 18.42x + 2947.12, R super 2 = 0.51). 2024 (open triangles) shows a steeper linear increase (y = 65.79x + 3099.50, R super 2 = 0.99).
* Panel E: C:N ratio on the y-axis from 0 to 60. 2023 (solid circles) shows a nearly flat linear trend (y = 0.07x + 28.77, R super 2 = 0.81). 2024 (open triangles) shows a significant linear increase from 35 to 55 (y = 0.46x + 27.78, R super 2 = 0.99).
All data points include vertical S E error bars and lowercase or uppercase letters indicating statistical significance.
Regression models that describe the relationships between CR seeding rate and CR biomass, tissue N concentration, N uptake, C accumulation, and residue C:N ratio

Table 2. Long description
The table consists of five columns: Parameter, Model equation, R-squared, R M S E, and p-Value.
* C R biomass in kg ha sub -1: Model 95.18x + 6,839.10; R-squared 0.96; R M S E 446.50; p-Value 0.0001.
* N concentration in g kg sub -1: Model -0.08x + 15.13; R-squared 0.95; R M S E 0.37; p-Value 0.0001.
* N uptake in kg ha sub -1: Model -0.02x-squared + 1.70x + 88.02; R-squared 0.96; R M S E 5.27; p-Value 0.0001.
* C accumulation in kg ha sub -1 for 2023: Model 18.42x + 2,947.12; R-squared 0.51; R M S E 401.89; p-Value 0.1513.
* C accumulation in kg ha sub -1 for 2024: Model 65.79x + 3,099.50; R-squared 0.99; R M S E 129.90; p-Value 0.0001.
* C to N ratio for 2023: Model 0.07x + 28.77; R-squared 0.81; R M S E 0.77; p-Value 0.0001.
* C to N ratio for 2024: Model 0.46x + 27.78; R-squared 0.99; R M S E 0.99; p-Value 0.0001.
Footnotes indicate C R stands for cereal rye, N for nitrogen, C for carbon, and R M S E for root mean square error.
† CR, cereal rye; N, nitrogen; C, carbon. R 2, coefficient of determination; RMSE, root mean square error.
Cereal rye tissue N concentration was influenced by year (p < 0.0001) and seeding rate (p = 0.0035), whereas the year × seeding rate interaction was not significant (p = 0.2981). Across seeding rates, N concentration was significantly greater in 2023 (14.4 g kg−1) than in 2024 (10.4 g kg−1). When averaged across years, tissue N concentration linearly declined (R 2 = 0.95; Table 2) with increasing seeding rate, decreasing from 14.3 g kg−1 at 14 kg ha−1 to 10.9 g kg−1 at 56 kg ha−1 (Fig. 1B). For every kg ha−1 increase in seeding rate, tissue N concentration in CR declined by 0.08 g kg−1.
Cereal rye N uptake showed a quadratic response to increasing seeding rate (Fig. 1C). Across years, mean N uptake increased from 107 kg N ha−1 at 14 kg ha−1 to 121 kg N ha−1 at 42 kg ha−1 before slightly declining to 118 kg N ha−1 at 56 kg ha−1. This response was best described by a quadratic regression model (y = −0.02x 2 + 1.70x + 88.02; R 2 = 0.96; Table 2), indicating that N uptake increased with seeding rate up to an intermediate level and then leveled off at higher rates.
Cereal rye C accumulation showed a significant year × seeding rate interaction (p = 0.0851); therefore, responses were evaluated separately for each year (Fig. 1D). In 2023, C accumulation did not differ significantly among seeding rates, ranging from 2,985 kg C ha−1 at 14 kg ha−1 to 3,996 kg C ha−1 at 56 kg ha−1. Although the fitted linear regression indicated an increase of 18.4 kg C ha−1 for each 1 kg ha−1 increase in seeding rate, the relationship was relatively weak (R 2 = 0.51; Table 2). In contrast, C accumulation responded strongly to increasing seeding rate in 2024 (Table 2). Carbon accumulation increased significantly from 3,986 kg C ha−1 at 14 kg ha−1 to 6,690 kg C ha−1 at 56 kg ha−1, with the 14 kg ha−1 treatment producing significantly less C accumulation than the 42 and 56 kg ha−1 treatments. The relationship was highly linear (R 2 = 0.99; Table 2), with the fitted model indicating an increase of 65.8 kg C ha−1 for each 1 kg ha−1 increase in seeding rate. Across all seeding rates, mean C accumulation was greater in 2024 (5,402 kg C ha−1) than in 2023 (3,592 kg C ha−1), reflecting greater CR biomass production during 2024. These results indicate that environmental conditions influenced both the magnitude of C accumulation and the response to increasing seeding rate.
Residue C:N ratio showed a significant year × seeding rate interaction (p = 0.0043); therefore, responses were evaluated separately for each year (Fig. 1E). In 2023, the C:N ratio increased modestly with seeding rate, from 29.7 at 14 kg ha−1 to 33.1 at 56 kg ha−1. This relationship was described by a linear regression (R 2 = 0.81; Table 2), with the fitted model indicating an increase of 0.07 C:N units per 1 kg ha−1 increase in seeding rate. The response of C:N to seeding rate was substantially stronger in 2024 (Table 2). In 2024, C:N ratio increased from 33.9 at 14 kg ha−1 to 54.2 at 56 kg ha−1. A highly linear relationship was observed in 2024 (R 2 = 0.99; Table 2), with the fitted model indicating a 0.46-unit increase in C:N ratio per 1 kg ha−1 increase in seeding rate. Across all seeding rates, residue C:N ratios were consistently higher in 2024 than in 2023, as reflected by year means of 44.1 and 31.2, respectively. These results indicate that both seeding rate and environmental conditions strongly influenced CR residue quantity and quality at termination.
Soybean performance
Soybean grain and biological yield
Soybean grain yield was influenced by preceding CR seeding rate (p = 0.0738), and the year × seeding rate interaction was not significant (p = 0.9961). Grain yield was similar among the no-CR control (3,336 kg ha−1) and the 14 and 28 kg ha−1 CR seeding rates (3,266 and 3,338 kg ha−1, respectively) (Fig. 2A). Yield declined at higher CR seeding rates, decreasing to 3,061 kg ha−1 at 42 kg ha−1 and reaching its lowest value at 56 kg ha−1 (2,563 kg ha−1), representing a 23.2% reduction relative to the no-CR control. A quadratic regression best described the response (R 2 = 0.96; p = 0.0008; Table 3), indicating that soybean grain yield remained stable at low to moderate CR seeding rates but declined sharply at higher rates. Across years, soybean grain yield was greater in 2024 (3,328 kg ha−1) than in 2023 (2,897 kg ha−1) (p = 0.0304), although the response pattern to CR seeding rate was consistent between years.
Effects of cereal rye (CR) seeding rate on soybean (A) grain yield, (B) biological yield, (C) harvest index, (D) seed number, (E) established plant population, and (F) stand establishment ratio. Points represent treatment means ± SE (standard error). Dashed lines indicate fitted regression models.

Figure 2. Long description
A multi-panel figure containing six line graphs labeled A through F. All graphs share a common x-axis representing Seeding rate in k g ha super -1 with increments of 0, 14, 28, 42, and 56. Data points include vertical error bars representing S E.
* Panel A: Grain yield in k g ha super -1. Data shows a quadratic curve peaking near 14 to 28 k g ha super -1 before declining. Regression: y = -0.44x-squared plus 12.06x plus 3291.30, R-squared = 0.96.
* Panel B: Biological yield in k g ha super -1. Data shows a linear decrease from approximately 7000 to 6200. Regression: y = -11.22x plus 7004.80, R-squared = 0.70.
* Panel C: Harvest Index percentage. Data shows a slight quadratic increase then a decline at higher seeding rates. Regression: y = -0.006x-squared plus 0.24x plus 47.10, R-squared = 0.98.
* Panel D: Seed number per square meter. Data follows a quadratic curve similar to grain yield. Regression: y = -0.40x-squared plus 13.39x plus 2730.10, R-squared = 0.99.
* Panel E: Established plant population in 1000 plants ha super -1. Data shows a slight quadratic decline. Regression: y = 0.004x-squared minus 0.80x plus 284.40, R-squared = 0.99.
* Panel F: Stand establishment ratio percentage. Data shows a linear decrease from approximately 72 percent to 64 percent. Regression: y = -0.15x plus 71.56, R-squared = 0.99.
Regression models describing soybean yield and yield components as affected by preceding CR seeding rate

Table 3. Long description
A table with five columns: Parameter, Model equation, R super 2, R M S E, and p-Value.
* Grain yield (kg ha super -1): -0.44x super 2 + 12.06x + 3,291.30; R super 2 is 0.96; R M S E is 96.29; p-Value is 0.0008.
* Biological yield (kg ha super -1): -11.22x + 7,004.80; R super 2 is 0.70; R M S E is 188.14; p-Value is 0.0083.
* Harvest index (%): -0.006x super 2 + 0.24x + 47.10; R super 2 is 0.98; R M S E is 0.62; p-Value is 0.0001.
* Seed number m super -2: -0.40x super 2 + 13.39x + 2,730.10; R super 2 is 0.99; R M S E is 23.41; p-Value is 0.0001.
* Established (1,000 plants ha super -1): 0.004x super 2 - 0.80x + 284.40; R super 2 is 0.99; R M S E is 1.00; p-Value is 0.0062.
* Stand establishment ratio (%): -0.15x + 71.56; R super 2 is 0.99; R M S E is 0.45; p-Value is 0.0001.
Note: C R stands for cereal rye. R M S E stands for root mean square error.
Note: CR, cereal rye. R 2, coefficient of determination; RMSE, root mean square error.
Soybean biological yield was not significantly affected by CR seeding rate (p = 0.7106) (Fig. 2B). Biological yield ranged from 7,090 kg ha−1 in the no-CR control to 6,259 kg ha−1 at the highest CR seeding rate. However, regression analysis detected a modest negative linear trend (R 2 = 0.70; p = 0.0083; Table 3), indicating a decline in biological yield of approximately 11.2 kg ha−1 for each 1 kg ha−1 increase in CR seeding rate. Biological yield did not differ significantly between years.
Soybean harvest index and yield components
Soybean HI was significantly influenced by CR seeding rate (p < 0.0001) and by year (p = 0.0331), whereas the year × seeding rate interaction (p = 0.4539) was not significant. Harvest index was greatest at the 14 and 28 kg ha−1 CR seeding rates (49.38% and 49.35%, respectively) and declined progressively at higher seeding rates, reaching 41.00% at 56 kg ha−1 (Fig. 2C). The response was best described by a quadratic regression model (R 2 = 0.98; p = 0.0001; Table 3), indicating that allocation of biomass to grain decreased at higher CR seeding rates while remaining consistent across years.
Soybean seed number per m2 was significantly affected by CR seeding rate (p = 0.0959). Seed number was greatest in the no-CR control and the 14 and 28 kg ha−1 treatments (2,737–2,819 seeds m−2) and declined at higher CR seeding rates, reaching 2,240 seeds m−2 at 56 kg ha−1 (Fig. 2D). A strong quadratic relationship described this response (R 2 = 0.99; p = 0.0001; Table 3), indicating that reductions in seed number were the primary contributor to the decline in soybean grain yield observed at higher CR seeding rates.
Soybean establishment
Soybean establishment was affected by the CR seeding rate, with plant population declining as CR seeding rate increased (Fig. 2E). Plant population decreased from 284,600 plants ha−1 in the no-CR control to 251,200 plants ha−1 at the 56 kg ha−1 CR seeding rate. A quadratic regression described this response (R 2 = 0.99; p = 0.0062; Table 3), indicating a modest but consistent reduction in soybean establishment with increasing CR seeding rate.
Stand establishment ratio (%)
Similarly, soybean stand establishment ratio, averaged across both years, declined linearly with increasing CR seeding rate, decreasing from 72.0% in the no-CR control to 63.5% at the highest CR seeding rate (Fig. 2F). The fitted regression (R 2 = 0.99; p = 0.0001; Table 3) indicated a decline of approximately 0.15 percentage points in stand establishment ratio per 1 kg ha−1 increase in CR seeding rate. Despite statistical significance, reductions in soybean establishment were relatively small across treatments.
Principal component analysis
A PCA was conducted to evaluate multivariate relationships among CR biomass, residue chemical properties, nutrient accumulation, and environmental variables across seeding rates and years (Fig. 3). The first two principal components explained 87.5% of the total variation, with PC1 accounting for 72.1% and PC2 for 15.4%.
Principal component analysis (PCA) of cereal rye (CR) biomass, residue carbon (C) and nitrogen (N) dynamics, nutrient accumulation, and environmental variables across seeding rates and years. Variables included CR biomass (kg ha−1); tissue N concentration (N, g kg−1); N uptake (kg ha−1); tissue C concentration (C, g kg−1); C accumulation (Caccum, kg ha−1); residue C:N ratio; planting date (PD); termination date (TD); growing degree days from planting to March (GDD1) and from March to termination (GDD2); and precipitation from planting to March (Preci1), March to termination (Preci2), and May to termination (Preci3). PC1 (72.1% of variance) was negatively associated with biomass, C accumulation, N uptake, and residue C:N ratio. PC2 (15.4% of variance) captured year-specific environmental variation, driven primarily by planting and termination timing, GDD, and precipitation. Symbols represent years; colors represent the CR seeding rate (kg ha−1).

Figure 3. Long description
A principal component analysis biplot with Component 1 on the x-axis (72.1 percent variance) and Component 2 on the y-axis (15.4 percent variance). Red dashed lines intersect at the origin (0,0).
Vectors originate from the center:
• Northwest quadrant: Long vectors for N sub Uptake, Biomass, C sub accum, and C colon N ratio.
• Southwest quadrant: Vectors for Preci sub 2 and Preci sub 3.
• Southeast quadrant: Vectors for C and N.
• Northeast quadrant: A long vector for T D, with labels for P D, G D D sub 1, G D D sub 2, and Preci sub 1 clustered near it.
Data points are categorized by year and seeding rate:
• 2023 (open diamonds): Clustered primarily in the eastern half of the plot (positive Component 1 values).
• 2024 (solid triangles): Clustered primarily in the western half of the plot (negative Component 1 values).
• Seeding rates (14, 28, 42, and 56 kg ha super minus 1) are represented by lime green, cyan, purple, and red colors respectively, showing a distribution across both year clusters.
PC1 represented a gradient of CR growth, biomass accumulation, and residue development. Variables including biomass, C accumulation (Caccum), N uptake (Nuptake), and residue C:N ratio loaded strongly on the negative side of PC1, indicating that higher CR seeding rates clustered on the negative PC1 axis. These associations demonstrate that increasing seeding rate promoted greater biomass production, C and N accumulation, and increased residue C:N ratio. In contrast, lower seeding rates clustered toward the positive side of PC1.
PC2 represented variation driven largely by seasonal environmental factors. Variables such as planting date (PD), termination date (TD), growing degree days accumulated from planting to March (GDD1) and from March to termination (GDD2), and precipitation from planting to March (Preci1) loaded strongly on PC2, separating observations by year. Treatments from 2024 grouped together on the positive side of PC2, while 2023 samples clustered on the negative side, indicating that interannual differences in weather and management timing influenced residue composition independently of seeding rate.
Overall, the PCA demonstrates that CR seeding rate was the dominant driver of biomass, C and N accumulation, and residue C:N ratio (PC1), whereas environmental conditions influenced year-to-year variability in residue chemistry (PC2). The clear separation of high seeding-rate treatments along the negative PC1 axis reinforces the strong linear responses observed in univariate analyses.
Economic analysis
Soybean net returns varied across CR seeding rates and financial incentive scenarios (Table 4). Soybean production without a cover crop resulted in the highest net return ($1,262.54 ha−1) when incentive payments were not considered. Introducing CR without incentive payments reduced net returns at all seeding rates evaluated.
Soybean yield (kg ha−1), cover crop costs ($ ha−1), and net returns ($ ha−1) by cereal rye (CR) cover crop seeding rate (kg ha−1) evaluated under no financial incentive and four conservation incentive programs

Table 4. Long description
The table contains eight columns: C R seeding rate (k g ha super -1), Soybean yield (k g ha super -1), Cover-crop cost ($ ha super -1), and Net returns ($ ha super -1) for five scenarios: no incentive, P C C P, C S P, E Q I P, and R C P P.
* At 0 k g ha super -1 seeding rate: Yield is 3,336; Cost is 0.00; Net return is 1,262.54 across all programs.
* At 14 k g ha super -1 seeding rate: Yield is 3,266; Cost is 79.14; Net return is 1,156.91 across all programs.
* At 28 k g ha super -1 seeding rate: Yield is 3,338; Cost is 88.10; Net return is 1,175.32 across all programs.
* At 34 k g ha super -1 seeding rate (incentives begin): Yield is 3,193; Cost is 91.94. Net returns are 1,116.01 (no incentive), 1,128.01 (P C C P), 1,136.41 (C S P), 1,300.01 (E Q I P), and 1,328.01 (R C P P).
* At 42 k g ha super -1 seeding rate: Yield is 3,061; Cost is 97.06. Net returns are 1,061.41 (no incentive), 1,073.41 (P C C P), 1,081.81 (C S P), 1,245.41 (E Q I P), and 1,273.41 (R C P P).
* At 56 k g ha super -1 seeding rate: Yield is 2,563; Cost is 106.02. Net returns are 863.97 (no incentive), 875.97 (P C C P), 884.37 (C S P), 1,047.97 (E Q I P), and 1,075.97 (R C P P).
Yield generally decreases as seeding rate increases beyond 28 k g ha super -1, while costs increase linearly. E Q I P and R C P P provide the highest net returns for rates above 34 k g ha super -1.
Note: Incentive payments were applied only to CR seeding rates ≥34 (kg ha−1), consistent with agronomically reasonable establishment guidelines.
* Soybean yield at 34 kg ha−1 was estimated using the fitted quadratic regression model relating soybean yield to CR seeding rate.
† PCCP, Pandemic Cover Crop Program; CSP, Conservation Stewardship Program; EQIP, Environmental Quality Incentives Program; RCPP/I-COVER, Regional Conservation Partnership Program (Illinois Cover Crop Initiative).
Among non-incentivized CR treatments, the 28 kg ha−1 seeding rate produced the greatest net return ($1,175.32 ha−1), while net returns declined progressively at higher seeding rates, reaching $863.97 ha−1 at 56 kg ha−1. When financial incentive programs were applied to eligible seeding rates (≥34 kg ha−1), net returns increased substantially under EQIP and RCPP/I-COVER, with the highest net returns observed at 34 kg ha−1 ($1,300.01 and $1,328.01 ha−1, respectively). Net returns declined at seeding rates above this threshold despite continued financial incentive eligibility.
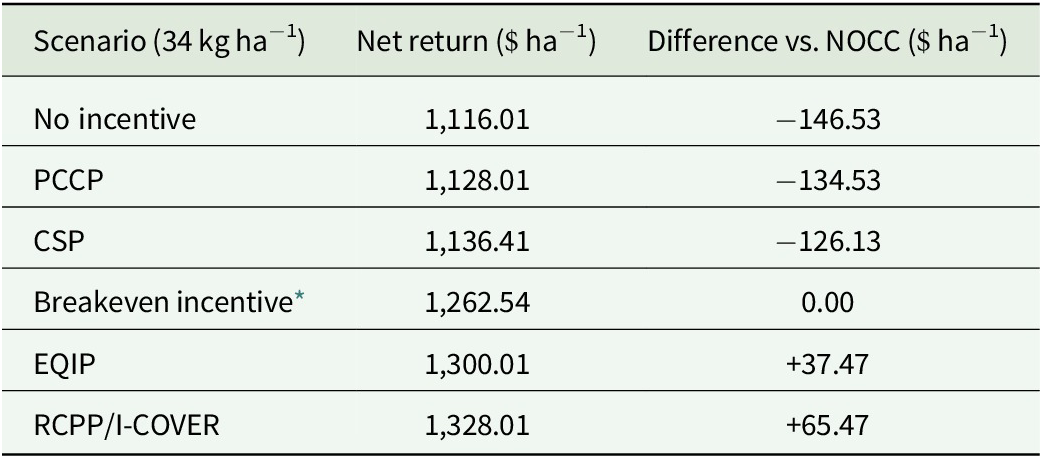
At the minimum financial incentive-eligible CR seeding rate (34 kg ha−1), net returns without incentives were $1,116.01 ha−1, which was $146.53 ha−1 lower than the NOCC scenario (Table 5). Net returns under PCCP and CSP remained below NOCC by $134.53 and $126.13 ha−1, respectively, whereas EQIP and RCPP/I-COVER exceeded NOCC net returns by $37.47 and $65.47 ha−1, respectively.
Breakeven financial incentive analysis for the minimum incentive-eligible cereal rye seeding rate (34 kg ha−1), showing net returns ($ ha−1) and differences relative to the no-cover crop (NOCC) scenario across conservation incentive programs

Table 5. Long description
The table consists of three columns: Scenario (34 kg ha super minus 1), Net return (dollars ha super minus 1), and Difference versus N O C C (dollars ha super minus 1).
* No incentive: Net return 1,116.01; Difference minus 146.53.
* P C C P: Net return 1,128.01; Difference minus 134.53.
* C S P: Net return 1,136.41; Difference minus 126.13.
* Breakeven incentive: Net return 1,262.54; Difference 0.00.
* E Q I P: Net return 1,300.01; Difference plus 37.47.
* R C P P / I-COVER: Net return 1,328.01; Difference plus 65.47.
A footnote indicates that the breakeven incentive represents the level required for the seeding rate to achieve net returns equivalent to the no-cover crop (N O C C) scenario.
* Breakeven incentive represents the incentive level required for the 34 kg ha−1 cereal rye seeding rate to achieve net returns equivalent to the no-cover crop (NOCC) scenario.
Discussion
Cereal rye aboveground biomass and quality
We hypothesized that increasing the seeding rate could result in increased CR biomass and C accumulation due to greater plant population and enhanced resource capture, and a decline in N concentration, likely due to biomass dilution under higher productivity, leading to relatively stable or plateauing N uptake but increased C:N ratio. Our results partially confirmed our hypotheses. Across both years, CR biomass increased linearly with seeding rate (Fig. 1A and Table 2). Similar responses have been reported in other CR studies, where increasing seeding rate increased spring biomass (Brockmueller et al., Reference Brockmueller, Sexton, Osborne and Chim2023), reflecting greater plant density and increased intra-specific competition for resources. These responses are consistent with density-driven growth patterns in CR, where increasing seeding rate enhances total biomass production but reduces tissue N concentration (Brennan, Boyd and Smith, Reference Brennan, Boyd and Smith2013; Baker et al., Reference Baker, Koduru, Babaei, Adeyemi, Williams, Armstrong, Margenot and Sadeghpour2024; Guzel et al., Reference Guzel, Guzel, Guzel, Brevik, Ola and Sadeghpour2026). In contrast to our results, Reed and Karsten (Reference Reed and Karsten2022) reported that increasing the CR seeding rate did not influence CR biomass.
Although tissue N concentration declined with increasing seeding rate (Fig. 1B and Table 2), total CR N uptake did not decline and instead showed a curvilinear response to seeding rate (Fig. 1C and Table 2). Nitrogen uptake increased across years, from 107 kg N ha−1 at 14 kg seed ha−1 to a maximum of 121 kg N ha−1 at 42 kg seed ha−1 before slightly declining at 56 kg seed ha−1. This response was driven by greater biomass production at higher planting densities, which compensated for the lower N concentration per unit biomass. Similar responses have been reported previously, where increasing CR seeding rate increased biomass production and total N uptake (Koehler-Cole and Elmore, Reference Koehler-Cole and Elmore2020). These results suggest that moderate to high seeding rates enhanced overall N capture during the fallow period, even as per-unit tissue N became more diluted. The stabilization of N uptake at the highest seeding rate suggests diminishing returns in N scavenging at very high plant densities. Increasing plant density can intensify intraspecific competition for limited growth resources, causing individual plant growth and resource acquisition to decline as density increases (Crawley, Reference Crawley, May and McLean2007). Consistent with this mechanism, increasing CR seeding rate has been shown not to increase biomass accumulation because of competition among plants (Reed and Karsten, Reference Reed and Karsten2022). Therefore, the plateau in N uptake observed at the highest seeding rate likely reflects density-dependent competition that limited further gains in resource capture. This finding supports the idea that intermediate seeding rates can effectively balance biomass production with efficient N capture rather than simply maximizing seeding rate for nutrient recovery.
Higher seeding rates produced residues with substantially greater C:N ratios, mainly driven by the decline in N concentration, suggesting that N drives C:N ratio in winter cereal production (Fig. 1B,E and Table 2) (Weidhuner et al., Reference Weidhuner, Afshar, Luo, Battaglia and Sadeghpour2019; Vaughn et al., Reference Vaughn, Adeyemi, Zandvakili, Hunter, Nair, Still and Sadeghpour2022). This pattern indicates that residue quality, not just quantity, is strongly regulated by seeding rate. The significant year × seeding rate interaction for residue C:N ratio further demonstrates that environmental conditions modulated the magnitude of this response (Fig. 1E and Table 2) (Brockmueller et al., Reference Brockmueller, Sexton, Osborne and Chim2023). In 2024, greater biomass production and lower tissue N concentration resulted in a steeper increase in C:N ratio across seeding rates, whereas in 2023, lower biomass and higher tissue N concentration moderated this effect (Fig. 1A,B,E and Table 2). These findings highlight that residue stoichiometry is jointly controlled by planting density and interannual weather conditions. Despite a longer pre-termination growing period in 2023 (26 June termination) than in 2024 (4 June termination), CR biomass was significantly lower in 2023. During the common March–May growth period, spring 2024 accumulated approximately 250 more GDDs than 2023 (1,133.4 vs. 880.9 GDD; Table 1). Although total March–May precipitation was similar between years (416 vs. 413 mm), its seasonal distribution differed substantially. In 2023, most spring rainfall occurred in March (220 mm), followed by relatively dry conditions in April and May (107 and 89 mm, respectively). In contrast, 2024 received less rainfall in March (54 mm) but substantially more in April and May (137 and 222 mm, respectively), coinciding with the period of most rapid CR growth. These warmer temperatures, greater GDD accumulation, and sustained late-spring moisture in 2024 likely promoted greater biomass accumulation despite the shorter growing period, whereas the cooler temperatures and relatively dry April–May conditions in 2023 likely constrained biomass production despite the longer interval before termination. These interannual differences have important implications for residue decomposition and short-term N cycling (Jahanzad et al., Reference Jahanzad, Barker, Hashemi, Eaton, Sadeghpour and Weis2016; Lacey et al., Reference Lacey, Nevins, Camberato, Kladivko, Sadeghpour and Armstrong2020).
As CR seeding rate increased, C accumulation increased strongly and linearly in 2024 but showed no significant response in 2023, reflecting the significant year × seeding rate interaction (Fig. 1D and Table 2). In contrast, total N uptake exhibited a quadratic response, plateauing at moderate to high seeding rates across years (Fig. 1C and Table 2). This pattern reflects the opposing effects of greater biomass production and declining tissue N concentration at higher plant densities. At low to intermediate seeding rates, increases in biomass outweighed reductions in tissue N, allowing total N uptake to rise; however, at the highest seeding rate, further biomass gains did not compensate for lower N concentration, possibly because increasing plant density intensified competition for limited soil N and reduced the efficiency of N capture, consistent with increased root competition and declining uptake efficiency at higher root densities (Postma, Dathe and Lynch, Reference Postma, Dathe and Lynch2014), resulting in stabilized N uptake (Fig. 1A– C and Table 2). Consequently, continued C inputs combined with plateauing N capture increased residue C:N ratios (Fig. 1D,E and Table 2). Elevated C:N residues likely slowed microbial decomposition and increased microbial N immobilization, temporarily reducing soil N availability during early soybean growth and delaying the release of residue-derived N to the subsequent crop (Kuo and Jellum, Reference Kuo and Jellum2002; Aher, Cihacek and Cooper, Reference Aher, Cihacek and Cooper2017).
Soybean growth, yield, and yield components following cereal rye
We hypothesized that increasing the seeding rate of CR could negatively influence soybean plant population, yield components, and thus, grain yield. Our results partially confirmed our hypotheses. Despite significant differences in CR biomass and residue chemistry, soybean vegetative growth was largely unaffected by CR seeding rate (Fig. 2B and Table 3). Soybean biological yield showed no significant treatment differences among seeding rates but showed a modest negative linear trend, indicating that total aboveground biomass production was generally resilient to variation in CR residue load. Soybean plant population and stand establishment ratio declined significantly with increasing CR seeding rate (Fig. 2E, F and Table 3); however, the magnitude of these reductions was relatively small and did not result in reduced soybean biological yield or grain yield at low to moderate seeding rates. This suggests that increased surface residue may have slightly impeded seed-soil contact or altered near-surface microclimatic conditions during emergence, but these effects were insufficient to severely limit stand establishment under the conditions of this study and may also have contributed to slightly cooler soil conditions and delayed early-season development under higher residue levels (Alghamdi and Cihacek, Reference Alghamdi and Cihacek2022). Soybean grain yield declined significantly at the highest CR seeding rate (56 kg ha−1), accompanied by reductions in seed number and HI (Fig. 2A,C,D and Table 3). The absence of a corresponding reduction in biological yield suggests that yield penalties may have been associated with reduced allocation of C to reproductive structures, potentially resulting from N-limitation and the metabolic cost of increased nodulation (Friel and Friesen, Reference Friel and Friesen2019). These results suggest a threshold response, whereby low to moderate CR seeding rates had little effect on soybean productivity, while higher residue loads increased the risk of yield loss. One possible explanation for this pattern is short-term nutrient limitation during reproductive stages associated with elevated residue C:N ratios (Fig. 1E and Table 2). High C:N residues can temporarily immobilize soil N, potentially reducing N availability during critical stages such as flowering and seed set. Although soil N dynamics were not directly measured during reproductive development in this study, the combination of increased residue C:N ratio, reduced HI, and lower seed number is consistent with this hypothesis. Although total CR N uptake increased at moderate seeding rates, this N may have remained immobilized within high C:N residue at the highest seeding rate, potentially delaying its release during soybean reproductive stages. In addition, reduced soil N availability may have increased soybean reliance on biological N fixation, an energetically demanding process that could reduce the assimilates available for grain filling and seed development (Tamagno et al., Reference Tamagno, Sadras, Haegele, Armstrong and Ciampitti2018).
The literature is inconsistent with regard to soybean grain yield response to a preceding CR cover crop. Reed and Karsten (Reference Reed and Karsten2022) evaluated multiple CR seeding rates and found no consistent soybean yield response across planting densities, with one location showing a reduction in soybean yield reflecting higher biomass due to late termination. However, overall, they indicated that CR effect on soybean yield is generally minimal. In a multi-site-year trial focusing on termination date, which leads to differences in biomass of CR with different C:N ratios, Silva et al. (Reference Silva, Mourtzinis, McMechan, Carmona, Potter, Tilmon, Hesler, Seiter, Wright, Osborne, Hunt and Conley2024) reported yield reduction in soybean in only 3 out of 28 site-years. Multivariate relationships among rye traits, environment, and soybean response.
The PCA provided a multivariate synthesis that reinforced patterns observed in the univariate analyses (Fig. 3). The first principal component represented a strong seeding-rate gradient, with CR biomass, C accumulation, N uptake, and residue C:N ratio loading strongly on the negative PC1 axis. CR biomass, C accumulation, and N uptake all loaded strongly in the same direction on PC1, indicating that increases in biomass with seeding rate were closely coupled with greater total nutrient capture rather than merely a dilution of tissue N. This indicates that the seeding rate was the dominant source of variation associated with CR growth and residue development across years. Treatments with higher seeding rates clustered consistently at the negative end of this axis, across years, demonstrating significant influence of planting density on CR biomass and residue quality. Our results are in line with those of Ryan et al. (Reference Ryan, Mirsky, Mortensen, Teasdale and Curran2011) who suggested that increased seeding rates lead to biomass accumulation and thus, greater C and N uptake.
The second principal component primarily reflected interannual environmental variation, separating observations by year and aligning with variables related to planting and termination timing, GDDs, and precipitation. This separation indicates that seasonal conditions influenced residue chemistry independent of seeding rate. Regression analysis indicated that soybean grain yield, HI, and seed number (Fig. 2A,C,D) all declined with increasing CR seeding rates. This suggests that soybean yield responses were mediated by residue-driven effects on reproductive allocation, likely reflecting increasing CR vigor and residue C:N ratio at higher seeding rates rather than by total vegetative biomass production alone. This agrees with Liebl et al. (Reference Liebl, Simmons, Wax and Stoller1992), who suggested that increased biomass of CR along with increased C:N resulted in decreased soybean yield in CR cropping systems.
Economic implications of cereal rye seeding rate and financial incentive eligibility
The economic analysis demonstrates that the profitability of CR adoption is highly sensitive to seeding rate and financial incentive eligibility. When no incentives were applied, CR cover cropping reduced net returns relative to the no-cover scenario, and lower seeding rates minimized economic losses by reducing seed costs, while also corresponding with greater soybean yields relative to the highest CR seeding rate treatments. When financial incentive programs were included, net returns were maximized at the minimum incentive-eligible seeding rate (34 kg ha−1), as shown in Table 4.
At this seeding rate, incentive payments offset cover crop establishment costs and compensate for modest reductions in soybean yield. Previous studies similarly report that cover crop establishment costs, particularly seed costs, are a primary barrier to adoption and often reduce short-term profitability without financial assistance (Bergtold et al., Reference Bergtold, Ramsey, Maddy and Williams2019). In contrast, higher seeding rates, while still eligible for incentives, resulted in lower net returns due to increased seed costs and greater soybean yield penalties. These results indicate that seeding CR above the minimum incentive-eligible threshold provides limited economic benefit under current payment structures and may increase financial risk for producers. Financial incentive programs have been shown to facilitate adoption by reducing economic risk and increasing cover-cropped areas among participating farmers (Chami et al., Reference Chami, Niles, Parry, Mirsky, Ackroyd and Ryan2023).
Breakeven analysis at the minimum financial incentive-eligible seeding rate further clarifies the influence of incentive structure on producer profitability (Table 5). At 34 kg ha−1, an incentive payment of approximately $146.53 ha−1 was required for net returns to match the NOCC scenario. Incentive payments under PCCP and CSP remained below this threshold and therefore did not fully offset the economic penalty associated with cover crop adoption. In contrast, EQIP and RCPP/I-COVER exceeded the breakeven requirement, resulting in net returns that surpassed NOCC profitability. These findings indicate that incentive eligibility alone does not ensure economic viability and emphasize the importance of aligning payment levels with both establishment costs and potential yield impacts to support economically sustainable adoption of CR cover cropping. Consistent with this, broader analyses indicate that financial incentives are often necessary for sustained adoption and are instrumental in farmer decisions to implement cover crops (Surdoval et al., Reference Surdoval, Jain, Blair, Wang and Blesh2024).
Management implications and study limitations
Our findings indicate that CR seeding rate is a critical management decision that influences residue quantity, residue quality, soybean performance, and farm profitability. Moderate seeding rates provided substantial biomass and C inputs without reducing soybean yield, whereas high seeding rates increased residue C:N ratio and reduced soybean reproductive allocation. When economic incentives were considered, the minimum incentive-eligible seeding rate emerged as the most favorable option for balancing soil protection and nutrient uptake benefits with soybean productivity. However, the incentive-eligible seeding rate (34 kg ha−1) was not directly evaluated as a field treatment in this study and was instead estimated through modeling, and therefore, future studies should include this rate as a measured treatment to directly quantify soybean yield, biomass production, and residue characteristics. Additionally, our results suggest that lower seeding rates (14 and 28 kg ha−1) may still provide agronomic benefits, indicating that current incentive thresholds may warrant re-evaluation depending on program goals.
A limitation of this study is the lack of direct measurements of soil N availability and immobilization during soybean reproductive stages. Soil N availability during the CR growing season is also an important determinant of CR N uptake, tissue N concentration, and residue C:N ratio but was not directly measured. Consequently, responses observed in this study may differ in production systems receiving regular manure applications or other substantial organic N inputs, where greater background soil N availability could alter CR N uptake, residue quality, and subsequent N release patterns relative to the non-manured system evaluated here. A further limitation is that a separate field was used in each year to maintain the corn–soybean rotation, so year and field were not independently replicated, and their effects cannot be statistically separated. Both fields were mapped as the same soil series with the same previous crop, and the large interannual differences in spring thermal accumulation and rainfall distribution (Table 1) provide a plausible mechanism for the observed year effects. A contribution of field-level differences, nevertheless, cannot be excluded. Additionally, weed suppression effects were not quantified, which may influence optimal seeding rate recommendations depending on management goals. Future research should integrate residue decomposition dynamics, soil N availability during both the CR and soybean growing seasons, and weed suppression across a broader range of environments to refine region-specific seeding rate recommendations for CR-soybean systems.
Conclusions
Cereal rye seeding rate influenced residue production, residue quality, soybean yield components, and profitability in a no-till soybean system. Moderate seeding rates (14–42 kg ha−1), including the minimum financial incentive-eligible rate (34 kg ha−1), produced substantial biomass and C inputs while maintaining lower residue C:N ratios than higher rates and avoiding the soybean yield reductions observed at 56 kg ha−1. Yield losses at the highest rate were primarily associated with reduced seed number and harvest index, indicating excessive residue levels rather than establishment effects limited soybean performance.
Economic analysis showed that net returns were greatest at the minimum incentive-eligible seeding rate, where incentive payments offset establishment costs without the yield penalties observed at higher rates. Seeding above this threshold provided little additional agronomic or economic benefit, suggesting that CR seeding rate is an effective management lever for balancing soil conservation benefits with crop productivity and profitability. Future work should directly measure soil N availability and residue decomposition across seeding rates to refine region-specific recommendations.
Acknowledgments
We would like to thank Randy Lange and Chris Vick for planting and maintaining the plots. We also thank Dr. Dennis Timlin (USDA-ARS; Adaptive Cropping Systems Laboratory) for his thoughtful review and constructive feedback on the original version of the manuscript which helped enhance the clarity and quality of this work.
Author contributions
Conceptualization: M.J., A.S.; Data curation: M.J., S.B.; Formal analysis: M.J.; Funding acquisition: E.B., A.S.; Investigation: M.J., S.B., J.N.; Methodology: M.J., A.S.; Supervision: E.B., A.S.; Writing—original draft: M.J.; Writing—review and editing: S.B., J.N., E.B., A.S.
Funding statement
This work was supported by the Illinois Nutrient Research and Education Council [award # NREC-2021-4-206150-303].
Competing interests
The authors have no competing interests to declare.



 Open access

