Introduction
Wood apple (Rutaceae) is an important medicinal and fruit tree. It is native to the Indian subcontinent. Commonly known as wood apple, it is also cultivated in Bangladesh, Indonesia, Malaysia and Pakistan for edible fruits and medicinal and aromatic uses (Orwa et al., Reference Orwa, Mutua, Kindt, Jamnadass and Simons2009). It is a semi-deciduous, slow-growing tree with spiny branchlets and greyish-white stem bark. The fruit, leaves, stem bark, seeds, root and flowers of wood apple contain several phytomolecules, including alkaloids, coumarin, flavonoids, lignans, phenolic acids, quinones, sterols, triterpenoids, volatile oils and gums (Sonawane et al., Reference Sonawane, Bagul, LeBlanc and Arya2016; Murthy and Dalawai, Reference Murthy and Dalawai2020; Chaudhari and Annapure, Reference Chaudhari and Annapure2021; Lamani et al., Reference Lamani, Anu-appaiah, Murthy and Dewir2021). Wood apple is known to have a wide range of therapeutic uses in the traditional medicine systems in south and southeast Asia (Lindsay et al., Reference Lindsay, Ewald, Samung, Apiwathnasorn and Nosten1998; Goldsberry et al., Reference Goldsberry, Dinner and Hanke2014; Dahanayake, Reference Dahanayake2015; Andrias et al., Reference Andrias, Fahmida and Adi2019; Kerkar et al., Reference Kerkar, Patil, Dabade and Sonawane2020). The fruit pulp is a tonic, anti-scorbutic, astringent and stimulant. The medicinal and nutritional properties of the wood apple pulp and powder have been explored to prepare a wide range of food products such as jams, jellies, fruit bars, juice, syrup and chutneys (Hemalatha and Parameshwari, Reference Hemalatha and Parameshwari2019). The leaf extracts of wood apple are reported to have anticancer (Krishnan et al., Reference Krishnan, Sebastian, Savarimuthu, Poovathumkal and Fleming2017), antiulcer (Muthulakshmi et al., Reference Muthulakshmi, Margret and Mohan2013), hepatoprotective (Sharma et al., Reference Sharma, Bodhankar and Thakurdesai2012), antidermatophytic (Singh and Vidyasagar, Reference Singh and Vidyasagar2015) and larvicidal properties (Banerjee et al., Reference Banerjee, Singha, Laskar and Chandra2011; Reegan et al., Reference Reegan, Gandhi, Paulraj, Balakrishna and Ignacimuthu2014). The fruit extracts have been shown to have potential wound healing, neuroprotective, antioxidant, antispermatogenic, antibiofilm and nootropic activities (Ponnuraj et al., Reference Ponnuraj, Jaganathan, Kanagarajan and Castro2015; Murthy and Dalawai, Reference Murthy and Dalawai2020; Mali et al., Reference Mali, Sutar, Dias and Devade2021). Recent studies have shown that the leaves, fruits and stem bark of wood apple are ideal media for green synthesis of silver, zinc, iron and tin nanoparticles with potential antibacterial and antitumor properties (Annavaram et al., Reference Annavaram, Posa, Uppara, Jorepalli and Somala2015; Chandra Sekhar et al., Reference Chandra Sekhar, Krishna Rao, Madhusudana Rao and Pradeep Kumar2016; Patil and Taranath, Reference Patil and Taranath2016, Reference Patil and Taranath2018; Pawar et al., Reference Pawar, Deshpande, Dagade, Waghmode and Nigam Joshi2016; Haque et al., Reference Haque, Hossain, Akanda, Haque and Naher2019; Veeraiyan et al., Reference Veeraiyan, Suresh Kumar, Gunasekaran and Deepa2019; Ma et al., Reference Ma, Zhao, Zhang, Wu and Yang2020).
Niloticin, psoralen, quercetin and stigmasterol are important bioactive molecules reported to occur in various aromatic and therapeutic plants, including wood apple. Niloticin (triterpeniod) is reported with larvicidal, pupicidal and mosquitocidal properties (Reegan et al., Reference Reegan, Gandhi, Paulraj, Balakrishna and Ignacimuthu2014). Psoralen is widely used to cure psoriasis, vitiligo and eczema, and is reported to have antiosteoporosis, antitumor, antiviral, antibacterial and antiinflammatory activities (Ren et al., Reference Ren, Song, Tan, Guo, Wang, Liu, Cao, Li and Peng2020). Quercetin is a polyphenolic flavonoid with potential antiinflammatory, antihypertensive, vasodilator, antiobesity, antihypercholesterolemic and antiatherosclerotic properties (David et al., Reference David, Arulmoli and Parasuraman2016). Stigmasterol (phytosterol) is known for antiosteoarthritic, antihypercholestrolemic, cytotoxicity, antitumor, hypoglycemic, antioxidant, antimutagenic and antiinflammatory effects (Kaur et al., Reference Kaur, Chaudhary, Akash and Kishore2011). Climate conditions such as cold, drought, oxidative stress, light, heat, etc., affect the concentration of plant secondary metabolites. The major effecting condition incorporates heat which is responsible for stresses in plants and ultimately regulates the metabolic response. In the case of wood apples, the favourable conditions are mean annual temperatures of 18–26°C and mean maximum temperature of hottest month, 28–38°C (https://www.cabidigitallibrary.org/doi/abs/10.1079/cabicompendium.30802). It is noteworthy that the majority of samples used in our study were collected in the same temperature range and not subjected to abiotic stress. There are no earlier reports on chemotypic diversity in wood apple leaves in India or elsewhere. Therefore, this study was conducted to determine the degree of genetic divergence and variability present in diverse accessions of wood apple from India, based on multivariate analysis of quantitative chemotypic traits with respect to niloticin, psoralen, quercetin and stigmasterol content in leaves. In this study, the genetic variability, hierarchical clustering, principal component analysis (PCA) and correlation analysis were estimated. Correlation analysis facilitates the identification of associations between various chemotypic traits. This is essential to comprehending the potential genetic, environmental or other links between traits. Further, the genetic diversity and chemotypic assessment of leaves of wood apple germplasm would help the identification of elite accessions for their proper deployment in genetic improvement and economic utilization. This study reports the first multivariate analysis of chemotypic diversity of leaves in a high-value medicinal, aromatic and nutritionally important wood apple fruit tree.
Materials and methods
Plant materials, chemicals and reagents
Fresh old leaves of wood apple (LA) were collected from 96 accessions from 16 states of India representing five phytogeographic regions (Deccan peninsula, Northeast, Gangetic plains, Semi-arid and Western Ghats) (online Supplementary Table S1). Maps were visualized in QGIS v 3.14.1 Pi (QGIS Development Team, 2020) (online Supplementary Fig. S1). Old leaves were cleaned with water to remove all the undesirable impurities and shade-dried at RT (room temperature) for 4–5 days at the collection site. The dried leaves were placed in small zip-lock bags containing 60–70 g of blue self-indicating silica gel to remove residual moisture. Fresh silica gel was added to bags if the silica gel turned from a dark violet-blue to pale blue and finally turned pale pinkish. After being brought to the lab, the dried leaf samples were stored in air-tight container for future use. The plant specimens were authenticated and taxonomically identified by Dr K.N. Nair, Council of Scientific and Industrial Research-National Botanical Research Institute (CSIR-NBRI), Lucknow (Uttar Pradesh). Representative voucher specimens were deposited in the herbarium of CSIR-National Botanical Research Institute (LWG), Lucknow, India. Analytical standards of quercetin, stigmasterol and psoralen were purchased from Sigma Aldrich (Steinheim, Germany), and niloticin from Chem Faces (Wuhan, China). HPTLC analytical grade solvents were obtained from Merck (Darmstadt, Germany).
Preparation of standard solutions
A standard stock solution of niloticin, psoralen, quercetin and stigmasterol was made separately by dissolving 1 mg/ml of each compound in methanol.
Extraction and sample preparation
Shade-dried leaf samples of wood apple accession (5 g each) were ground to make rough powder with the help of an electric grinder. Each accession was prepared in triplicate, with three replicates for each sample. Extraction was done by the Soxhlet extraction method with 250 ml of methanol. The methanolic extract was filtered over the Whatman no.1 filter papers, and collected in RB flasks. The solvent of each filtered extract was concentrated under a vacuum by rotary evaporation (Buchi Rotavapor-R2, Flawil, Switzerland) at 45°C. This process was repeated for powdered samples of every accession. All the filtrates were kept at 4°C for later use. Finally, 10 mg extract was diluted in 1 ml methanol to make the stock solutions, which were further applied in samples/spots in 10 μl concentration on the HPTLC plate.
Chromatographic conditions for chemical fingerprinting
Niloticin, psoralen, quercetin and stigmasterol were quantified using HPTLC method. Details of chromatographic conditions and instruments used in HPTLC are as follows: Spotting device: Linomat applicator; CAMAG (Muttenz, Switzerland) with 100 μl syringe. TLC chamber: CAMAG twin-trough chamber with steel lid for 20 × 10 cm plate. HPTLC Silica gel plate: 20 cm × 10 cm, coated with silica gel 60 F 254 (thick > 1.0 mm) on the aluminium sheet (MerckKGaA, Darmstadt Germany). Densitometer: CAMAG TLC Scanner 3 and WinCATS software V.4.06. Experimental conditions: room temperature; relative humidity. Solvent systems: niloticin and psoralen [ethyl acetate, toluene, formic acid and methanol (5:2:1:0.2 v/v)], quercetin and stigmasterol [ethyl acetate, toluene, formic acid and methanol (5.5:3:1:0.5 v/v)]. Before chromatography, the plates were prewashed with methanol and activated for 5 min at 60°C. For the development of HPTLC plates, the solvent system (mobile phase) was prepared and saturated for 20 min in HPTLC development chamber before placing the plates inside. After that sample application was done and the band size of each extract was 6 mm, slit dimension-4.00 × 0.30 mm. Number of tracks on each plate were 18. After development, the plate was dried by blow dryer and then the derivatization process was performed with the help of Camag derivatizer by spraying 10% sulfuric acid in distilled water on the plates and heated at 110°C for 6 min. For visualization, detection wavelength was 386 nm for quercetin, psoralen and 299 nm for stigmasterol and niloticin. Scanning rate was 20 mm/s, and the radiation source was a deuterium lamp and densitometric evaluation. The densitogram of standards and methanolic extract of leaves of wood apple is given in Fig. 1. The concentration of niloticin, psoralen, quercetin and stigmasterol for each sample was calculated using the respective calibration curve. The data of the peak area of different volumes of standard solutions were plotted against the corresponding concentration, and linearity (R 2) was determined by regression analysis of the calibration graphs. The regression equations were y = 423.194 + 6.885x (r 2 = 0.99965) for niloticin, y = 2327.391 + 2.611x (r 2 = 0.99914) for psoralen, y = 2668.292 + 15.533x (r 2 = 0.99576) for quercetin and y = 478.551 + 6.74x (r 2 = 0.99928) for stigmasterol. The mean value of three replicates for the absolute quantification results of each compound is given in online Supplementary Table S2.
Densitogram of A, C, E, G standard niloticin, psoralen, quercetin and stigmasterol (B, D, F, H) methanolic extract of wood apple.

Statistical analysis
Mean value of each replication was statistically analysed the variance by using WINDOSTAT software (www.indostat.org) according to Panse and Sukhatme (Reference Panse and Sukhatme1985). The genotypic, phenotypic and environmental coefficient of variation (GCV, PCV and ECV) and their variances (δ 2g, δ 2p and δ 2e) were calculated according to Singh (Reference Singh1985). Broad sense heritability (h2 B) was assessed on the genetic means basis as per Allard (Reference Allard1999). Expected genetic advance (%) and genotypic and phenotypic correlation (rp) of mean were estimated as described by Johnson et al. (Reference Johnson, Robinson and Comstock1955). Ward's minimum variance method was used for hierarchical clustering to identify the pattern of similarity and dissimilarity amongst accessions (Rao, Reference Rao1952). The relationship among clusters was estimated by assessing the inter-cluster distance based on Mahalanobis distance (D 2) statistics (Mahalanobis, Reference Mahalanobis1936). Correlation matrices were used in PCA to identify the proportion of variance between the accessions (Sneath and Sokal, Reference Sneath and Sokal1973). PCA biplot analysis was done by using R statistical software version 3.2.0 (Kabacoff, Reference Kabacoff2012) (http://www.r-project.org/).
Results
Chemotypes variation and genetic variability
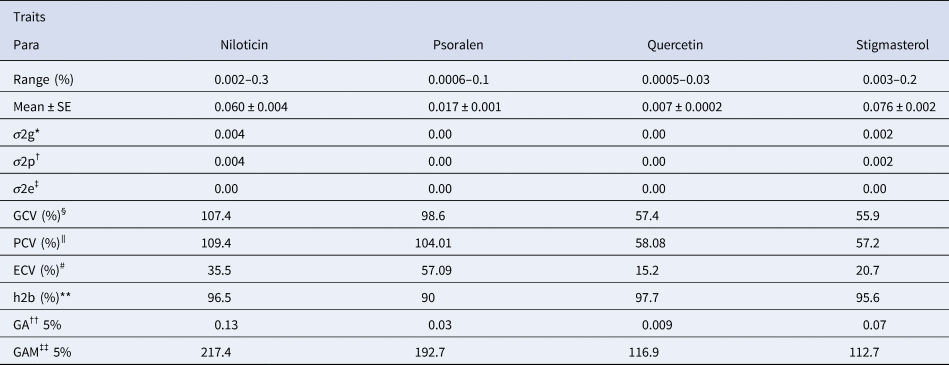
The range and mean of different quantitative characters are shown in Table 1. The present study showed significant quantitative variations in niloticin, psoralen, quercetin and stigmasterol in the leaves of wood apple. The graphical representation of the results is presented in Fig. 2, which clearly shows the differences among bioactive compounds due to different geographical locations and altitudes (online Supplementary Table S2).
Estimates of variance components, broad sense heritability and genetic advance in wood apple

* Genotypic variance.
† Phenotypic variance.
‡ Environmental variance.
§ Genotypic coefficient of variability.
∥ Phenotypic coefficient of variability.
# Environmental coefficient of variability.
** Broad sense heritability.
†† Genetic advance.
‡‡ Genetic advance as percent of mean.
Graphical representation of geographical variation of (a) niloticin, (b) psoralen, (c) quercetin and (d) stigmasterol analytes.

The phenotypic, genotypic and environmental coefficient of variation, broad sense heritability and genetic advance for all the quantitative traits are shown in Table 1. PCV was found to be higher compared to the corresponding GCV and ECV for all chemotypic traits.
Hierarchical clustering of accessions
All the 96 accessions were divided into eight major clusters using the hierarchical clustering method (Fig. 3 and online Supplementary Table S3). Cluster II was found to be the largest with 20 accessions from nine states of India, namely Uttar Pradesh (2), Delhi (3), Karnataka (4), Gujarat (3), Maharashtra (3), Madhya Pradesh (2), Haryana (1), Tamil Nadu (1) and West Bengal (1). Cluster VIII was the smallest with three accessions from two states, namely Tamil Nadu (1) and Kerala (2). Intra and inter-cluster distance among different cluster is given in online Supplementary Table S4. Highest inter-cluster distance was observed between clusters V and VII (22.52), followed by clusters III and VII (21.74). In contrast, the lowest inter-cluster distance was found between clusters III and V (5.53), followed by clusters IV and VI (6.37). Highest intra-cluster distance was found within cluster I (6.83), whereas lowest intra-cluster distance (0.00) was found in rest of the clusters. Mean performances of all chemotypic traits in different clusters are given in Table 2. Cluster VIII showed the highest value for niloticin (0.34%) and psoralen (0.08%). Cluster VII had accessions with highest quercetin (0.03%) and cluster IV with the highest value for stigmasterol (0.16%). The other clusters exhibited content values in medium to low range for all the four target molecules.
Dendrogram of 96 wood apple germplasm derived from the Ward's minimum variance cluster analysis using Mahalanobis distances.

Cluster mean value of different quantitative traits in wood apple

Principal component analysis
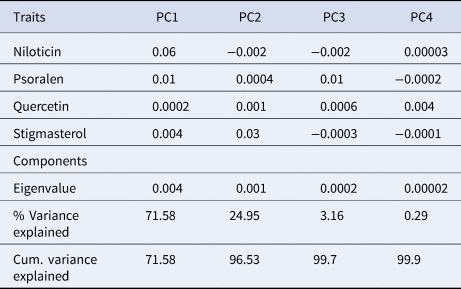
PCA was performed by taking all the quantitative traits simultaneously in order to evaluate the forms of variables (Table 3). It represented over 99.9% of total variation (online Supplementary Fig. S2). In PC1 (first principal component), the total variation was 71.58%, which was found positively associated with psoralen and niloticin. Thus, PC1 assorted the accessions with highest niloticin and moderate psoralen content. PC2 accounted for 24.95% of the total variation, and it showed positive correlation with stigmasterol and quercetin, but negatively with niloticin. In PC3, the overall variation was 3.16%, showing positive associations with psoralen and quercetin, but with a negative association with stigmasterol and niloticin. Subsequently, a PCA-biplot was generated employing the first two principal components which explained 72.2% of the total variability, it showed large variability among the genotypes and chemotypic traits. The accessions LA 16, LA 17, LA 86, LA 22, LA22, LA83, LA6, LA85, LA88, LA55, LA46, LA94, LA11, LA5, LA7, LA14, LA23, LA75, LA80 and LA89 were similar in their performance and showed close proximity with chemotypic trait quercetin and stigmasterol. Whereas accessions LA91, LA19, LA77, LA90, LA21, LA10, LA96, LA53, LA68, LA54, LA9, LA95, LA43, LA81, LA76, LA52, LA20 and LA12 were similar in performance and showed close proximity with psoralen and niloticin (online Supplementary Fig. S3).
Loadings of the first four principal components of genetic divergence in 96 accessions of wood apple

Trait association
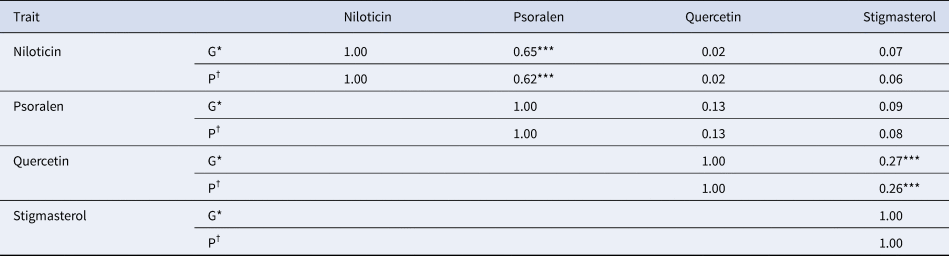
Genotypic correlation coefficient and phenotypic correlation coefficient analysis was done to understand the genetic relationship among the various quantitative traits (Table 4). All the chemotypic traits were positively correlated with each other's at the genotypic and phenotypic levels. However, the genotypic correlation coefficient was higher for most of the chemotypic traits than the corresponding phenotypic correlation coefficient. A very strong and positive correlation was found between psoralen and niloticin (0.65), and quercetin and stigmasterol (0.27).
Estimates of genotypic and phenotypic correlation coefficients among various traits determined in 96 accessions of wood apple

* Genotypic correlation coefficient of variability.
† Phenotypic correlation coefficient.
*** Significant at 0.001.
Discussion
Secondary metabolites, produced from plants, are quantitative traits controlled by biotic and abiotic environmental conditions, and show wide geographic variation (Zhao et al., Reference Zhao, Dong, Tu, Song, Lo and Tsim2003; Xia et al., Reference Xia, Zhao, Huang, Zhang, Dong, Li and Tsim2005; Dinchev et al., Reference Dinchev, Janda, Evstatieva, Oleszek, Aslani and Kostova2008; Li et al., Reference Li, Dong, Jiang, Gao, Jiang, Cheung, Duan, Dong, Tu and Tsim2007; Han et al., Reference Han, Hu, Zhou, Li, Zhang, Zhang, Huang, Rahman, Zheng and Qin2008; Chen et al., Reference Chen, Li, Maiwulanjiang, Zhang, Zhan, Lam, Zhu, Yao, Choi, Lau, Dong and Tsim2013; Xu et al., Reference Xu, Li, Yuan, Zhang, Lu, Huang and Wang2013). Wood apple trees thrive in arid environments and are not impacted by any significant pests or diseases because of their resistance to biotic and abiotic stress (Kumar and Deen, Reference Kumar and Deen2017). Genetic variation in the available germplasms is the crucial requirement for selecting parental lines for effective plant breeding programmes to develop new varieties with desired characters (Singh et al., Reference Singh, Kaur and Singh2008). In addition to identifying new breeds and improving their genetic stock, multivariate analysis gives several other information that can be used for conserving the germplasm, individuals, populations and varieties (Duran et al., Reference Duran, Appleby, Edwards and Batley2009). The level of genetic variability of plant genetic material offers the plant breeders to develop a new variety with desired characters. Characterization of genetic resources based on chemotypic variation is a key step to identify elite genotypes and chemotypes for further evaluation for genetic improvement and economic utilization.
This study was carried out to characterize 96 accessions of wood apple leaves collected from 16 different states of India based on chemotypic traits. This was a preliminary analysis. Although the results provide initial insights, which give a foundation for future studies. Wood apple tree is resistant to biotic and abiotic stress. This resilience offers compelling evidence that the content of secondary metabolites may remain relatively stable. Further investigation is essential and aims to explore in greater depth to validate and expand upon these initial results. The quantitative analysis showed major differences between the accessions for all the evaluated chemotypic traits. Niloticin was quantified for the first time by HPTLC. It has potent larvicidal and pupicidal activities, and it could be used as a potential natural mosquitocidal and as substitute of chemical mosquitocidal agents. In this study, the highest psoralen content was found in LA19 (0.09) from Madhya Pradesh which is significantly higher than those reported in the previous study. For instance, Dhalwal et al. (Reference Dhalwal, Shinde, Mahadik and Namdeo2007) reported considerably lower percentage of psoralen content in the fruits of Aegle marmelos (L.) Correa (0.0047%), Trachyspermum ammi (L.) Sprague (0.008%) and Foeniculam vulgare Mill. (and 0.0035%) by using HPTLC. Verma et al. (Reference Verma, Gupta, Ramana and Rawat2016) quantified quercetin content (0.14%) from a single accession of wood apple (fruit) by HPTLC. Similarly, in a previous study, Kamboj and Saluja (Reference Kamboj and Saluja2017) reported 0.11% stigmasterol content in leaves of a single accession of Bryophyllum pinnatum (Lam.) by HPTLC. All the bioactive molecules indicate a substantial increase in our study. These differences could be explained by several factors, the observed variations may potentially be explained by the seasonal timing of the sample collection and the geographical origin of the samples since environmental factors (climate, soil composition, altitude) are known to affect the biosynthesis of bioactive molecules in plants.
All the elite chemotypes identified from this study can be used for direct cultivation as quality raw material, and also for breeding material for enhanced bioactive molecules and other desirable traits.
The PCV was greater than the corresponding GCV, indicating a slight effect of environmental factors on chemotypic trait. GCV offers evidence for genetic variability with respect to quantitative traits. However, based only on the genotypic coefficient of variation, it is impossible to determine the quantity of heritable variations. It is evidence that genotype selections based on phenotypic performance can be made successfully (Johnson et al., Reference Johnson, Robinson and Comstock1955). In order to accurately determine the heredity part of total genetic variants, estimates of genetic variability must be paired with estimations of heritability. Estimates of heritability in addition to variability can offer more perception on the quantity of genetic advances that can be anticipated as a result of selection. The heritability of a character is significant as it reveals the possibilities and degree of which improvements can be achieved during the selection (Robinson et al., Reference Robinson, Comstock and Harvey1949). The traits with heritability greater than 70% are considered appropriate for selection in breeding programme (Dabholkar, Reference Dabholkar1992). On the other hand, heritability estimations may differ largely for the same crop and trait (Temesgen et al., Reference Temesgen, Mebeaselassie and Million2013), as heritability is always related to a specific population and experimental setups (Holland et al., Reference Holland, Nyqueist and Cervantes Martinez2002). In this study, heritability was greater than 70% for all the chemotypic traits. The high heritability for the chemotypic traits suggests that they were genotypically controlled. High heritability alone is insufficient for efficient selection in next generation unless it is combined with a significant quantity of genetic advance (GA), which offers information on the level of gain in characters achieved under a specific selection pressure (Johnson et al., Reference Johnson, Robinson and Comstock1955). GA as percent of mean varied from 112.7 for stigmasterol to 217.4 for niloticin. A trait may be governed by additive gene action, according to higher heritability, GA and GCV for psoralen and niloticin. High heritability with low GA for quercetin implies that this trait may be mainly regulated by non-additive gene action. Therefore, selection cannot lead to significant improvement.
Further, the clustering revealed that the segregation of 96 accessions of wood apple leaves was independent of their geographical affiliations. Accessions that were collected from the same geographic region were grouped into distinct clusters, whereas accessions from different geographic regions were grouped into the same cluster. Prakash and Vijay (Reference Prakash and Vijay2017) also reported a similar pattern of non-congruence of genetic diversity and geographical origin in Solanum lycopersicum L. Hierarchical clustering study outcomes are impacted by the number of accessions and their distribution throughout states. In inconsistent sampling, the resolution of clusters at finer levels (e.g. within state variations) can be compromised. This may make it difficult to see significant genetic substructures within certain states or areas, thereby omitting significant patterns of diversity. In this study, the number of accessions per cluster varied from 5.20% (cluster IV) to 20.83% (cluster II). Cluster II contained 20 germplasms from nine states of India, i.e. Madhya Pradesh (2), Uttar Pradesh (2), Gujarat (3), Maharashtra (3), West Bengal (1), Tamil Nadu (1), Delhi (3), Karnataka (4) and Haryana (1), while cluster VIII consisted of only three accessions, two from Kerala and one from Tamil Nadu. The substantial genetic variance among the accessions from clusters I and VIII makes them suitable for a variety of hybridization and selection programmes. In general, it was assumed that crosses involving parents from divergent clusters would exhibit the largest heterosis and the widest ranges of genetic variation. Further, the cluster distance values support the cluster variances, where the greatest genetic distances were observed among clusters V and VII, and in clusters III and VII, which indicated a wide range of genetic variation among accessions. The accessions grouped in these clusters can be employed in inter-breeding programmes to obtain desired transgressive segregants in their progeny, because there is a greater possibility that dissimilar accessions may contain distinct desired alleles at different loci.
Correlation analysis is another criterion to setup proper breeding and selection strategies for genetic improvements. The extent of the genotypic correlation coefficient was high than the phenotypic correlation coefficient for all the chemotypic traits which showed that the genetic influence over the association among these characters reveals the predominance of genetic variance in character expression. It also could be explained by low environmental effect (Falconer, Reference Falconer1989). PCA biplot analysis showed the distinct contribution of different chemotypic traits in overall variation. Furthermore, it clarified the interrelationship between the chemotypic traits and accessions contributing to plant yield exhibiting high diversity within the accessions. This study would prove beneficial to the establishment of quality standards for the overall assessment of wood apple leaves.
Conclusion
This is the first report on HPTLC-based fingerprinting of 96 accessions of wood apple leaves. This study revealed significant genetic variability among the wood apple accessions. The quantitative results showed significant difference in niloticin, psoralen, quercetin and stigmasterol content among accessions sampled from different geographical regions. The study identified three wood apple accessions leaves with higher niloticin (LA89, LA77 and LA91), four accessions with higher psoralen (LA19, LA88, LA89 and LA5), five accessions with higher quercetin (LA17, LA86, LA15, LA16 and LA89) and four accessions with high stigmasterol content (LA85, LA16, LA26 and LA80). Some state-specific excellent accessions have also been identified to have higher concentrations of each bioactive component. In Maharashtra, accessions LA51, LA53, LA54 and LA55 exhibited the highest concentration of niloticin. Uttar Pradesh accessions, LA10, LA11, LA19 and LA21 had high psoralen, and LA5, LA6, LA15, LA16, LA17 had highest quercetin. In West Bengal, LA82, LA83, LA85, LA86 contained highest stigmasterol. Notably, five accessions, i.e. LA 86, LA 88, LA 89, LA 22 and LA 51 demonstrated a superior phytochemical profile, containing all these bioactive molecules in higher to moderate concentrations.
The biplot makes it easier to visually assess ‘which wins where’ patterns, which is helpful for identifying mega-environments and recommending cultivars. PCA biplot analysis explained that the accessions LA 16, LA 17, LA 86, LA 22, LA22, LA83, LA6, LA85, LA88, LA55, LA46, LA94, LA11, LA5, LA7, LA14, LA23, LA75, LA80, LA89, LA91, LA19, LA77, LA90, LA21, LA10, LA96, LA53, LA68, LA54, LA9, LA95, LA43, LA81, LA76, LA52, LA20 and LA12 were closely related with the plant chemotypic traits leading to significant impact on yield. These potential accessions can be utilized in different hybridization programmes. This chemotypic diversity highlights the possibilities for the selection of elite accessions with consistent and potent phytochemical profiling, which can improve the quality and effectiveness of medicinal products. The elite chemotypes can also be used as quality raw material in different herbal formulations.
Supplementary material
The supplementary material for this article can be found at https://doi.org/10.1017/S1479262124000650.
Acknowledgements
The authors are grateful to the Director of CSIR-National Botanical Research Institute (CSIRNBRI), Lucknow for providing the necessary facilities to conduct this work; and to Heads of University of Agricultural Sciences (Gandhi Krishi Vignan Kendra), Bangalore, (Karnataka), Deendayal Research Institute, Chitrakoot, Madhya Pradesh, Indira Gandhi Krishi Vishwa Vidyalaya, Raipur, Chhattisgarh and Botany Department, Gujarat University, Ahmedabad, Gujarat for their help and support during plant collection. A. L. is grateful to the University Grants Commission [UGC-National Fellowship (F1-17.1/2013-14/RGNF-2013-14-SC-UTT-52795)] for the award of a fellowship to perform her research work. This manuscript has an institutional communication number: ‘CSIR-NBRI-MS/2022/10/04’.
Author contributions
A. L., A. K. and J. C. performed the experiments and A. L. prepared the manuscript and analysed the data; M. P. and N. K. N. helped in critical revision and final approval of the manuscript; N. K. N., H. K. Y. and M. P. formulated the original research plans, supervised the research and revised and finalized the manuscript. All authors have read and approved the manuscript.
Funding statement
This work was supported by the financial support from the University Grants Commission-National Fellowship (F1-17.1/2013-14/RGNF-2013-14-SC-UTT-52795) to the first author (A. L.).
Competing interests
None.