


Introduction
From an astrobiology perspective, adenine (Fig. 1) is a purine, one of the nucleic acid bases of the deoxyribonucleic acid/ribonucleic acid, and is an important biomolecule; its abiotic synthesis has been demonstrated under prebiotic chemistry conditions (Oró and Kimball, Reference Oró and Kimball1961; Basile et al., Reference Basile, Lazcano and Oró1984; Vergne et al., Reference Vergne, Dumas, Décout and Maurel2000; Saladino et al., Reference Saladino, Crestini, Costanzo, Negri and Di Mauro2001; Roy et al., Reference Roy, Najafian and Schleyer2007; Cleaves, Reference Cleaves and Menor-Salván2018). In addition, adenine has been found in meteorites (Hayatsu et al., Reference Hayatsu, Studier, Moore and Anders1975; Martins et al., Reference Martins, Botta, Fogel, Sephton, Glavin, Watson, Dworkin, Schwartz and Ehrenfreund2009; Cleaves, Reference Cleaves and Menor-Salván2018). Thus, it is plausible to suppose that adenine was present in the prebiotic Earth.
Molecular structure of adenine.

In the prebiotic Earth, several energy sources existed such as: UV-radiation, heating from hydrothermal vents or impact meteors or volcanic activity, electric discharge, cosmic rays and radioactivity (Kobayashi et al., Reference Kobayashi, Masuda, Ushio, Ohashi, Yamanashi, Kaneko, Takahashi, Hashimoto and Saito2001). γ-Radiation resulted from the radioactive decay effect from certain radioisotopes (40K, 232Th, 235U, 238U and 244Po); this radiation is classified as ionizing radiation because of its high energy, capable of ionizing (Allen, Reference Allen1961). To simulate the effects of γ-radiation on prebiotic chemistry experiments, 40K and 60Co are used as sources (Negrón-Mendoza et al., Reference Negrón-Mendoza, Ramos-Bernal, Colín-García and Heredia2016 ). Since ionizing radiation and adenine existed in the prebiotic Earth, the interaction between them is an important issue for prebiotic chemistry.
It should be noted that the majority of prebiotic chemistry experiments are performed in distilled water or NaCl solutions (Zaia, Reference Zaia2012). Naturally, neither NaCl solutions nor distilled water are representative of the complex seas of the primitive Earth. Based on the work of Izawa et al. (Reference Izawa, Nesbit, MacRae and Hoffman2010), who performed an experiment through leaching of meteorite samples in Tagish Lake, Zaia (Reference Zaia2012) suggested a model of artificial seawater. For several years our group has been working with this artificial seawater model, which probably better resembles the major ions of the ocean of the prebiotic Earth (Anizelli et al., Reference Anizelli, Baú, Nabeshima, da Costa, de Santana and Zaia2014, Reference Anizelli, Baú, Gomes, da Costa, Carneiro, Zaia and Zaia2015, Reference Anizelli, Baú, Valezi, Canton, Carneiro, di Mauro, da Costa, Galante, Braga, Rodrigues, Coronas, Casado-Coterillo, Zaia and Zaia2016; Canhisares-Filho et al., Reference Canhisares-Filho, Carneiro, de Santana, Urbano, da Costa, Zaia and Zaia2015; Carneiro et al., Reference Carneiro, Stabile, Gomes, da Costa, Zaia and Zaia2017; Villafañe-Barajas et al., Reference Villafañe-Barajas, Baú, Colín-García, Negrón-Mendoza, Heredia-Barbero, Pi-Puig and Zaia2018; Zaia et al., Reference Zaia, Pereira and Samulewski2018; Baú et al., Reference Baú, Anizelli, de Santana, da Costa and Zaia2019). Unlike the seawater in the oceans today that have a high concentration of Na+ and Cl− (Bearman, Reference Bearman2004), this artificial seawater contains high concentrations of Mg2+ and SO42− (Zaia, Reference Zaia2012).
The radiolysis of adenine has been the subject of earlier investigations (Conlay, Reference Conlay1963; Ponnamperuma et al., Reference Ponnamperuma, Lemmon and Calvin1963; van Hemmen and Bleichrodt, Reference van Hemmen and Bleichrodt1971; Yamamoto, Reference Yamamoto1980; Yamamoto and Fuji, Reference Yamamoto and Fuji1986; Hartmann et al., Reference Hartmann, Quint and Getoff2007; Su et al., Reference Su, Huang, Dang, Wang and Yu2011). It has been reported that adenine is not easily decomposed by γ-radiation. There are several adenine decomposition products reported in the literature, among them adenine Nx-oxides, hydroxyl-adenine, xanthine and hypoxanthine and species with open rings. In addition, the effects of exposure to ionizing radiation on seawater are not yet fully understood (Draganić, Reference Draganić2005). The radiolysis of seawater is a matter of importance for radiation chemistry, since it may change the number of products from radiolysis of water (Kumagai et al., Reference Kumagai, Kimura, Taguchi, Nagaishi, Yamagishi and Kimura2013; Hata et al., Reference Hata, Inoue, Kojima, Iwase, Kasahara, Hanawa, Ueno and Tsukada2016a, Reference Hata, Satoh, Motooka, Ueno, Hanawa, Kasahara and Tsukada2016b ).
Therefore, the aim of this research is to quantify and characterize adenine radiolysis products in distilled water, saline solutions and artificial seawater 4.0 Ga, in order to provide a better perspective of the role of salts in radiolysis of this organic molecule. Adenine was measured by spectrophotometric (UV/vis) and high-performance liquid chromatography (HPLC). The products of radiolysis were characterized by high performance liquid chromatography used in combination with mass spectrometry (HPLC-Mass) and infrared spectroscopy (FT-IR). Theoretical calculations were performed to elucidate the possible products of decomposition, through optimization of geometry, simulated vibrational frequencies and relative energy comparison.
Materials and methods
Materials
Adenine
Adenine (Fig. 1), with the highest purity available (≥99%), purchased from Sigma Aldrich®, was used as received.
Glassware
All the glassware for irradiation was cleaned, according to chemical radiation procedures, with a hot mixture of HNO3 and H2SO4 for 4 h, followed by washing with double distilled water and Milli-Q purified water. The glassware was wrapped in aluminium foil and heated at 300 °C overnight for full elimination of organic matter.
Sample preparation
Three different sets of samples were prepared. Adenine (500 µg ml−1) was dissolved in distilled water, different saline waters or artificial seawater 4.0 Ga. The solutions were de-aired by bubbling with argon (Ar), sealed and irradiated in a 60Co source.
Seawater and saline solutions
The artificial seawater 4.0 Ga was prepared as described by Zaia (Reference Zaia2012). In 1 l of Milli-Q water, several salts were dissolved in the following order: Na2SO4 (0.271 g), MgCl2·6H2O (0.500 g), CaCl2·2H2O (2.500 g), KBr (0.050 g), K2SO4 (0.400 g) and MgSO4 (15.00 g). The following salt solutions (0.129 mol l−1) were prepared separately: (1) KCl, (2) K2SO4, (3) MgCl2·6H2O, (4) MgSO4 and (5) a saline solution containing MgCl2·6H2O plus MgSO4.
Methods
Radiolysis
The samples were irradiated in a γ ray source (Gammabean 651-PT) at room temperature (298 K). The irradiation dose was determined using a ferrous sulphate-copper sulphate dosimeter. The dose rate used was 197 Gy min−1 and the irradiation dose from 0.0 to 94.52 kGy.
UV/vis spectrophotometry
The quantity of adenine was determined by reading the absorbance at 260 nm with a spectrophotometer UV/vis Varian, model Cary 100 Scan (Fig. 2).
UV/Vis spectra of adenine in: (a) distilled water and (b) seawater. Spectra of patterns not irradiated (solid line) and irradiated samples (dashed line). For all experiments, the adenine concentration was 500 µg ml−1. Seawater was prepared as described by Zaia (Reference Zaia2012). The following irradiation doses were used: 23.71, 47.26, 71.12 and 94.52 kGy.

HPLC analysis
Adenine was quantified using a Varian 9005 equipped with a UV/vis detector and a column C-18. The liquid used in the mobile phase contained a mixture of 77% A (ammonium acetate 0.1 mol l−1 at pH 4.5) and 23% B (250 ml of acetonitrile, 250 ml of methanol and 4 ml of tetrahydrofuran), adopting a flow rate of 0.3 ml min−1. The detection was carried out at 260 nm.
Infrared spectroscopy (FT-IR)
FT-IR spectra were obtained using a reflectance accessory in a spectrometer (PerkinElmer spectrum 400, USA). The spectra were recorded at transmittance modes from 4000 to 650 cm−1 and a resolution of 4 cm−1 over 10 scans.
Statistical analysis
The Turkey test was performed to analyse the absorption differences, adopting a significance level of p < 0.05.
Computational details
The molecular geometries were optimized, and the frequencies and relative energy (E rel) determined using the density functional theory method with B3LYP functional (Becke, Reference Becke1988, Reference Becke1993; Lee et al., Reference Lee, Yang and Parr1988 ), basis set aug-cc-pVDZ level (Dunning, Reference Dunning1989), using the Gaussian 03 program (Frisch et al., Reference Frisch, Trucks, Schlegel, Scuseria, Robb, Cheeseman, Montgomery, Vreven, Kudin, Burant, Millam, Iyengar, Tomasi, Barone, Mennucci, Cossi, Scalmani, Rega, Petersson, Nakatsuji, Hada, Ehara, Toyota, Fukuda, Hasegawa, Ishida, Nakajima, Honda, Kitao, Nakai, Klene, Li, Knox, Hratchian, Cross, Bakken, Adamo, Jaramillo, Gomperts, Stratmann, Yazyev, Austin, Cammi, Pomelli, Ochterski, Ayala, Morokuma, Voth, Salvador, Dannenberg, Zakrzewski, Dapprich, Daniels, Strain, Farkas, Malick, Rabuck, Raghavachari, Foresman, Ortiz, Cui, Baboul, Clifford, Cioslowski, Stefanov, Liu, Liashenko, Piskorz, Komaromi, Martin, Fox, Keith, Al-Laham, Peng, Nanayakkara, Challacombe, Gill, Johnson, Chen, Wong, Gonzalez and Pople2004). The aug-cc-pVDZ basis set was chosen for the correct description of oxygen and nitrogen atoms. This basis set includes additional diffuse functions (prefix aug-), which were used to take into account the relatively diffuse nature of the lone pairs.
Results
Aqueous adenine exposure to γ-irradiation
Several experiments were performed to better understand the behaviour of adenine exposed to γ-irradiation at different doses. Solutions of adenine dissolved in distilled water, with and without O2, were γ irradiated. In addition, adenine dissolved in salt solutions (KCl, K2SO4, MgCl2 and MgSO4), in a salt mixture (MgCl2·6H2O plus MgSO4) and in artificial seawater 4.0 Ga was also γ irradiated; in all these latter cases the solutions were oxygen free as O2 was removed by bubbling Ar into the sample.
OH● is the main oxidizing substance formed after water radiolysis through ionizing radiation (Equations (1–3)) (Samuel and Magee, Reference Samuel and Magee1953; Allen, Reference Allen1961; Draganić and Draganić, Reference Draganić and Draganić1971). Dissolved oxygen (O2) should be withdrawn from the solution since it can switch the main oxidizing species formed by removing the hydrated electron (e−aq) (Equation (4)) (Draganić and Draganić, Reference Draganić and Draganić1971).


The pH of the samples increased after irradiation, with two exceptions, adenine dissolved in MgSO4 and adenine dissolved in artificial seawater 4.0 Ga (Fig. 3). Changes in pH are an indication of the occurrence of chemical reactions. In addition, the irradiated solutions showed a yellowish colour, another indication of a chemical reaction (Fig. 2). The UV/vis spectra of samples showed that as the dose increased, the absorption of the characteristic band of adenine at 260 nm (Fig. 2) decreased. In general, the decomposition was minor in the case of the system containing the adenine dissolved in artificial seawater 4.0 Ga.
pH values of the solutions of adenine after irradiation. For all experiments, the adenine concentration was 500 µg ml−1. Seawater was prepared as described by Zaia (Reference Zaia2012). The concentration of all saline solutions was 0.129 mol l−1.

After irradiation, for the salt and artificial seawater solutions, the quantity of adenine was quantified by HPLC, the cations were first removed using a cation exchange resin before injection. Figure 4 shows the decomposition pattern of adenine as a function of dose. As dose increased, decomposition also increased in all the experiments. Solutions containing different cations and anions were prepared in order to understand the contribution of each species to decompositions. However, this effect could not be fully tracked, since the behaviour did not show a clear tendency. Nonetheless, some points should be highlighted. The decomposition at 23.71 kGy of adenine was very likely for all samples. However, as irradiation continued, differences were more evident. For example, at 47.26 kGy the sample of adenine dissolved in KCl solution presented the highest degradation (64.38%), while both the sample of adenine dissolved in MgSO4 solution and the one dissolved in artificial seawater 4.0 Ga showed the lowest degradation, 47.27 and 48.33% respectively. At 71.12 kGy, decomposition was higher for adenine dissolved in distilled water (70.31%) and lower for adenine dissolved in seawater solution (50.52%). Finally, at the highest radiation dose, the distilled water system presented the highest decomposition (85%) and the seawater solution showed the lowest decomposition (64%). Even though the degradation of adenine at the highest dose was not statistically different in the solutions (Table 1), a tendency for better protection of adenine was observed in the case of the seawater model experiment.
Residual adenine% at different irradiation doses.

Survival of adenine by dose of γ-radiation

The results are present as mean ± standard error. The number of sets was one with three samples each set. It was irradiated 5 mL of adenine solution at a concentration of 500 µg ml−1, at different doses of γ-radiation exposure. Capital letters in columns were statistically different from each other by Tukey's test (p < 0.05). Lowercase letters in lines were statistically different from each other by Tukey's test (p < 0.05). For all saline solutions 0.129 mol l−1 of each salt was used. Saline mixture contained MgCl2·6H2O and MgSO4 (1/1). Artificial seawater 4.0 Ga were prepared as described by Zaia (Reference Zaia2012).
Vibrational analysis
For the samples of adenine dissolved in distilled water, the FT-IR spectra demonstrated that an increase in irradiation doses increased adenine decomposition (Fig. 5). The major changes in the FT-IR spectra occurred at 1598 and 1668 cm−1 and these bands are attributed to the ν(C = C) stretching and β(NH2) in-plane bending, respectively (Fig. 4) (Matholouthi et al., Reference Matholouthi, Seuvre and Koenig1984; Bertoluzza et al., Reference Bertoluzza, Fagnano, Tosi, Morelli and Long1987; Mohamed et al., Reference Mohamed, Shabaan, Zoghaib, Husband, Farag and Alajhaz2009; Anizelli et al., Reference Anizelli, Baú, Nabeshima, da Costa, de Santana and Zaia2014). In addition, in this region, shifts occurred in the bands and a new band appeared. The intensity of the bands at 911, 938, 1019, 1123, 1251 and 1415 cm−1 decreased (Fig. 4); these bands are attributed to δ(C–N–C)py deformation of the pyrimidine ring, δ(N–C = N)im deformation of the imidazole ring, ρ(NH2) rocking, δ(C–H)im deformation, ν(C–NH2) stretching and ν(C = N)py stretching, respectively (Matholouthi et al., Reference Matholouthi, Seuvre and Koenig1984; Bertoluzza et al., Reference Bertoluzza, Fagnano, Tosi, Morelli and Long1987; Mohamed et al., Reference Mohamed, Shabaan, Zoghaib, Husband, Farag and Alajhaz2009; Anizelli et al., Reference Anizelli, Baú, Nabeshima, da Costa, de Santana and Zaia2014). Thus, it can be inferred that irradiation has an effect on the pyrimidine and imidazole rings of adenine.
FT-IR spectra of adenine after irradiated at different doses. Adenine was dissolved in distilled water (500 µg ml−1), after the samples were irradiated and solutions were lyophilized. Before the irradiation, O2 was removed by fluxing Ar into the sample.

To better understand these band shifts and new band formation, in the region from 1550 to 1750 cm−1, a deconvolution of the FT-IR spectra was performed (Fig. 6). The deconvolution of adenine control bands showed four bands at 1572/1603, 1650 and 1674 cm−1 (Fig. 6(a)). These bands could be attributed to ν(C = C) stretching, ν(C = N) stretching and β(NH2) in-plane bending, respectively (Matholouthi et al., Reference Matholouthi, Seuvre and Koenig1984; Bertoluzza et al., Reference Bertoluzza, Fagnano, Tosi, Morelli and Long1987; Mohamed et al., Reference Mohamed, Shabaan, Zoghaib, Husband, Farag and Alajhaz2009; Anizelli et al., Reference Anizelli, Baú, Nabeshima, da Costa, de Santana and Zaia2014). For the adenine irradiated sample (71.12 kGy) the bands shifted from 1572/1603, 1650 and 1674 cm−1 to 1600/1602, 1640 and 1668 cm−1 (Fig. 5(b)). In addition, Fig. 5(b) presents a new band at 1713 cm−1, which could be due to the formation of a new compound. For adenine dissolved in KCl and MgCl2 solutions, the FT-IR spectra of irradiated samples demonstrated the same behaviour as in distilled water (figure not shown). However, for the samples of adenine dissolved in artificial seawater 4.0 Ga, K2SO4 and MgSO4 solutions, the FT-IR spectra of the irradiated samples only demonstrated bands due to SO42− (figure not shown).
Deconvolution bands of FT-IR spectra in the region of 1550 to 1750 cm−1 of adenine. (a) Control sample. The best regression was obtained with four bands (r 2 = 0.998). (b) Irradiated sample at 71.12 kGy. The best regression was obtained with five bands (r 2 = 0.999). Adenine was dissolved in distilled water (500 µg mL−1), after the sample was irradiated and solution was lyophilized. Before the irradiation, O2 was removed by fluxing Ar into the sample.

Characterization of the product
The FT-IR spectra of irradiated adenine samples showed a new band at 1713 cm−1, which may be due to the production of a new compound (Figs. 5 and 6(b)). This compound could be xanthine or hypoxanthine (similar bases to adenine). However, HPLC chromatograms of standards showed that xanthine and hypoxanthine had different retention times to the unknown compound (figure not shown). The peak of the unknown compound, for both irradiated samples of adenine (distilled water and artificial seawater 4.0 Ga), appears close to the adenine peak, with a difference of less than 0.5 min (Fig. 7). This behaviour suggests that the unknown compound has a similar structure to adenine. The quantity of the unidentified compound formed increased until 71.12 kGy dose and decreased at 94.52 kGy dose (Fig. 7).
HPLC chromatograms of adenine radiolysis in: (a) distilled water solution and (b) seawater solution. Adenine was dissolved in distilled water (500 µg ml−1) or artificial seawater (500 µg ml−1), after the sample was irradiated. Before the irradiation, O2 was removed by fluxing Ar into the sample. Seawater was prepared as described by Zaia (Reference Zaia2012). The adenine peak is showed around 11.4 min, the arrow corresponds to.

After irradiation of the samples in distilled water and artificial seawater 4.0 Ga, using HPLC-MS, the peaks at 136 m/z and 137 m/z showed a retention time of 1.83 min. A standard of adenine showed the same m/z peaks and retention time. The unknown compound detected previously in HPLC chromatograms (Fig. 7) showed peaks at 152 and 153 m/z with a retention time varying from 2.01 to 2.07 min (figure not shown). Xanthine has a peak at 152.1 m/z, however its retention time is 1.83 min. The standard of hypoxanthine showed retention times of 137 m/z and 1.84 min which did not match the retention time of the unknown compound. Thus, it is very likely that the unknown compound is not xanthine or hypoxanthine. The formation of isoguanine (molar mass = 151.1261) has been reported in radiolysis experiments of oxygenated adenine, and it probably formed in the current experiments; this result was not corroborated due to the lack of a standard. Although different conditions have been used in several experiments, the most common product detected in adenine radiolysis experiments is 8-hydroxy-adenine; in fact, according to Conlay (Reference Conlay1963), the main product of adenine irradiation both in oxygen free and oxygen saturated solutions is 8-hydroxyadenine. In addition, in adenine radiolysis experiments, other products have also been detected: hypoxanthine, 4,6-diamino-5-formamido-pyrimidine, 6-amino-8-hydroxy-7,8-dihydropurine, adenine-7-N-oxide and 6-amino-8-hydroxy-7,8-dihydropurine (van Hemmen and Bleichrodt, Reference van Hemmen and Bleichrodt1971; Gorin et al., Reference Gorin, Lehman, Mannan, Raff and Scheppele1977; Yamamoto, Reference Yamamoto1980; Yamamoto and Fuji, Reference Yamamoto and Fuji1986; Hartmann et al., Reference Hartmann, Quint and Getoff2007; Agnihotri and Mishra, Reference Agnihotri and Mishra2011).
Radiation-chemical yield
The radiation-chemical yield is defined as the number of species produced or disappeared by 100 eV of radiation absorbed (Allen, Reference Allen1961; Draganić and Draganić, Reference Draganić and Draganić1971). Radiation-chemical yield G is the number of disappeared moles of adenine (n) multiplied by Avogadro's number, divided by the absorbed dose (Gy), multiplied by a conversion factor from Gy to eV (Equation (5)).

After plotting the G values (Fig. 8) for each dose and system, the G (−A) value was estimated (Table 2). In all cases, the G (−A) values were ≤1. The low G (−A) values for the decomposition of adenine suggest its resilience to decomposition in solution, and may be due to reactions of reconstitution with adenine as a product (van Hemmen and Bleichrodt, Reference van Hemmen and Bleichrodt1971). The highest G (−A) value was the one estimated for adenine irradiated in MgSO4 (0.95) solutions, and the lowest for the adenine-KCl system (0.57). The presence of oxygen also affects the decomposition of adenine solution; decomposition of de-aerated solutions is G (−A) = 0.65 and of oxygen containing solutions is G (−A) = 0.61.
Radiation-chemical yield in function of the dose. G is defined as the number of molecules of adenine disappeared by 100 eV of absorbed radiation. For all experiments, the adenine concentration was 500 µg ml−1. Seawater was prepared as described by Zaia (Reference Zaia2012). The concentration of all saline solutions was 0.129 mol l−1.

G (−A) values calculated for adenine decomposition in each system

G(−A) refers to G values for adenine degradation.
Theoretical calculations
Theoretical calculations were performed to investigate the possible products of decomposition of irradiated adenine. The following adenine-related compounds were used in the theoretical calculations: the three adenine Nx-oxides (N1, N3 and N7-oxides), 2-hydroxy-adenine (enol-amino and keto-amino), 8-hydroxy-adenine (enol-amino and keto-amino) and N-hydroxy-adenine (6-N-hydroxyl-aminopurine) (Fig. 9). It should be pointed out that some of these species are detected in experiments with adenine exposed to γ-radiation (Conlay, Reference Conlay1963; Ponnamperuma et al., Reference Ponnamperuma, Lemmon and Calvin1963; van Hemmen and Bleichrodt, Reference van Hemmen and Bleichrodt1971; Yamamoto, Reference Yamamoto1980; Yamamoto and Fuji, Reference Yamamoto and Fuji1986). It should be noted that these molecules have the same molecular mass (151 a.u.) detected by the HPLC-Mass analysis. The geometry of the molecules was optimized by the functional B3LYP and aug-cc-pvdz bases set, and the simulated vibrational spectra. There are several possible adenine Nx-oxides, but only three are common, with oxygen bonded to N1, N3 and N7 of adenine (Stevens and Brown, Reference Stevens and Brown1958). For the hydroxyl adenine species, although there are several tautomers, amino, imino, enol and keto, only those with the lowest relative energy were chosen for the investigations (Cysewski et al., Reference Cysewski, Jeziorek, Olinski and Woznicki1995).
Structure of optimized geometry of the simulated molecules of: (a) adenine N1-oxide; (b) adenine N3-oxide; (c) adenine N7-oxide; (d) 2-hydroxyl-adenine (enol-amino); (e) 8-hydroxyl-adenine (enol-amino); (f) 2-hydroxyl-adenine (keto-amino); (g) 8-hydroxyl-adenine (keto-amino) and (h) N-hydroxy-adenine.

For adenine, the main simulated frequencies were 1513, 1600, 1636 and 1660 cm−1, and these were attributed to ν(C = N)im stretching, ν(C = C) stretching, ν(C = N) stretching and β(NH2) in plane bending, respectively (Anizelli et al., Reference Anizelli, Baú, Nabeshima, da Costa, de Santana and Zaia2014). The attributions of the frequencies for the adenine Nx-oxides and the hydroxy-adenine were performed according to the theoretical calculations (Table 3). It is important to notice that adenine N1-oxide shows a frequency at 1702 cm−1 (Table 3). This frequency has a value close to the new band observed in the deconvolution of the FT-IR spectra of the irradiated adenine (Fig. 6(b)). However, adenine N3 and N7-oxide show this frequency at 1673 and 1687 cm−1, respectively (Table 3). The keto-amino species present frequencies at 1746 and 1811 cm−1 for 2-hydroxy-adenine and 8-hydroxy-adenine, respectively, attributed to stretching ν(C = O). However, these frequencies were not observed experimentally. Thus, the formation of the keto-amino tautomers cannot be assumed.
Assignments of the frequencies observed in adenine-related compounds
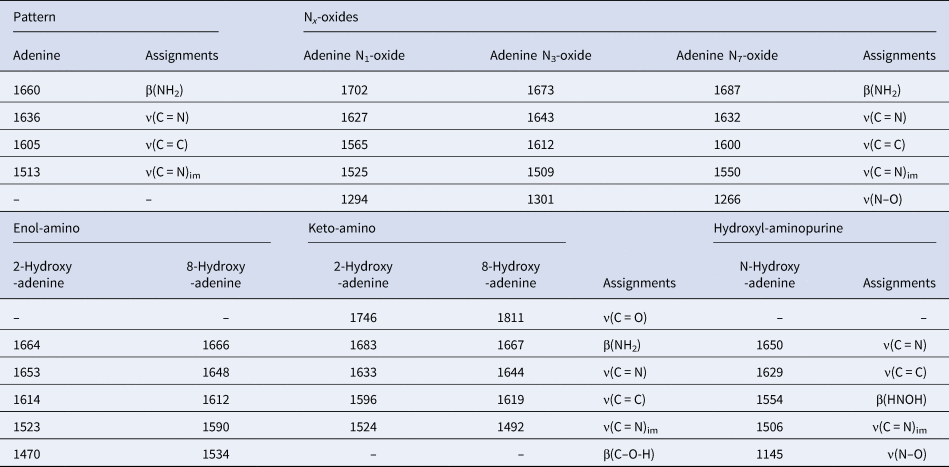
ν-stretching; β-in-plane bending; im-imidazole ring. The assignments of the oxide and hydroxyl-modified adenine derivatives were attributed according to the theoretical calculations.
The hydroxyl and oxide derivatives have lower relative energy than adenine molecules (Fig. 10). Among the Nx-oxides, adenine N1-oxide has the lowest E rel, with a difference of a few kcal mol−1, following the sequence N1 < N7 < N3. The calculations for the hydroxyl adenine presented a lower value of E rel than Nx-oxides. The relative energies of the keto-amino species are lower than the enol-amino species (Fig. 10). However, as the calculated vibrational frequencies do not point to its formation, it may be concluded that enol-amino could be the formed species.
Relative energies (Gcal mol−1) of the simulate molecules: (a) adenine N1-oxide; (b) adenine N3-oxide; (c) adenine N7-oxide; (d) 2-hydroxyl-adenine (enol-amino); (e) 8-hydroxyl-adenine (enol-amino); (f) 2-hydroxyl-adenine (keto-amino); (g) 8-hydroxyl-adenine (keto-amino) and (h) N-hydroxyl-adenine.

Discussion
Adenine radiolysis under different conditions has been widely studied (Conlay, Reference Conlay1963; Ponnamperuma et al., Reference Ponnamperuma, Lemmon and Calvin1963; Rhaese, Reference Rhaese1968; van Hemmen and Bleichrodt, Reference van Hemmen and Bleichrodt1971; Yamamoto, Reference Yamamoto1980; Yamamoto and Fuji, Reference Yamamoto and Fuji1986). Reported G values for adenine decomposition range from 0.35 to 1.2 for adenine concentrations from 2 × 10⁻⁵ to 8 × 10⁻³ mol l−1 (Scholes et al., Reference Scholes, Ward and Weiss1960; Conlay, Reference Conlay1963; Mannan, Reference Mannan1972; and reference therein). In these experiments, the calculated values are always between 0.5 ≥ 1.00. The G value seems to be higher in systems containing oxygen, compared to de-aerated solutions. Conlay (Reference Conlay1963) obtained a G (−A) = 0.86 for an oxygen containing solution, and G (−A) = 0.35 for a non-aerated solution. In this study, both values are very close (Table 2). The relevance of the presence of oxygen is that oxygen can react with adenine molecules or compete with the organic molecule, adenine in this case, to react with water radicals. If oxygen is not continuously supplied into the system it is easily consumed (Mannan, Reference Mannan1972); this behaviour could explain the G values in these experiments, since the aerated solutions were not saturated with oxygen.
In radiation chemistry experiments, the ions in the solution strongly influence the radiolysis experiments. In general, halide ions (i.e. Cl− and Br−) react with the OH radical (Draganić and Draganić, Reference Draganić and Draganić1971), the main factor responsible for attacking adenine. In the experiments shown here, the presence of both Cl− and Br− in the seawater model produced lower degradation of the organic molecule.
Radical modified adenine derivatives
Adenine in aqueous solution submitted to ionizing radiation generates a variety of substances, such as hypoxanthine, xanthine, 2-hydroxy-adenine (isoguanine), 8-hydroxy-adenine, 6-N-hydroxy-adenine, adenine Nx-oxides and adenine itself, as well as other species with open rings (Conlay, Reference Conlay1963; Ponnamperuma et al., Reference Ponnamperuma, Lemmon and Calvin1963; Rhaese, Reference Rhaese1968; van Hemmen and Bleichrodt, Reference van Hemmen and Bleichrodt1971; Yamamoto, Reference Yamamoto1980; Yamamoto and Fuji, Reference Yamamoto and Fuji1986). Equations (6), (7) and (8) show the adenine N1-oxide and adenine N7-oxide synthesis from adenine (Fig. 11). The theoretical calculations indicate a lower relative energy for adenine N1-oxide, suggesting its formation (Fig. 10). Previously published works did not detect the formation of adenine N3-oxide, probably because among adenine Nx-oxides, adenine N3-oxide has the highest energy (Fig. 10). Yamamoto (Reference Yamamoto1980) suggested the formation of adenine N7-oxide and its conversion to adenine N1-oxide (equation (8)). Adenine Nx-oxide is stable in aqueous solution and no conversion to adenine was observed through the loss of oxygen atom (Stevens et al., Reference Stevens, Magrath, Smith and Brown1958).
Reaction mechanisms for the irradiation of aqueous adenine. Steps in brackets refer to transitional states (A Adenine; radical) (Conlay, Reference Conlay1963; Ponnamperuma et al., Reference Ponnamperuma, Lemmon and Calvin1963; Rhaese, Reference Rhaese1968; van Hemmen and Bleichrodt, Reference van Hemmen and Bleichrodt1971; Yamamoto, Reference Yamamoto1980; Yamamoto and Fuji, Reference Yamamoto and Fuji1986).

Equations (9) to (11) show the formation of 2-hydroxy-adenine, 8-hydroxyl-adenine and N-hydroxy-adenine (Fig. 11). 8-Hydroxy-adenine was the major product formed from irradiation of a de-aerated solution of adenine, followed by hypoxanthine (Conlay, Reference Conlay1963). However, adenine Nx-oxides were not observed (Conlay, Reference Conlay1963). After irradiation of adenine, Ponnamperuma et al. (Reference Ponnamperuma, Lemmon and Calvin1963) observed the formation of 8-hydroxy-adenine and 4,6-diamino-5-formamidopyrimidine with traces of hypoxanthine and 4-amino-5-formamido-6-hydroxypyrimidine. Submitting aqueous adenine (de-eared solution) to γ-irradiation, van Hemmen and Bleichrodt (Reference van Hemmen and Bleichrodt1971 ) observed the formation of six compounds, with 8-hydroxy-adenine as the major compound. The X-ray irradiation of aqueous adenine led to the formation of several products, such as adenine N1-oxide, adenine N7-oxide, 8-hydroxy-adenine and 2-hydroxy-adenine, among others (Rhaese, Reference Rhaese1968). The γ-irradiation of aqueous adenine produced several compounds such as: adenine N7-oxide, adenine N1-oxide, 2-hydroxy-adenine (isoguanine) and isoguanine-7-N-oxide (Yamamoto, Reference Yamamoto1980). The γ-irradiation of adenine in aqueous solution produced 8-hydroxy-adenine, and the chromatographic profile was similar to the present work (Hartmann et al., Reference Hartmann, Quint and Getoff2007). Using gas discharges for radiolysis of adenine in aqueous solution, Su et al. (Reference Su, Huang, Dang, Wang and Yu2011) observed the formation of 4,6-diamino-5-formamidopyrimidine, 8-hydroxy-adenine and 2-hydroxy-adenine.
Prebiotic seawater relevance
Izawa et al. (Reference Izawa, Nesbit, MacRae and Hoffman2010) performed an experiment by leaching meteorite samples from the Tagish lake, and obtained the following order of cations: Mg2+ > Ca2+ >> Na+ ≈ K+ and anions: SO42− >> Cl−. It should be noted that the meteorite samples from the Tagish lake are among the oldest rocks from the solar system (Brown et al., Reference Brown, Hildebrand, Zolensky, Grady, Clayton, Mayeda, Tagliaferri, Spalding, MacRae, Hoffman, Mittlefehldt, Wacker, Bird, Campbell, Carpenter, Gingerich, Glatiotis, Greiner, Mansur, McCausland, Plotkin and Mazur2000). The artificial seawater 4.0 Ga, used in this research, better resembles the major cations and anions of seawater on the Earth of 4.0 billion years ago (Zaia, Reference Zaia2012). Thus, the experiments carried out in this work may better represent what could have occurred in the prebiotic Earth 4.0 billion years ago. Of course, control experiments (in distilled water) are necessary to provide an idea of the effect of the ions. We observed that this seawater influences the stability of minerals and the adsorption of nucleic acid bases (Anizelli et al., Reference Anizelli, Baú, Gomes, da Costa, Carneiro, Zaia and Zaia2015, Reference Anizelli, Baú, Valezi, Canton, Carneiro, di Mauro, da Costa, Galante, Braga, Rodrigues, Coronas, Casado-Coterillo, Zaia and Zaia2016; Canhisares-Filho et al., Reference Canhisares-Filho, Carneiro, de Santana, Urbano, da Costa, Zaia and Zaia2015; Carneiro et al., Reference Carneiro, Stabile, Gomes, da Costa, Zaia and Zaia2017; Villafañe-Barajas et al., Reference Villafañe-Barajas, Baú, Colín-García, Negrón-Mendoza, Heredia-Barbero, Pi-Puig and Zaia2018; Zaia et al., Reference Zaia, Pereira and Samulewski2018). In addition, the interaction of cations of seawater (Ca2+, Mg2+, Sr2+ and Na+) with nucleic acid bases changed their reactivity (Anizelli et al., Reference Anizelli, Baú, Nabeshima, da Costa, de Santana and Zaia2014; Baú et al., Reference Baú, Anizelli, de Santana, da Costa and Zaia2019). It should be noted that Mg2+, the highest cation concentration in seawater, could be important in nucleoside formation (Sheng et al., Reference Sheng, Bean, Mamajanov, Hud and Leszczynski2009). However, Ferris and Ertem (Reference Ferris and Ertem1993) observed that Mg2+ adsorbed onto montmorillonite did not have a catalytic effect on the formation of adenylic acid. K+, one of the cations of the seawater, has an effect on the formation of peptides (Dubina et al., Reference Dubina, Vyazmin, Boitsov, Nikolaev, Popov, Kononikhin, Eliseev and Natochin2013).
In general, saline solutions present better adenine protective effects against γ-gamma radiation than distilled water because Br−, Cl− and SO42− act as scavengers for hydroxyl radicals (Draganić and Draganić, Reference Draganić and Draganić1971; Kumagai et al., Reference Kumagai, Kimura, Taguchi, Nagaishi, Yamagishi and Kimura2013; Hata et al., Reference Hata, Inoue, Kojima, Iwase, Kasahara, Hanawa, Ueno and Tsukada2016a, Reference Hata, Satoh, Motooka, Ueno, Hanawa, Kasahara and Tsukada2016b). It is probable that as the artificial seawater 4.0 Ga contains both Cl− and Br− a better protective effect of adenine was achieved (Table 1, Fig. 4) (Hata et al., Reference Hata, Satoh, Motooka, Ueno, Hanawa, Kasahara and Tsukada2016b).
The results obtained in several works suggested that adenine irradiation produced a large variety of species (Conlay, Reference Conlay1963; Ponnamperuma et al., Reference Ponnamperuma, Lemmon and Calvin1963; Rhaese, Reference Rhaese1968; van Hemmen and Bleichrodt, Reference van Hemmen and Bleichrodt1971; Yamamoto, Reference Yamamoto1980; Yamamoto and Fuji, Reference Yamamoto and Fuji1986). The synthesis of different species during irradiation of the adenine samples could be a double-edged sword for prebiotic chemistry. On the one side, a large variety of species could mean much more complex prebiotic chemistry, with more possibilities for the formation of different and more complex molecules. On the other hand, this could represent the production of a mixture which could not further produce any important molecules. This subject, intractable mixture-‘gunk’, has already been addressed by one researcher (Schwartz, Reference Schwartz2007).
In the current work, two important results were found. First, the radiolysis of adenine is affected by the presence of ions in the milieu. Second, artificial seawater 4.0 Ga protected adenine against degradation by γ-radiation. In a context of chemical evolution, it is fundamental to take into account the possible composition of primitive seas, in order to understand the fate of organic molecules.
Remarks
The radiolysis of aqueous adenine leads to hydroxyl and oxide radical modified adenine derivatives that could be available for chemical evolution steps. Furthermore, it was demonstrated that the artificial seawater 4.0 Ga, which resembles the early ocean (from 4.0 billion years ago), was able to decrease the decomposition of aqueous adenine through γ-radiation exposure. These results reaffirm the importance of using seawater analogues in prebiotic chemistry experiments, since differences in adenine decomposition were observed only for the seawater solution, which may give rise to results of prebiotic relevance.
Acknowledgements
JPTB acknowledges CAPES for the founding, the Laboratory of Chemical Evolution and the ICN, from National Autonomous University of Mexico, Mexico City, for the gently permission for the performance of the laboratorial activities and irradiation procedures. M. Sc. Benjamin Leal, Phys. Francisco García and all the staff of Radiation Unit at Instituto de Ciencias Nucleares, UNAM are acknowledged. The authors thank the Laboratory of Spectroscopy (ESPEC) from the University State of Londrina, Brazil. This research was partially supported by PAPIIT-DGAPA IA203217.



