I. INTRODUCTION
AlGaN based high electron mobility transistors grown on large size (150–200 mm) silicon substrates demonstrate a high Baliga's figure of merit V BD 2/R ON, owing to the large breakdown field strength of GaN (>300 V/μm) and the formation of high-density and high-mobility carriers in a two-dimensional electron gas channel. These devices show potential in a wide range of applications from high power switching, radio-frequency amplification, to potential integration with Si-based CMOS technologies. Reference Saito, Takada, Kuraguchi, Omura, Ogura and Ohashi1–Reference Hoke, Chelakara, Bettencourt, Kazior, LaRoche, Kennedy, Mosca, Torabi, Kerr, Lee and Palacios5
Deposition of GaN has been reported on silicon substrates along different crystal planes, such as (100), (110), and (111). The Si (111) plane is usually chosen due to its trigonal symmetry favoring epitaxy of a hexagonal Wurtzite GaN structure.
Reference Daddar, Schulze, Wienecke, Gadanecz, Blasing, Veit, Hempel, Diez, Christen and Krost6–Reference Schulze, Dadgar, Blasing, Diez and Krost9
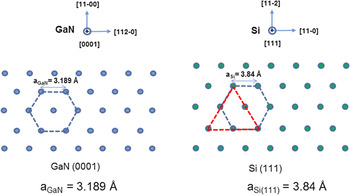
The epitaxial relationship between GaN (0001) and Si (111), with in-plane orientation of
 ${\rm{GaN}}\left[ {112\bar 0} \right]//{\rm{Si}}\left[ {11\bar 0} \right]$
and
 ${\rm{GaN}}\left[ {11\bar 00} \right]//{\rm{Si}}\left[ {11\bar 2} \right]$
, is illustrated in Fig. 1. However, the epitaxy of GaN on Si is challenging due to several reasons: (i) Ga meltback etching of Si from eutectic Ga–Si reactions occurring even at temperatures close to the Ga melting point of 29.8 °C,
Reference Olesinski, Kanani and Abbaschian10,Reference Sunkara, Sharma, Miranda, Lian and Dickey11
(ii) high dislocation density (>10
Reference Wan, Venugopal, Melloch, Liaw and Rummel8–Reference Olesinski, Kanani and Abbaschian10
cm−2) due to large mismatch (−16.9%) in lateral lattice constant between GaN (a
GaN = 3.189 Å) and Si (a
Si(111) = 3.84 Å), and (iii) significant tensile thermal stress during cool-down resulting in concave bending of Si wafer and cracks in the GaN epilayers due to the large difference (∼54%) in thermal expansion coefficient (CTE) between GaN (CTEGaN = 5.59 × 10⁻⁶ K−1) and Si (CTESi = 2.59 × 10⁻⁶ K−1). To avoid Ga meltback etching, other materials have to be used as nucleation or transition layers to isolate GaN from Si, such as AlN,
Reference Watanabe, Takeuchi, Hirosawa, Amano, Hiramatsu and Akasaki12–Reference Zang, Wang, Chua and Thompson18
SiC,
Reference Takeuchi, Amano, Hiramatsu, Sawaki and Akasaki19–Reference Kwon, Jeong, Shin, Yang, Lim, Roh and Nahm21
HfN,
Reference Armitage, Yang, Feick, Gebauer, Weber, Shinkai and Sasaki22
ZnO,
Reference He, Fan, Yao and Tang23
Al2O3,
Reference Fenwick, Melton, Xu, Li, Summers, Jamil and Ferguson24
or rare earth oxides or nitrides.
Reference Dargis, Smith, Arkun and Clark25
Epitaxial relationship between GaN (0001) and Si (111), (a) GaN (0001) plane with a GaN = 3.189 Å and (b) Si (111) plane with a Si(111) = 3.84 Å.

In the case of using AlN as a nucleation layer, Al pretreatment or preflow Reference Dadgar, Blasing, Diez, Alam, Heuken and Krost14–Reference Zang, Wang, Chua and Thompson18 is often used to wet the Si surface without the introduction of ammonia (NH3) to prevent the formation of an amorphous SiN x layer. Reference Tanaka, Kawaguchi, Sawaki, Hibino and Hiramatsu26,Reference Kim, Bang, Park, Choi, Seong and Park27 However, an amorphous thin layer of SiN x can still exist at the Si–AlN interface due to the reaction between N and the Si substrate. Reference Lin, Chen, Chen and Chang28–Reference Radtke, Couillard, Botton, Zhu and Humphreys31 The conditions for TMAl preflow (such as time, TMAl flow, and temperature) Reference Radtke, Couillard, Botton, Zhu and Humphreys31–Reference Lumbantoruan, Wong, Wu, Huang, Shrestra, Luong, Tinh and Chang34 are critical in affecting the Si–AlN interface, which can determine the structural quality, surface morphology, and surface pits in the AlN layer and the subsequently grown GaN layers.
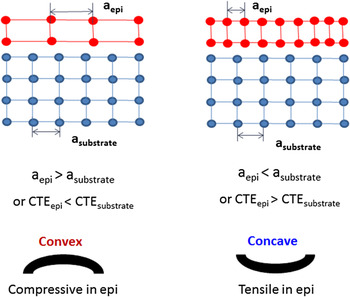
The stress in uniformly strained epilayers is primarily caused by the lattice and thermal mismatch between epilayers and substrates. The stress in the nonrelaxed epilayers can bend the substrates either during epitaxy or after cool-down. For compressively strained epilayers, either due to lattice mismatch (a epi > a substrate) or thermal mismatch (CTEepi < CTEsubstrate) during cool-down, the bending of the substrates will be convex, as seen in Fig. 2(a). For tensile-strained epilayers, either due to lattice mismatch (a epi < a substrate) or thermal mismatch (CTEepi > CTEsubstrate) during cool-down, the bending of the substrates will be concave, as seen in Fig. 2(b). To compensate for the large tensile thermal stress (CTEGaN > CTESi) that occurs during wafer cool-down, some compressive stress can be intentionally built-in to the GaN layer during epitaxy by lattice-mismatch-induced strain. Intermediate layers such as graded or stepped Al x Ga1−x N layers, Reference Ishikawa, Zhao, Nakada, Egawa, Jimbo and Umeno35–Reference Liu, Dolmanan, Zhang, Chua, Chi, Heuken and Tripathy41 and strained Al(Ga)N/(Al)GaN superlattices (SLs) Reference Feltin, Beaumont, Laugt, de Mierry, Vennegues, Lahreche, Leroux and Gibart42–Reference Christy, Egawa, Yano, Tokunaga, Shimamura, Yamaoka, Ubukata, Tabuchi and Matsumoto47 have been proven effective in building compressive intrinsic stress, minimizing wafer curvature/bow and reducing crack density of GaN layers after cool-down. In addition, incorporating low-temperature grown Al(Ga)N Reference Amano, Iwaya, Kashima, Katsuragawa, Akasaki, Han, Hearne, Floro, Chason and Figiel48–Reference Han, Waldrip, Lee, Figiel, Hearne, Petersen and Myers52 and Si x N y Reference Cheng, Leys, Degroote, Germain and Borghs40,Reference Dadgar, Poschenrieder, Blasing, Fehse, Diez and Krost53–Reference Wang, Ou, Horng and Wuu57 interlayers can help the stress control and reduction of dislocation density.
Correlation between wafer curvature and difference in the lattice constant and CTE, (a) in the case of a epi > a substrate, or CTEepi < CTEsubstrate, (b) a epi < a substrate, or CTEepi > CTEsubstrate.

Though tremendous progress has been made on stress control implementing different intermediate buffer structures, very few reports have been published regarding the detailed stress engineering mechanism using AlN/GaN SL structures. In this study, we are reporting on stress control using AlN/GaN SLs for epitaxy of GaN layers on 200 mm Si substrates carried out in Veeco's Propel™ single wafer and rotating disk MOCVD reactor. The single wafer reactor is designed to have excellent uniformity in epitaxial layer thickness and alloy composition, which enables uniform and controllable stress in epilayers across large size substrates. Compressive and tensile stress can be precisely adjusted by changing the thickness of the AlN and GaN layers in the SLs, resulting in controllable wafer curvature/bow after cool-down. The effects of growth conditions, such as growth rates (GRs) of GaN, V/III ratio during AlN growth, and growth temperature, on wafer stress are investigated for a SL structure of constant period thickness.
II. EXPERIMENT DETAILS
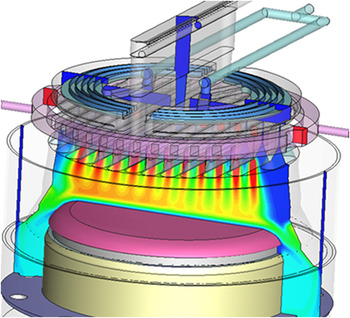
Epitaxy process experiments were carried out in a state-of-art Veeco Propel™ MOCVD system, which comprises a rotating-disk single wafer MOCVD reactor capable of processing 200 mm substrates. The Turbodisc® vertical reactor encompasses the core precursor reaction and high velocity laminar flow characteristics of its predecessor batch systems (K465i and EPIK 700), thus enabling stable, repeatable operation, long predictive/preventive maintenance cycles, and direct, flow model-based process scale-up. As shown in Fig. 3, the reactor incorporates a flange design (IsoFlange™) for optimized alkyl/hydride injection, homogenous flow distribution, and uniform boundary layer thickness across the wafer. A circular heater design (SymmHeat™) eliminates the cold zone at the susceptor center and enables concentric heating and improved center-to-edge radial temperature uniformity. In addition, the design of the single wafer reactor leads to symmetric and concentric thickness/alloy composition pattern and elimination of the leading/trailing edge effect, which usually occurs in a batch rotating-disk reactor. Optimized high velocity laminar flow minimizes flow turbulence and recirculation, which leads to low residence times that are ideal for multilayer heterostructures requiring abrupt transitions in alloy composition and doping profiles. All these enabling features translate into excellent uniformity in epitaxial layer thickness, alloy composition, and doping profile across the wafer. The uniformity in epilayer thickness and alloy composition, together with radial temperature gradient, results in uniformity in concentric stress profile across the wafer and possibility for precise bow engineering.
Flow field in the Propel™ rotating-disk single wafer MOCVD reactor.

The system is equipped with a DRT-210 in situ process monitor (integrated pyrometer-reflectometer-deflectometer unit) for wafer temperature, reflectance, and wafer curvature measurements. The temperature is monitored and controlled at the center and near the edge of the substrate. The GRs of epitaxial layers along with pyrometer temperature control are measured by the reflectometer with wave length of 930 nm. The evolution of growth stress can also be monitored in real-time through the change of wafer curvature using the in situ deflectometer with wave length of 650 nm, Reference Amano, Iwaya, Kashima, Katsuragawa, Akasaki, Han, Hearne, Floro, Chason and Figiel48,Reference Han, Waldrip, Lee, Figiel, Hearne, Petersen and Myers52,Reference Hearne, Chason, Han, Floro, Figiel, Hunter, Amano and Tsong58,Reference Hearne, Han, Lee, Floro, Follstaedt, Chason and Tsong59 that is focused on the same spot as the 930 nm reflectometer and pyrometer. Trimethylgallium (TMGa) and trimethylaluminium (TMAl) were used as group-III precursors for Ga and Al, while NH3 was used as the nitrogen source. Both hydrogen and nitrogen are used as the primary carrier gasses. The “pressure-rotation rate” flow stability diagram based on computational fluid dynamic studies is used to optimize total carrier gas flow and maintain laminar flow, maximize GRs (alkyl consumption efficiency), and growth uniformity under typical high rotational speed [>1000 revolutions per min (rpm)] at selected pressure and growth temperature Reference Mitrovic, Parekh, Ramer, Merai, Armour, Kadinski and Gurary60,Reference Mitrovic, Gurary and Quinn61 conditions.
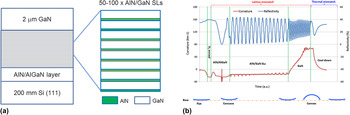
The epitaxy of GaN with AlN/GaN SLs was performed on 200 mm, single side polished, Czochralski (CZ), on-axis Boron-doped, p-type 1.0 mm thick Si (111) substrates, as shown in Fig. 4(a). The growth does not require any pre-growth wafer treatment. The starting Si substrate was first annealed at 1050 °C under H2 ambient for about 5–10 min to remove the native oxide layer. Next, 50–150 μmol/min of TMAl was introduced into reactor for 5–15 s at temperature of 600–900 °C without the presence of NH3 to prevent the formation of amorphous SiN x layer. The buffer layers consist of a 100 nm AlN nucleation layer and a 100 nm Al x Ga1−x N (x = 0.2–0.25) intermediate layer, which serve as crystallographic and morphological templates for the subsequent epitaxy of AlN/GaN SLs. Growth of AlN and AlGaN layers was carried out at temperature above 1000 °C under H2 ambient at a pressure of 75 Torr to minimize parasitic reactions between TMAl and NH3. AlN/GaN SLs with 50–100 pairs were grown over the AlN/AlGaN buffer layer. GaN growth was carried out at higher V/III ratio (>1000) compared to that for AlN (<500) growth. Total flow of carrier gas was selected based on the flow stability diagram to maintain the same residence time for both GaN and AlN growths. Individual layer thickness varied from 3–5 nm for AlN and 10–30 nm for GaN, respectively, in the SL structure. Crack-free 2 μm-thick bulk GaN layers were grown over the SLs and AlN/AlGaN layers at temperature of 1035 °C.
GaN growth with AlN/GaN SLs on 200 mm Si (111) substrates, (a) schematics of structures, (b) evolution of reflectivity, wafer curvature, and corresponding wafer bow during the growth.

An example of the evolution of reflectivity, wafer curvature, and wafer bow during growth is shown in Fig. 4(b). The starting substrate is almost flat with a curvature close to 0 km−1. The wafer bow is proportional to the wafer curvature and the square of the wafer diameter from the equation Reference Armour, Lu, Belousov, Lee and Quinn62 :
 $${\rm{Bow}} = {\rm{Curvature}} \cdot {{{D^2}} \over 8}\quad ,$$
where D is the viewing diameter (7 inch in our study) for the 200 mm wafer. Wafer curvature becomes negative (concave with curvature −20 km−1) with the growth of tensile-strained AlN/AlGaN buffer layers. After the growth of buffer layers, the wafer curvature varies linearly with the thickness of AlN/GaN SLs over the growth time. The change of curvature before and after SLs growth (Δ of SL curvature) is ∼1.5 km−1, as shown in the plot. Significant compressive stress builds up during the growth of the bulk GaN layer over the SLs and the curvature becomes positive with a convex wafer bow and curvature +68 km−1 (Max curvature). The convex curvature decreases rapidly during cool-down due to large tensile stresses resulting from the mismatch in CTE between the Si and grown epilayers. The tensile thermal stress is counterbalanced by the compressive intrinsic stress from the epilayer lattice mismatch, resulting in an almost flat wafer with curvature of −2 km−1 at room temperature (RT curvature). If the tensile thermal stress is not fully compensated by enough compressive stress built up during epitaxy, the ending wafer will be concave and usually accompanied with a high density of epi-cracks.
The thicknesses of the epilayers are measured by white light interference and Al composition of AlGaN layer by photoluminescence (PL) using a high power 266 nm ultraviolet laser. Aluminum composition and AlGaN thickness can be determined from ex-situ triple-axis high resolution x-ray diffraction omega-2 theta scans. The crystalline quality of GaN epitaxial layers was measured using the full width at half maximum (FWHM) of omega-scan rocking curves along the symmetric (002) and asymmetric (102) directions. Triple-axis coupled omega-2 theta scan along the GaN (004) direction was used to determine the period thickness and interface roughness of the SLs. Surface morphology was studied by atomic force microscope (AFM) and the cross-sections of samples were characterized by high resolution transmission electron microscope (TEM). Postgrowth wafer bow was characterized by wafer stress measurement at RT.
III. DISCUSSION
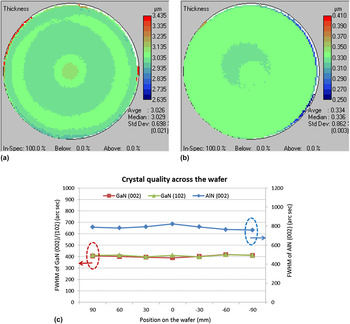
With homogenous alkyl/hydride flow distribution and uniform temperature profile, epilayers show excellent uniformity in thickness, alloy composition, and crystal quality across the 200 mm substrates. GaN and AlN layers show symmetrical concentric pattern for thickness with uniformity of GaN 0.69%, 1σ, and AlN 0.86%, 1σ (without edge exclusion), as illustrated in Figs. 5(a) and 5(b). The crystal quality of GaN and AlN across the 200 mm Si wafer is measured by XRD from multiple locations and plotted in Fig. 5(c), showing an average of FWHM for GaN (002)/(102), and AlN (002) is 402/408 and 785 arc sec, respectively. The variation for FWHM is <2.3%, 1σ from measured points on the diameter across from the wafer notch. Typically, FWHM (102) is more influenced by threading dislocations with a large edge-type content. As a result, the asymmetric FWHM (102) for GaN is relatively broad compared with the symmetric FWHM (002). It was observed that FWHM (102) for the GaN with AlN/GaN SLs has similar or even smaller value compared to FWHM of (002) in our experiments, indicating improved crystal quality with reduced density of edge-type threading dislocations. Reference Heying, Wu, Keller, Li, Kapolnel, Keller and DenBaars63–Reference Kaganer, Brandt, Trampert and Ploog65
Uniformity of GaN and AlN on 200 mm Si, (a) GaN thickness, 0.69%, 1σ, (b) AlN thickness, 0.86%, 1σ, and (c) crystal quality of GaN and AlN across the wafer.

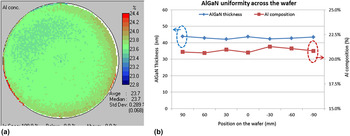
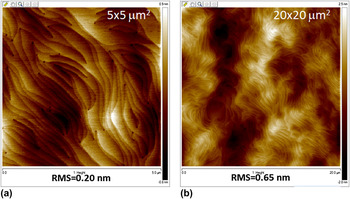
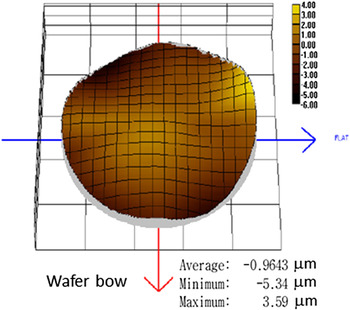
Figure 6(a) shows the AlGaN alloy with an average Al composition of 23.7% and uniformity of 0.29%, 1σ, as measured by PL. Al composition and thickness for AlGaN layers can also be determined by the omega-2 theta XRD scans along GaN (002), which shows a thickness variation of 4% (max-min) and an absolute Al composition range of 0.64% (max-min) as plotted in Fig. 6(b). For the 2 μm stack GaN grown over 100 pairs of AlN/GaN SLs, smooth surfaces are observed by AFM with a root mean square (RMS) roughness of 0.20 nm in a 5 μm2 × 5 μm2 scan and 0.65 nm in a 20 μm2 × 20 μm2 scan, as shown in Figs. 7(a) and 7(b). The dislocation density based on the surface pits from AFM scans is estimated at 4 × 10⁸/cm2. The postgrowth wafer bow is measured by stress measurement at RT, showing a nearly flat wafer with average bow of −0.96 μm and maximum/minimum bow of +3.59/−5.34 μm, as shown in Fig. 8.
Uniformity of AlGaN on 200 mm Si, (a) AlGaN Al composition by PL, 0.29%, 1σ and (b) AlGaN thickness and Al composition across the wafer measured by XRD.

Surface morphology of GaN over AlN/GaN SLs on Si, (a) 5 μm2 × 5 μm2 AFM scan with RMS = 0.20 nm and (b) 20 μm2 × 20 μm2 AFM scan with RMS = 0.65 nm.

Wafer bow of GaN over AlN/GaN SL at RT.

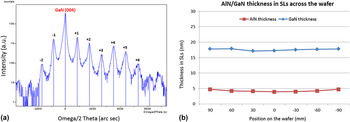
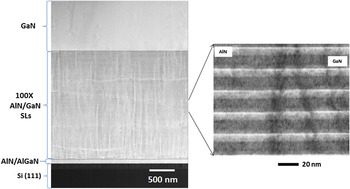
Triple-axis coupled omega-2 theta scans along GaN (004) Bragg reflections show sharp satellite SL peaks up to +sixth order, indicating smooth interfacial quality for the AlN/GaN SLs, as seen in Fig. 9(a). The SL periodicity thickness is fitted as an average of 4.3 nm AlN/17.6 nm GaN from the omega-2 theta scan performed on multiple locations across the wafer. The thickness uniformity of GaN and AlN in SLs is plotted in Fig. 9(b). The periodicity thickness of SLs has variation <2.5%, 1σ based on the measured points. AlN/GaN SLs are effective for dislocation filtering along the growth direction. Figure 10(a) is the cross-sectional TEM image for GaN with 100 pairs of AlN/GaN SLs, showing termination of threading dislocations toward the top-portion of the SLs. Figure 10(b) shows a magnified view of the AlN/GaN SLs with period thickness ∼22 nm, which is consistent with the fitted value from XRD.
AlN/GaN SLs interfacial quality and periodicity thickness by XRD, (a) Triple-axis omega-2 theta scan along GaN (004) peak and (b) thickness of GaN and AlN in SLs across 200 mm Si.

Cross-sectional TEM images of GaN over AlN/GaN SLs on Si (111), (a) cross-sectional TEM image for the GaN over AlN/GaN SLs on Si and (b) enlarged view of AlN/GaN SLs.

A. Effect of GaN and AlN thickness on wafer stress
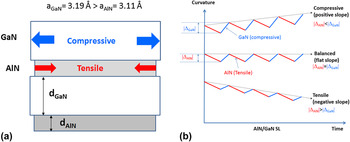
Due to the difference in the lattice constant between GaN and AlN, pseudomorphic growth of thin layers of GaN and AlN in the SLs leads to different types of stress within the GaN and AlN layers. In the case of GaN layer grown on top of AlN layer, GaN will experience compressive stress due to its larger lattice constant (a GaN = 3.19 Å) compared to that of AlN (a AlN = 3.11 Å); On the other hand, AlN will have tensile stress when grown on top of GaN, as illustrated in Fig. 11(a). For uniformly-strained films, the wafer curvature is linearly proportional to the product of film stress and film thickness, based on the Stoney equation. Reference Stoney66,Reference Feng, Huang and Rosakis67
 $${\rm{Curvature}} \propto {{\sigma {h_{\rm{f}}}} \over {h_{\rm{s}}^2}}\quad ,$$
where σ is the film stress, h f and h s are the thickness of film and substrate, respectively. As seen by in situ deflectometer measurements, the curvature increases with a positive slope with the increase of GaN thickness, indicating buildup of compressive stress, while the curvature decreases with a negative slope with the increase of AlN thickness, indicating buildup of tensile stress. The overall stress is the accumulation from the individual AlN and GaN layers, and the wafer curvature changes linearly with the increase of pair of SLs, as shown in Fig. 11(b). If the decrease of curvature during AlN growth is less than the increase of curvature during GaN growth (|ΔAlN| < |ΔGaN|), the wafer curvature will increase with a positive slope and the overall stress for SLs is compressive; a flat slope for the curvature signifies balanced stress from the AlN and GaN layers with |ΔAlN| = |ΔGaN|, and a negative slope of curvature change indicates tensile stress in the SL structure with |ΔAlN| > |ΔGaN|. The change of curvature can be adjusted by the thickness of individual AlN and GaN layers, hence precise stress engineering in the SLs is possible via the change in the periodicity of AlN and GaN.
Effect of GaN and AlN in SLs on wafer curvature, (a) stress during growth of GaN and AlN due to lattice mismatch and (b) examples of curvature evolution and stress during the growth of AlN and GaN in SLs.

The growth of GaN over AlN/GaN SLs will continue to build up the compressive stress and increase the wafer curvature. The final curvature for the full GaN stack containing AlN/GaN SLs at RT is determined by the residual compressive stress built from SLs and GaN during epitaxy after compensation by tensile thermal stress during cool-down. Although curvature change or stress during the growth of top GaN layer cannot be easily tuned under the process conditions, the overall stress in the full GaN stack can be adjusted by the stress level in the SLs.
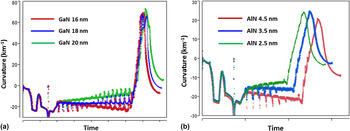
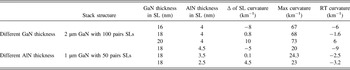
By adjusting the thickness of AlN and GaN layers, the evolution of wafer curvature can be controlled accordingly. Starting with a constant thickness for AlN layer (4 nm), and increasing the GaN thickness (16, 18, and 20 nm), results in more compressive stress build-up in the SLs and an increasing slope of curvature change, as illustrated in Fig. 12(a). In these experiments, the top GaN layer is 2 μm with 100 pairs of AlN/GaN SLs. For constant thickness of GaN (18 nm), the decrease in AlN (4.5, 3.5, and 2.5 nm) thickness results in more compressive stress and increasing slope of curvature change, as shown in Fig. 12(b). The top GaN layer is 1 μm thick, grown over 50 pairs of AlN/GaN SLs for the experimental results showing the effect of AlN thickness on SLs performance. Wafer curvature changes during the growth of SLs (Δ of SL curvature), Max curvature, and RT curvature versus SLs with different GaN thickness and AlN thickness, are summarized in Table I. With the increase in GaN thickness or decrease in AlN thickness in the SLs, more compressive stress builds up and the RT wafer curvature increases.
Effect of thickness of GaN and AlN in SLs on wafer curvature, (a) effect of different thickness of GaN (16, 18, 20 nm) on wafer curvature and (b) effect of different thickness of AlN (2.5, 3.5, 4.5 nm) on wafer curvature.

Δ of curvature of SL, Max curvature, and RT curvature for SL with different thickness of GaN and AlN in SLs.

B. Effect of growth conditions on wafer stress
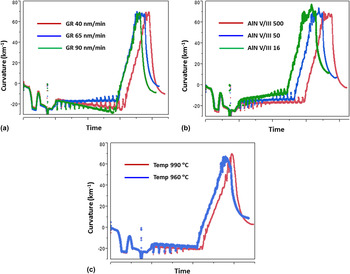
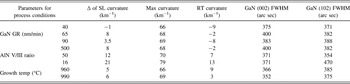
For a given SL growth structure, the growth conditions of GaN and AlN can affect the stress and curvature evolution in the SLs. The experiments described below were carried out with a SL containing AlN and GaN layers of 4 and 17 nm, respectively. Figure 13(a) shows the curvature change for the SLs with different GR of the GaN layer in the SLs. The increase of GaN GR was accomplished through increasing the TMGa flow while keeping the NH3 flow constant. With an increase of TMGa flow to 580 μmol/min (by 1.6 times), the GR of GaN increases from 40 to 65 nm/min, resulting in more compressive stress and an increase of the slope of curvature change. The trend reverses and tensile stress starts to build up by further increasing the GaN GR to 90 nm/min. The trend of curvature change in the SLs with different GaN GR is reflected accordingly in the final RT curvature after cool down, as shown in Table II.
Effect of growth conditions on wafer curvature, (a) effect of GRs of GaN in SLs, (b) effect of V/III ratios for AlN in SLs, and (c) effect of growth temperature of SLs.

Δ of curvature of SL, Max curvature, RT curvature, FWHM of GaN (002) and (102) for SL with different GaN GR, V/III ratio for AlN, and growth temperature.

The change in V/III ratio was accomplished through the decrease of NH3 flow while keeping the TMAl flow constant. At constant TMAl flow of 300 μmol/min, the GR of AlN increases with lower NH3 or V/III ratio, which is indicative of the effects of parasitic reactions on the growth chemistry. At constant period thickness for both AlN and GaN in the SLs, higher compressive stress is built up by lowering the V/III ratio from 500 to 16, as plotted in Fig. 13(b). The trend of curvature change in the SLs with different AlN V/III ratio is reflected in the final RT curvature after cool down, as shown in Table II. With a AlN V/III ratio of 16, crystal quality of the bulk GaN degrades to 470 arc sec for FWHM (102) and much rougher surface (RMS > 0.6 nm in a 5 μm2 × 5 μm2 scan) by AFM is observed.
Since the film growth starts by the nucleation and coalescence of discreet nucleated islands, intrinsic stress in the films can be caused by the formation of grain boundaries during the coalescence of neighboring nucleation islands to reduce the surface energy, otherwise known as growth stress. Reference Hoffman68–Reference Raghavan, Weng, Dickey and Redwing71 The growth stress can be either tensile or compressive and is dependent on the grain diameters, surface roughness, and corresponding threading dislocation densities. Reference Dadgar, Poschenrieder, Reiher, Blasing, Christen, Krtschil, Finger, Hempel, Diez and Krost16,Reference Bottcher, Einfeldt, Figge, Chierchia, Heinke, Hommel and Speck72–Reference Gao and Nix74 The grain size of GaN is affected by growth conditions during epitaxy, such as growth pressure, Reference Wickenden, Koleske, Henry, Gorman, Twigg, Fatemi, Freitas and Moore75 or GRs. Reference Wang, Pavlidis and Singh76–Reference Yang, Uchida, Mishima, Kasai and Gotoh79 Additionally, V/III ratio has a strong effect on AlN growth affecting gas-phase parasitic adduct-forming reactions, surface mobility of Al species, and consequently GRs, surface morphology, and grain structures. Reference Gherasimova, Cui, Ren, Su, Wang, Han, Higashimine and Otsuka80,Reference Feng, Wei, Yang, Chen, Wang, Kong, Zhao and Liu81 The observed complex effect of GaN GR and V/III ratio during AlN growth on stress and curvature evolution can be possibly explained by the different growth stress related to different grain size and coalescence of grain boundaries. The increase in GR for GaN (with higher TMGa) or decrease in the V/III ratio for AlN tends to build more compressive stress for the SLs. However, a further increase in GR to 90 nm/min or 5.4 μm/h of GaN reverses the trend of curvature change. The GaN with higher GR could lead to incomplete coalescence or possible generation of voids between larger size nuclei, which results in stress relaxation or absorption and create tensile stress in the SLs. Reference Krishnan, Lee, Li, Su, Lee and Paranjpe82
The effect of growth temperature was tested between 960 and 990 °C as measured by in situ pyrometry on the Si wafer surface. The GRs of both GaN and AlN increase with the decrease in growth temperature. By adjusting growth time and maintaining constant period thickness, no significant difference in the curvature change during the growth of SLs was observed, as shown in Fig. 13(c). Slightly improvement of crystal quality for the GaN with SLs grown at 990 °C compared with that at 960 °C, showing XRD (002) and (102) of FWHM 352 and 375 arc sec in Table II.
IV. CONCLUSIONS
Excellent uniformity in thickness, alloy composition, and crystal quality across the 200 mm Si substrates was observed in epilayers grown using a Veeco's Propel™ single wafer, rotating disk MOCVD reactor. The Turbodisc® vertical reactor is designed to have homogeneous alkyl/hydride flow distribution and uniform temperature profile, which translates into excellent uniformity and concentric symmetry in epitaxial layer thickness, alloy composition, and consequently uniform stress across the wafer. GaN thickness of 0.69%, 1σ, AlN thickness 0.86%, 1σ, and Al composition in AlGaN of 0.29%, 1σ were demonstrated on 200 mm Si wafers without edge exclusion. The uniformity in epilayer thickness and alloy composition, together with uniform temperature profile, results in uniform and controllable stress in epilayers across large size substrates. Crack-free 2 μm GaN layers on 200 mm (111) Si were grown over structures containing 50–100 pairs of AlN/GaN SLs having periods of 3–5 nm/10–30 nm. Smooth surfaces with excellent crystal quality were observed; roughness of 0.20 nm in a 5 μm2 × 5 μm2 AFM scan, and 0.65 nm in a 20 μm2 × 20 μm2 AFM scan; and 352 and 375 arc sec FWHM for (002) and (102) XRD rocking curves, respectively. Effective dislocation filtering and sharp interfaces between AlN and GaN were confirmed by TEM, and omega-2 theta scans along GaN (004) direction.
Due to the difference in the lattice constant between GaN and AlN, the stress in the SLs can be precisely adjusted to be either compressive or tensile via the change in the thickness of GaN and AlN, resulting in controllable wafer curvature/bow during epitaxy at high temperature and after cool down. For a given SL structure, the GR of GaN and the V/III ratios during AlN growth had affected the stress of the SLs structure, which might be explained by the growth stress related to the different grain size and coalescence of grain boundaries under different growth conditions. We did not observe a significant effect of growth temperature on the stress of the SLs structure, within the range of conditions covered by our study.
ACKNOWLEDGMENT
The authors would like to thank the characterization group (D. Byrnes, Y. Li, A. Krahnert, and F. Ramos) at Veeco MOCVD operations for material characterization.