

1. Introduction
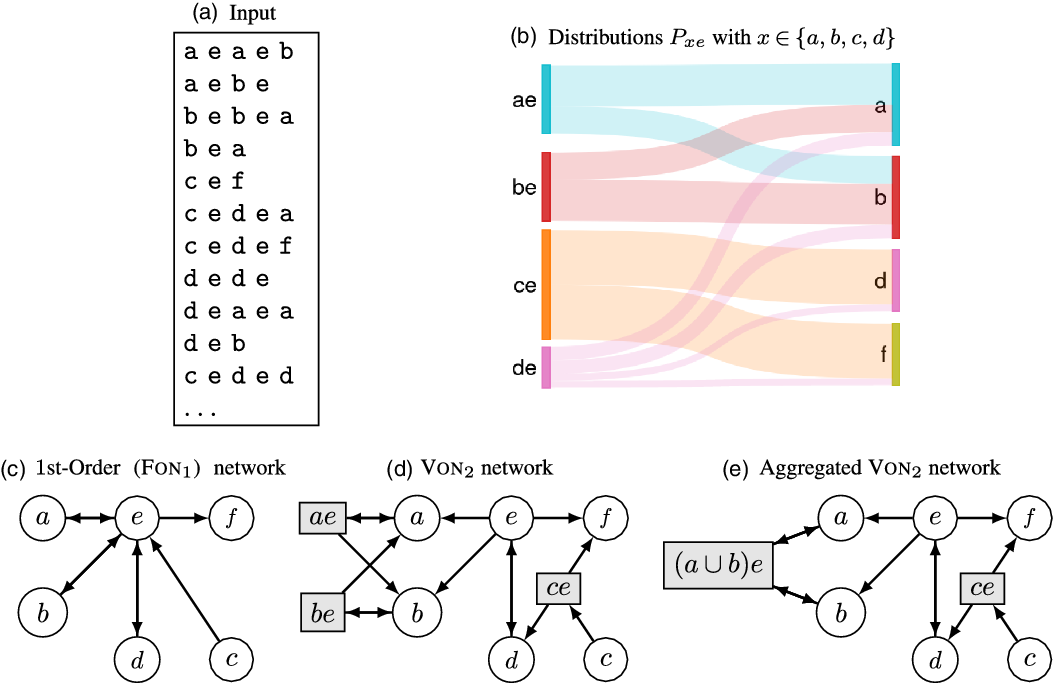
Networks are powerful tools to represent relations between entities. They can, for example, be used in the context of trajectory and mobility analysis to encode the amount of movements between different locations. These movements can correspond to sequences of locations (Figure 1(a)) tracking the order in which a traveler (ship, car, etc.) visited these places. Classic approaches only look at pairwise interactions obtained from input sequences, and this results in a first-order network (Figure 1(c)) where weighted edges represent transition probabilities between locations. The corresponding model is a memory-less first-order Markov model where the probability for a random walker to visit a given place depends only on its current location.
Example of inputs and variable-order networks representing dependencies when visiting locations
 $\mathcal{A}=\{a,b,c,d,e,f\}$
. When looking at successive pairwise interaction of set
 $\mathcal{S}$
in (a) a natural representation is the first-order network (c). However, we can identify second-order dependencies in (b). For instance, when coming from
 $a$
the flow tends to either return to
 $a$
or go to
 $b$
after visiting
 $e$
. The VON
 $_2$
network in (d) only includes relevant dependencies. Subsequence
 $de$
is not relevant extension of the sequence
 $e$
since knowing we visited
 $d$
before
 $e$
does not impact the prediction of next visited location. Second-order nodes are displayed as gray rectangles. The set
 $\mathcal{V}(e)=\{ae,be,ce,e\}$
of nodes are representations of the location
 $e$
. In our aggregated model (e), multiple representations can be merged if they correspond to similar distributions. Here, the probability distribution
 $P_{ae}$
is close enough to
 $P_{be}$
to justify using this smaller model. Node
 $(a\cup b)e$
encodes the event “the traveler came either from
 $a$
or
 $b$
before visiting
 $e$
.”
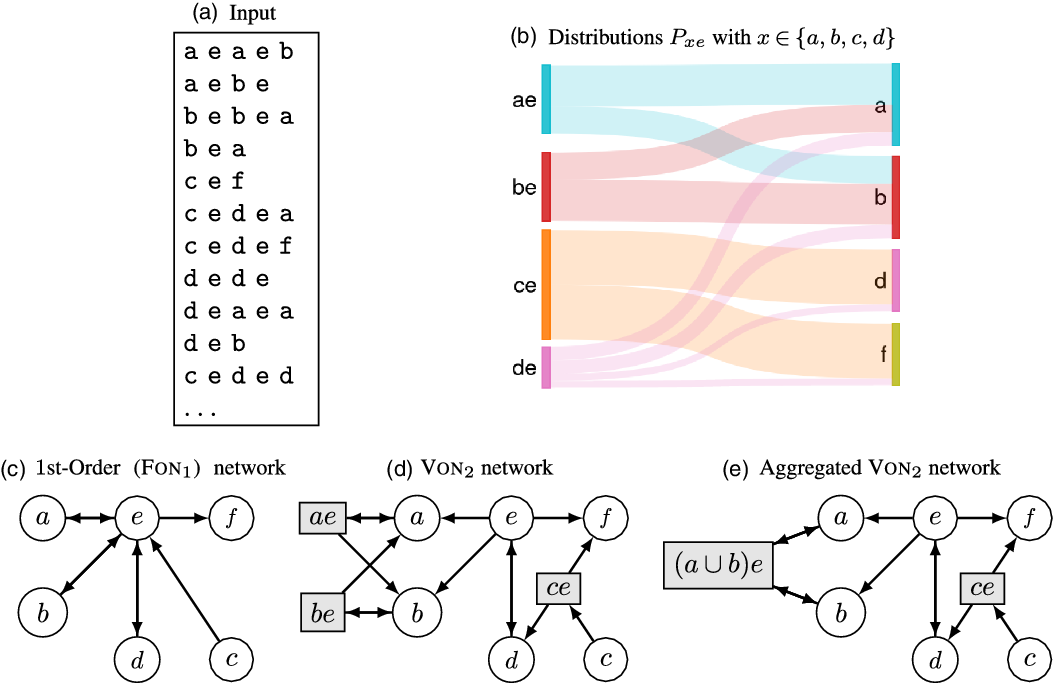
Recent works (Xu et al., Reference Xu, Wickramarathne and Chawla2016; Scholtes, Reference Scholtes2017) suggest that this representation cannot capture the spatial dependencies existing in the input sequences (Figure 1(b)). Indeed, they show that random walks on first-order networks are often poor approximations of the behavior of travelers. “Higher-order” networks have been proposed in order to improve the network representation and go beyond the classic dyadic relation (Eliassi-Rad et al., Reference Eliassi-Rad, Latora, Rosvall, Scholtes and Dokumente2021). In this paper, we use this term to refer specifically to network models designed to represent indirect dependencies in sequential data. In such a model, different representations of locations (sometimes called “memory nodes”) are used as nodes to encode these dependencies. In this context, most of the studies focused on a first type of higher-order networks: the fixed-order networks of order
 $k$
(FON
 $_k$
), where the probability to visit a location depends on the last
 $k$
visited places (Rosvall et al., Reference Rosvall, Esquivel, Lancichinetti, West and Lambiotte2014; Scholtes, Reference Scholtes2017). Other authors (Xu et al., Reference Xu, Wickramarathne and Chawla2016; Saebi et al., Reference Saebi, Xu, Kaplan, Ribeiro and Chawla2020a) proposed the use of a second type of higher-order networks: VON that only include statistically relevant dependencies (Figure 1(d)).
The motivation behind the design of these models is to improve the relevance of random walk-based mining methods such as PageRank ranking (Brin & Page, Reference Brin and Page1998) and Infomap clustering (Rosvall et al., Reference Rosvall, Axelsson and Bergstrom2009). For example, the Infomap algorithm was applied to VON built from a maritime transportation dataset (Xu et al., Reference Xu, Wickramarathne and Chawla2016). Since ports may have many representations as nodes in the network, the partition of nodes found actually corresponds to overlapping clustering of the ports. A possible application is the prediction of invasion of an ecosystem by non-indigenous aquatic species (Saebi et al., Reference Saebi, Xu, Kaplan, Ribeiro and Chawla2020b).
One important argument (Xu et al., Reference Xu, Wickramarathne and Chawla2016; Saebi et al., Reference Saebi, Xu, Kaplan, Ribeiro and Chawla2020a) for the use of VON was that algorithms such as Infomap can be used directly on VON since these are defined as a weighted graph. This paper aims to investigate this claim with a focus on clustering algorithms. Several higher-order networks can be built from the same input dataset; for instance, we can imagine smaller VON models that can also accurately predict travelers’ movements (see Figure 1(e)). Even though they contain similar features, we show that, even if trajectories are modeled using a second-order Markov process, the difference in the number of representations of locations has important effects on the results. Our results support the idea that, even if higher-order dynamics can be encoded in a classic weighted graph, mining tools designed for memory-less networks may not be adapted to capture these dynamics. Rather, future network algorithms should be specifically designed to take the multiplicity of higher-order network representations into account.
The contributions of this paper are as follows:
Analysis of the impact of multiple representations of locations on the Infomap algorithm (Rosvall et al., Reference Rosvall, Axelsson and Bergstrom2009).
New model of aggregated VON (limited to a maximum order of
 $2$
) that produces a more parsimonious representation of the input sequences.

The paper is organized as follows. We discuss the semantic of “higher-order networks” and works related to their clustering in Section 2. Notations and the construction of VON, FON, and Agg-VON models are given in Section 3, and then, three potential effects of the existence of memory nodes in the context of the Infomap clustering algorithm are presented. In Section 4, we show the effect of aggregation on synthetic benchmark networks, and in the context of real sequences datasets, we show that our model is still accurate and that there are important differences in the clusterings found with it. As our model is limited to a maximum order of
 $2$
, the generalization of our aggregation procedure to any order as well as other possible adaptations of network analysis tools are discussed in Section 5.
2. Related Works
The terms “high-order” or “higher-order” might be confusing as they are used to describe different concepts in data mining and network analysis. Eliassi-Rad et al. (Reference Eliassi-Rad, Latora, Rosvall, Scholtes and Dokumente2021) broadly define “higher-order networks” as generalizations of graph representations designed to “capture more than dyadic interactions.” Examples include subset dependencies found in co-authorship data, spatial dependencies found in transportation’s networks or indirect dependencies found in sequential data. The first example corresponds to “higher-order interactions” as discussed in Battiston et al. (Reference Battiston, Cencetti, Iacopini, Latora, Lucas, Patania and Petri2020). A good survey of these different representations can be found in Torres et al. (Reference Torres, Blevins, Bassett and Eliassi-Rad2021). Following the terminology used in this survey, we refer here to “higher-order” as models of indirect dependencies extracted from sequential data.
Indeed, this term directly refers to higher-order Markov models. They are used in sequence prediction for compression algorithms (Begleiter et al. Reference Begleiter, El-Yaniv and Yona2004) or sequences classification (Ching et al., Reference Ching, Fung and Ng2004; Chen et al., Reference Chen, Sun, Chen, Zhang and Wang2021). For the latter, the distance between a sequence and a cluster of sequences is defined as the likelihood of this sequence in a model built from the sequences in the cluster. The number of previous steps used can be fixed to a given
 $k$
or inferred statistically. We will refer to this subset of higher-order models as fixed-order models. An important drawback is that the number of parameters of the models grows exponentially with
 $k$
. Chen et al. (Reference Chen, Sun, Chen, Zhang and Wang2021) use a more general form of models called variable-order Markov models. In these models, a set of contexts of various lengths is used instead (Ron et al., Reference Ron, y. and Tishby1994).
Accordingly, we shall refer in this paper to fixed-order networks of order
 $k$
and variable-order networks denoted as FON
 $_k$
and VON, respectively. Both are special cases of higher-order networks and include “memory nodes” in order to encode the transition probabilities of the corresponding higher-order Markov models. As the underlying model is a better predictor of sequences, a random walk performed on these networks should better represent the system that produces those sequences. In this context, most studies were dedicated to the class of FON
 $_k$
. Finding the
 $k$
that leads to the best representation was addressed in Scholtes (Reference Scholtes2017). In a recent perspective article, Lambiotte et al. (Reference Lambiotte, Rosvall and Scholtes2019) highlight the importance of model selection and the need for alternatives such as VON.
A VON model was introduced in Xu et al. (Reference Xu, Wickramarathne and Chawla2016), although the authors use the broader term “higher-order networks” or HON to name their model. The main idea is to only keep memory nodes that actually add information about a random walker behavior. The authors implement this idea in an algorithm that recursively searches for contexts that correspond to significantly different transition probabilities when compared to shorter contexts already found (we precisely described the procedure in the following section). The implementation of this algorithm was further improved in Krieg et al. (Reference Krieg, Kogge and Chawla2020). The concept of significance of “contexts” is also used in sequence classification although significance is here defined as the number of times a given context is found in the input data (Chen et al., Reference Chen, Sun, Chen, Zhang and Wang2021). In this case, even a small difference in transition probabilities can be deemed important. Saebi et al. (Reference Saebi, Xu, Kaplan, Ribeiro and Chawla2020a) then further developed the model of Xu et al. (Reference Xu, Wickramarathne and Chawla2016) by introducing a threshold function to assess the significance of the difference between transition probabilities making the generation of VON parameter-free.
Clustering of FON
 $_2$
networks was discussed in Rosvall et al. (Reference Rosvall, Esquivel, Lancichinetti, West and Lambiotte2014). The authors introduced a generalization of the Infomap algorithm (Rosvall et al., Reference Rosvall, Axelsson and Bergstrom2009) in order to find overlapping clustering of the locations. The Infomap algorithm is also used by Xu et al. (Reference Xu, Wickramarathne and Chawla2016); however, the algorithm was, in this case, directly applied on the VON representations. In this paper, we investigate the choice of higher-order model selection on the clustering results of the Infomap algorithm. In particular, we investigate the effect of using sparser model achieved by merging memory nodes with similar transition probabilities. A similar idea was previously suggested in Jääskinen et al. (Reference Jääskinen, Xiong, Corander and Koski2014) resulting in a model called Sparse Markov Chains. The goal of the authors was to improve the rate of compression and the classification of DNA sequences and protein data. However, their contribution is based on mixed-order models (a combination of fixed-order model of order lesser or equal to
 $k$
).
In the context of VON, the effect of multiple representations on PageRank values was investigated in Coquidé et al. (2022). In this context, the PageRank of locations was defined as the sum of the PageRank values of its representations. It was shown that the non-uniformity of the number of representations per locations leads to a bias.
3. Definitions and methods
We describe here the notations used in this paper and the construction of VON. The application of the Infomap clustering algorithm to VON is then discussed. We highlight the influence of the number of location per location. A more parsimonious network (Agg-VON
 $_2$
) is then introduced.
3.1 VON representation
Let
 $\mathcal{A}$
be the set of locations (itemset). An input dataset corresponds to a set
 $\mathcal{S}=\{s_1,s_2,\ldots \}$
of sequences
 $s_i=\sigma _1 \sigma _2 \sigma _3\ldots$
where all
 $\sigma _j\in \mathcal{A}$
. For a sequence
 $s$
of symbols in
 $\mathcal{A}$
, the order of
 $s$
denoted
 $|s|$
is the length of
 $s$
and the count (or flow) of
 $s$
denoted
 $c(s)$
is the number of occurrences of
 $s$
in dataset
 $\mathcal{S}$
. We will also use
 $C_s= (c(s\sigma _{1}), c(s\sigma _{1}),\dots, c(s\sigma _{m}) )$
to denote the occurrences of every possible location
 $\sigma _{i}$
following the sequence
 $s$
. Let
 $s=s_1 s_2$
be a sequence resulting in the concatenation of sequences
 $s_1$
and
 $s_2$
. We say that
 $s_2$
is a suffix of
 $s$
and
 $s_1$
is a prefix of
 $s$
. The interactions and dependencies within the system that produced the sample
 $\mathcal{S}$
may loosely be called the flow dynamic. In this context, we are interested in inferring the possible locations visited by a traveler after a given set of locations.
Definition 1.
Transition probability.
For a sequence
 $s$
, the transition probability from
 $s$
(context) to
 $\sigma \in \mathcal{A}$
(target) is defined as
 \begin{equation} p(\sigma \mid s) = \frac{c(s\sigma )}{\sum _{\sigma ' \in \mathcal{A}} c(s\sigma ')} \end{equation}
where
 $s\sigma$
is the concatenation of symbols in
 $s$
followed by
 $\sigma$
. Also, the probability distribution of locations
 $\sigma _{i}$
visited after context
 $s$
is denoted as
 $P_s = (p(\sigma _{1} \mid s), p(\sigma _{2} \mid s),\dots, p(\sigma _{m} \mid s) )$
.
The probability in Equation (1) is the maximum likelihood estimate given a sample
 $\mathcal{S}$
. However, we will not use special notation to distinguish it from an unknown true distribution. The main difference between the compared models here is going to depend on the set of contexts
 $s$
for which transition probabilities are defined.
Fixed-order models usually rely on taking all possible contexts of order
 $k$
. Obviously, the size of the model is
 $O(|\mathcal{A}|^k)$
. The VON model studied here aims at finding a subset of relevant contexts. They can be expressed as extension of each other.
Definition 2.
Relevant extension (Saebi et al. (Reference Saebi, Xu, Kaplan, Ribeiro and Chawla2020a)).
For a sequence
 $s'$
and
 $s$
one suffix of
 $s'$
, we say that
 $s'$
is a relevant extension of
 $s$
if
 \begin{equation} D_{KL}\left (P_{s'}||P_s \right ) \gt \frac{\alpha |s'|}{\log _2(1+c(s'))} \end{equation}
where
 $D_{KL}$
is the Kullback-Leibler divergence (in bits) and
 $\alpha \geq 1$
is the threshold multiplier.
In Figure 1(d), the knowledge that we came from
 $a$
before visiting
 $e$
is relevant as we can better predict the next visited location. Therefore,
 $ae$
is a relevant extension of
 $e$
. However,
 $de$
is not since knowing that we came from
 $d$
does not add significantly more information (as expressed by
 $D_{KL}$
) that we already had. In general, it is possible to have a
 $3$
rd or higher-order extension
 $s=\sigma _1\sigma _2\sigma _3 \ldots$
identified as relevant while some of the suffixes of
 $s$
are not. We can see from the right part of Equation (2) that it is increasingly harder for high order and sparsely observed subsequences to be relevant. Saebi et al. (Reference Saebi, Xu, Kaplan, Ribeiro and Chawla2020a) use a value of
 $\alpha = 1$
. We can use a higher
 $\alpha$
value to construct more parsimonious networks. In the experiments, we use this parameter to evaluate the accuracy of the aggregated model described in Section 5.1.
The VON constructed with dataset
 $\mathcal{S}$
using the method of Saebi et al. (Reference Saebi, Xu, Kaplan, Ribeiro and Chawla2020a) with threshold multiplier
 $\alpha$
is denoted VON
 $(\alpha )=(\mathcal{V},\mathcal{E},w)$
. In the rest of the paper, we will just call it VON when we assume
 $\alpha =1$
. The general idea is to build a graph where each location
 $\sigma \in \mathcal{A}$
is represented by multiple nodes corresponding to its extensions. We say that these nodes are the representations of
 $\sigma$
. We use the sequences as node labels and we refer in this case to the terms “nodes” and “sequences” interchangeably.
The construction of VON is done in two phases. First, we extract the set of relevant extensions. Starting from the set
 $\mathcal{A}$
, the relevant extensions are found using a recursive procedure (order
 $1$
sequences
 $\{\sigma \in \mathcal{A}\}$
are always considered as relevant). An upper-bound of
 $D_{KL}$
can be used to stop the recursion and the algorithm does not require a maximum order parameter to stop the search. The set of nodes
 $\mathcal{V}$
will include all detected relevant extensions. Also for each extension
 $s=\sigma _1\sigma _2\sigma _3\ldots \in \mathcal{V}$
, all of its prefixes are added to
 $\mathcal{V}$
even if they are not relevant extensions in order to guarantee that the node
 $s$
is reachable (see Proposition 1 below).
Second, the edge set
 $\mathcal{E}$
and the weights
 $w$
are defined as follows. Let
 $s \in \mathcal{V}$
and
 $\sigma \in \mathcal{A}$
such that
 $p(\sigma |s)\gt 0$
, VON contains a link
 $s \rightarrow s^{*}\sigma$
of weight
 $w(s \rightarrow s^{*}\sigma ) = p(\sigma |s)$
where
 \begin{equation} s^{*} = \arg \max _{s'\sigma \in \mathcal{V}} \{|s'|, s' \text{ is a suffix of } s\} \end{equation}
For example, let
 $s=abc$
and
 $s^{*}\sigma =bc\sigma$
be relevant extensions of
 $c$
and
 $\sigma$
respectively then there will be a link
 $s \rightarrow s^{*}\sigma$
if
 $abc\sigma$
is not a relevant extension of
 $bc\sigma$
and
 $p(\sigma |s)\gt 0$
. In Figure 1(d), links
 $x \rightarrow e$
in the first-order network are replaced by links
 $x \rightarrow xe$
if
 $x\in \{a,b,c\}$
. Note that this definition of the edge set is a shorter reformulation of the idea given by Saebi et al. (Reference Saebi, Xu, Kaplan, Ribeiro and Chawla2020a) which only provides a procedure to construct the set
 $\mathcal{E}$
involving edge rewiring.
Property 1.
Random walk as variable-order Markov model simulation
Let VON
 $=(\mathcal{V},\mathcal{E},w)$
and
 $s=\sigma _1\sigma _2\ldots \sigma _m \in \mathcal{V}$
be a representation of
 $\sigma _m$
, there exists a path
 $\sigma _1 \rightarrow \sigma _1\sigma _2 \rightarrow \ldots \rightarrow s$
followed by a random walker starting in
 $\sigma _1$
with probability
 $\prod _{i=2}^m p(\sigma _i|\sigma _1\ldots \sigma _{i-1})\gt 0$
.
Proof.
By definition, each
 $(\sigma _1,\sigma _1\sigma _2,\ldots,s)$
is a labeled node of
 $\mathcal{V}$
as prefix of the relevant extension
 $s$
. Let
 $s'_{i}$
be the prefix of order
 $i \lt m$
of
 $s$
. Since
 $s'_{i}\sigma _{i+1}$
is also a prefix of
 $s$
, we have
 $c(s'_{i}\sigma _{i+1})\gt 0$
so there is an edge
 $e=(s'_{i} \rightarrow s'_{i}\sigma _{i+1}) \in \mathcal{E}$
with
 $w(e) = p(\sigma _{i+1}|s'_{i})\gt 0$
by definition since
 $s'_{i}$
is the largest suffix of
 $s'_{i}$
(Equation (3)).
The above property shows that a random walk on VON corresponds to a simulation of the variable-order Markov model composed of the selected subsequences of
 $\mathcal{V}$
. A random walker can follow the higher-order dependencies detected in the input dataset. When restricted to a maximal order of
 $k$
(i.e. when stopping the recursive extraction of extension at order
 $k$
), the returned network is called VON
 $_k$
. For a higher-order network, the set of
 $k$
th-order nodes is
 $\mathcal{V}_k \subseteq \mathcal{V}$
. Moreover, the set of the
 $k$
-order nodes corresponding to representations of a location
 $v \in \mathcal{A}$
is denoted
 $\mathcal{V}_k(v)$
. Note that VON
 $_k$
can still be viewed (even with
 $k=2$
) as a variable-order model since not all extensions of order
 $k$
are kept as relevant.
The fixed-order network FON
 $_k=(\mathcal{V}_F,\mathcal{E}_F,w_F)$
is built by taking all subsequences of length
 $k$
in
 $\mathcal{S}$
as the set of nodes
 $\mathcal{V}_F$
while
 $\mathcal{E}_F$
and
 $w_F$
definition is similar to VON. As such, FON
 $_k$
corresponds to a subgraph of the De Bruijn graph of length
 $k$
over alphabet
 $\mathcal{A}$
.
3.2 Clustering of VON using Infomap
Node partitioning aims at identifying well-connected subgraphs that are sparsely connected to the rest of the network. Several contributions in this domain gave different formal definitions to this idea in the form of quality measures to optimize. Dao et al. (Reference Dao, Bothorel and Lenca2020) give a comprehensive review and comparison of the most commonly used strategies. The Map Equation (Rosvall et al., Reference Rosvall, Axelsson and Bergstrom2009) denoted
 $ L(\mathcal{C})$
can be viewed as a description length metric of the partition
 $\mathcal{C}=\{\mathcal{C}_1,\mathcal{C}_2,\ldots,\mathcal{C}_m\}$
. For a graph
 $\mathcal{G}=(\mathcal{V},\mathcal{E},w)$
, the best partition of
 $\mathcal{V}$
corresponds to the best two-level encoding of random walks in
 $\mathcal{G}$
.
Let
 $\pi _v$
be the steady-state probability that a random walk visits node
 $v \in \mathcal{V}$
. In a one-level encoding, an optimal binary code for node
 $v$
(called codeword) would be of length
 $\log _2(\pi _v)$
and the expected usage of the codeword per step of a random walk is
 $\pi _v$
. The average number of bits encoding a random walk using a one-level encoding is therefore given by
 $H(\{\pi _v\}_{v \in \mathcal{V}}) = \sum _{v \in \mathcal{V}} \pi _v \log _2(\pi _v)$
, that is, the entropy of the visit probabilities for nodes in
 $\mathcal{G}$
.
Using a two-level encoding, it is possible to achieve a lower code length. Indeed, the second level of encoding assigns enter and exit codewords to clusters. A random walk leaving cluster
 $\mathcal{C}_1$
and entering cluster
 $\mathcal{C}_2$
would use the exit codeword of
 $\mathcal{C}_1$
and the enter codeword of
 $\mathcal{C}_2$
. This allows for a codeword to be reused for nodes belonging to different clusters. If clusters are well separated, the increase in length due to enter/exit codewords will be compensated by the reuse of nodes’ codewords.
The algorithm called Infomap aims at minimizing the objective function
 $L$
using a fast greedy multi-level procedure. Note that the algorithm does not actually find the best two-level encoding. Rather, the Map Equation
 $L(\mathcal{C})$
is defined as the theoretical minimum average number of bits per step of the random surfer.
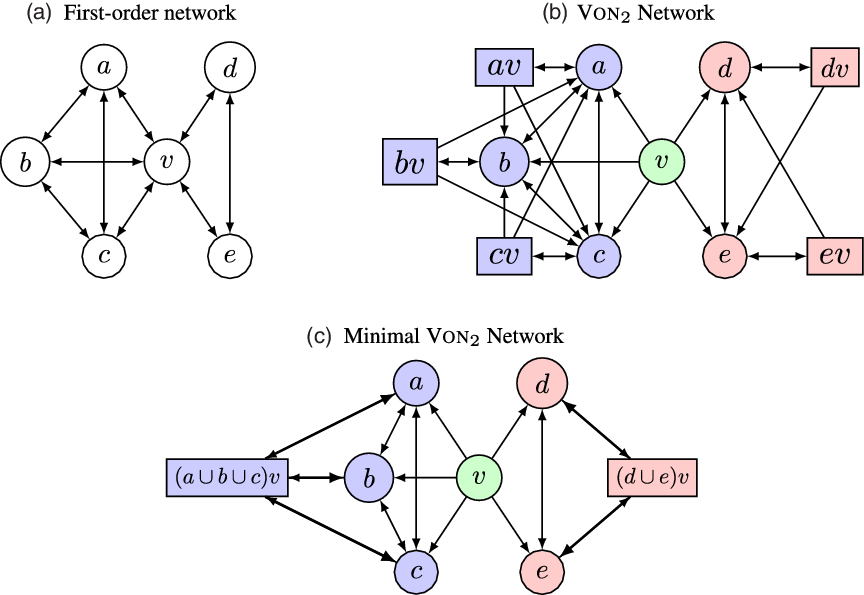
The application of Infomap to higher-order networks is natural. Indeed, different representations can be clustered into different groups. This corresponds to the idea that representations of a same location encode different behaviors. Considering the example given in Figure 2(b), the different representations of location
 $v$
perfectly capture the flow dynamic (i.e. a traveler can never leave a given clique). A clustering algorithm should return the node partition corresponding to the three colors. From this partition, we can construct more general clustering by assigning to each location the set of clusters where at least one of its representations was found, resulting in an overlapping clustering of the locations (Lancichinetti et al., Reference Lancichinetti, Fortunato and Radicchi2008).
2 Cliques example. Assume a graph (a) made of two cliques
 $\{v,a,b,c\}$
and
 $\{v,d,e\}$
. The sequences
 $\mathcal{S}$
are constructed as follows: a traveler picks any outgoing edge at random. However, if it reaches
 $v$
, it will return to another node of the clique it came from. The network VON
 $_2(\mathcal{S})$
(b) then includes one representation of
 $v$
for each other node, and all edges leaving the same node have the same weight. In MIN-VON
 $_2(\mathcal{S})$
(b) the representations of
 $v$
are merged according to the known flow dynamic and include only two representations of
 $v$
. The color indicates the partition that should be found by the clustering algorithm. When projecting on the locations,
 $v$
will be found in
 $3$
clusters (
 $1$
is trivial).

As said previously, it was suggested that we could directly apply Infomap algorithm on VON (Xu et al., Reference Xu, Wickramarathne and Chawla2016) without any adaptation, that is, we can consider VON as a “simple” first-order network in this context. However, the multiplicity of representations may have important effects on the algorithm. In the example above, another network can be built with fewer representations (see Figure 2(c)). Notice it also splits vertices into two strongly connected components. We refer to this alternative higher-order model as minimal and call it MIN-VON
 $_2$
. In the simple case of Figure 2, one could expect the result of an algorithm to correspond to the same overlapping clustering. In the general case, we argue that the number of “additional” representations of VON when compared to an ideal minimal model has three potential effects discussed next.
-
Effect on the number of codewords per cluster. When Infomap is applied to
${VON}$
, two representations of the same location belonging to the same clusters are given different codewords. This may make the detection of clusters containing many representations of the same location harder. This issue has already been identified by Rosvall et al. (Reference Rosvall, Esquivel, Lancichinetti, West and Lambiotte2014) for FON
$_2$
networks. They suggested a modification of Infomap in order to give the same codeword to representations of the same location. Indeed, the more a location is represented in a cluster the larger the contribution of this cluster to the Map Equation will be. For example, in the VON
$_2$
network in Figure 2(b), we use three codewords for each of the nodes
$\{av,bc,cv\}$
. The code length achieved for the clustering would therefore be higher than the one achieved for the MIN-VON
$_2$
network in Figure 2(c) where there is only one representation of a location per cluster. -
Effect on rate of codewords usage. Remember that steady-state probabilities of a random walker are used to compute the rate at which codewords are used in the Map Equation. In order to guarantee the uniqueness of
$\pi$
’s values, a random walk must be turned into a random surfer with a positive probability
$\tau$
to teleport to any given node at each step. Infomap uses the usual
$\tau =0.15$
. The
$\pi$
values therefore correspond to the PageRank metric (Brin and Page Reference Brin and Page1998). The values associated with each node are computed at the beginning of the algorithm. The teleportation mechanism creates discrepancies between the VON
$_2$
and MIN-VON
$_2$
models (Coquidé et al., 2022) even assuming the first effect is corrected, that is, we use a similar codeword for representations of a location that belongs to the same clusters. In the example of Figure 2, assuming we are correcting for the first effect, the probability for a random surfer to use the codeword associated with nodes
$(av,bc,cv)$
after a teleportation is
$\frac{3}{10}$
for VON
$_2$
and
$\frac{1}{8}$
(less than half) for MIN-VON
$_2$
.This second effect can therefore also make the identification of larger clusters difficult. Indeed, the more a cluster contains representations the more its enter, exit, and nodes codewords are used. In the minimal model, the
$\pi$
rates are also biased due to the different number of representations but to a lesser degree. Even though a random surfer is more likely to visit a representation of location belonging to different clusters, there is, by definition, only one representation per cluster. -
Effect on the solution space exploration. The Infomap algorithm follows a hierarchical greedy procedure, starting with a partition where each representation is assigned to a single cluster. As such, regrouping the representations of a location in the same clusters requires as many modifications as the number of representations in each cluster. The chance of running into local minima is therefore higher.


We conclude that there are several reasons why we should try to compare clustering achieved by VON and those achieved on a more parsimonious network model. The fact that the Map Equation
 $L$
is affected by the number of representations used does not means that the results of Infomap will be worse. However, the experiments detailed in Section 4.1 show that it is the case even when considering only second-order dynamics.
3.3 Aggregated VON
$_2$
model

In the previous section, the minimal VON model is built from an underlying known clustering. In order to access the relevance of parsimonious models in real case studies, we define here our aggregated model of VON
 $_2$
called AGG-VON
 $_2$
. The underlying hypothesis we use to get closer to a minimal model is that representations having similar output transition probabilities will belong to the same clusters. This is clear when looking at the example in Figure 2. As for the previous case study, we assume that the flow dynamic is captured at a maximum order of
 $2$
. We will clarify this assumption in Section 5.1. We first define the concept of merging representations and then introduce the criteria that we use to obtain an aggregated model. This leads to the definition of the Algorithm 1.
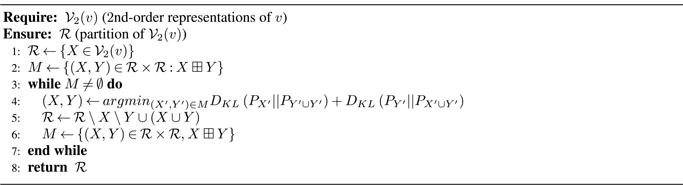
Merge second-order representations of v

Definition 3.
Merged representation.
For
 $v \in \mathcal{A}$
a location, we call merged representation a subset
 $X \subseteq \mathcal{V}_2(v)$
and for
 $\sigma \in \mathcal{A}$
we define
 $c(X\sigma ) = \sum _{x_1x_2 \in X} c(x\sigma )$
as the merged flows of
 $X$
and
 \begin{equation} p(\sigma |X) = \frac{ c(X\sigma )}{\sum _{\sigma ' \in \mathcal{A}} c(X\sigma ')} \end{equation}
as the transition probabilities of
 $X$
to
 $\sigma$
. As with Def.
1
,
 $P_X$
(
 $C_{X}$
) shall denote the probability (flow) distribution associated with symbols following any sequence in
 $X$
.
This generalized form of transition probability can be interpreted as the probability of arriving at location
 $\sigma$
given the fact that we are in location
 $v$
having visited one of the locations
 $x$
such that
 $xv \in X$
.
Definition 4.
Possible Merge.
Let
 $X,Y$
be two disjoint merged representations of
 $v$
. We say that
 $(X,Y)$
can be merged or
 $X \boxplus Y$
if the following inequalities hold
 \begin{align} D_{KL}\left (P_X || P_{X\cup Y}\right ) \lt \frac{2}{\log _2(c(X)+1)} \end{align}
 \begin{align} D_{KL}\left (P_Y || P_{X \cup Y}\right ) \lt \frac{2}{\log _2(c(Y)+1)} \end{align}
 \begin{align} D_{KL}\left (P_{X \cup Y} || P_v\right ) \gt \frac{2}{\log _2(c(X \cup Y)+1)} \end{align}
An example of possible merge is given in Figure 1(e) with the merging of representations
 $ae$
and
 $be$
into a single representation
 $(a \cup b)e$
. The idea behind the above conditions is to reuse the criterion for relevant extension in Definition 2 with a threshold multiplier
 $\alpha =1$
. Indeed, we have
 $ae \boxplus be$
when knowing that the traveler came from
 $a$
or
 $b$
is relevant (Condition 7); however, the additional information “it actually came from
 $a$
(or
 $b$
)” is not (Conditions 5 and 6).
Property 2.
Non-Transitivity.
Let
 $X, Y, Z$
be disjoint merged representations of
 $v$
then
 \begin{equation*} (X \boxplus Y) \wedge (Y \boxplus Z) \nRightarrow \left (X \boxplus (Y \cup Z) \right ) \end{equation*}
Proof.
Let
 $C_X=(n,0,0,\dots,0)$
,
 $C_Y=(n,n,0,\dots,0)$
,
 $C_Z=(0,n,0,\dots,0)$
and
 $C_v = (2n,2n,N,0,\dots,0)$
where
 $n \ll N$
. Due to the last assumption, we can assume the condition Equation (7) always holds. We have
 $D_{KL}(P_X,P_{X\cup Y \cup Z}) = 1$
so for any
 $n\gt 2$
we have
 $\neg (X \boxplus (Y \cup Z) )$
. However,
 $D_{KL}(P_X,P_{X\cup Y}) = D_{KL}(P_Z,P_{Y\cup Z}) = \log _2(3)-1$
. Therefore, for
 $2 \lt n\leq 9$
,
 $(X \boxplus Y) \wedge (Y \boxplus Z)$
is true while
 $ (X \boxplus (Y \cup Z) )$
is false.
A consequence of Property 2 is that a minimum set of merged representations cannot be found by iteratively performing all possible merges since the results may be arbitrary. We therefore use a hierarchical aggregation procedure that will prioritize the merges of representations that are the most similar (in terms of distance to their union distribution). However, since not all representations can be merged, the aggregation procedure does not need a stopping condition and the number of merged representations returned depends on the thresholds of Definition 4. This operation is therefore parameter-free. The drawback for it is similar to the one related to the building of VON networks: it relies on the definition of relevance according to Saebi et al. (Reference Saebi, Xu, Kaplan, Ribeiro and Chawla2020a).
The outline of the procedure can be found in Algorithm 1. For simplicity sake, it corresponds to a direct approach of the problem. This problem is similar to a hierarchical clustering (Manning et al., Reference Manning, Raghavan and Schütze2008) with two main differences. First, testing
 $x \boxplus y$
and computing the similarity between
 $x$
and
 $y$
is done in
 $O(|\mathcal{A}|)$
. Assuming
 $N=|\mathcal{V}_2(v)|$
and given that
 $N \leq |\mathcal{A}|$
, the time complexity of Algorithm 1 is therefore
 $O(N^2|\mathcal{A}|)$
. Second, as not all merges are possible, the set
 $M$
may be sparse and requires
 $O(N^2)$
space. The procedure space complexity therefore corresponds to the
 $O(N|\mathcal{A}|)$
required to store values of
 $c$
. Computation times for real datasets are discussed in Section 4.
The third condition in Equation (7) guarantees that merged representations are still relevant extensions of first-order sequences. Having identified all merged representations of each location using Algorithm 1, we construct AGG-VON
 $_2$
by merging the second-order nodes of VON
 $_2$
that belong to the same group as shown in Figure 1(e). Merged nodes transition probabilities are defined using Equation (4). The node fusion preserves Proposition 1 albeit a random walker will use the latter estimation of transition probabilities. Indeed, for a merged representation
 $X$
of
 $v$
and
 $\sigma \in \mathcal{A}$
, the longest suffix
 $s^*$
in Equation (3) is similar for every
 $xv \in X$
as
 $s^* \sigma$
is either
 $\sigma$
or
 $v\sigma$
. Moreover, for
 $xv \in X$
and
 $yv \in X$
there is no
 $s \in \mathcal{V}$
such that
 $(s \rightarrow xv) \in \mathcal{E}$
and
 $(s \rightarrow yv) \in \mathcal{E}$
since it would mean that
 $s$
is a representation of both
 $x$
and
 $y$
.
There are several tests we have to perform in other to assess the relevance of AGG-VON
 $_2$
. First, the produced aggregated network should be significantly smaller in terms of number of nodes. Second, it should represent flow dynamics almost as well as the VON
 $_2$
network. This condition is crucial since the point of using random walk-based clustering on higher-order networks was to take advantage of their capacity to reproduce observed sequences. Third, if the first hypothesis is verified, we expect the clusterings found on the aggregated network to be different than the one obtained on the VON
 $_2$
network for the reasons described in the previous section.
4. Experiments and results
We report in this section the experiments made to test the various hypothesis made in previous section. First, in Section 4.1, we demonstrate on synthetic datasets that a VON with a minimal number of representation is more efficient for the identification for known clusters. Next, in Section 4.2, we show that the AGG-VON
 $_2$
model produces a smaller and accurate model. We also discuss the differences obtained with the Infomap clustering on three real-world sequences datasetFootnote
1
.
4.1 Effect of aggregation on synthetic benchmarks
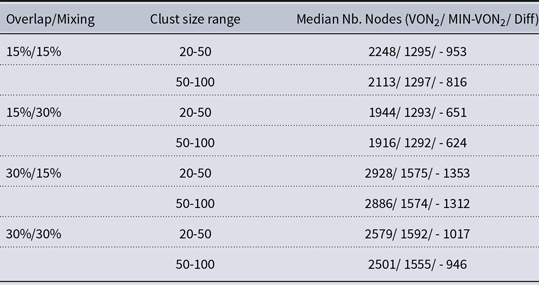
Reading: (third line) There is a median of
 1,944
nodes in the VON
 $_2$
network for parameters Overlap, Mixing, and Clust Range of
 $15\%$
,
 $30\%$
and
 $20-50$
respectively. There are however
 1,293
nodes in the MIN-VON
 $_2$
network (a difference of
 $-651$
). This line corresponds to the first column in the top-right panel of Figure 3.
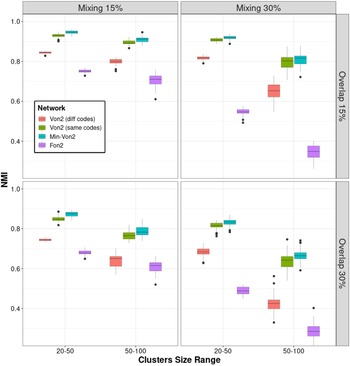
NMI between Infomap clustering found for each test case and the ground-truth clustering as generated by the LFR benchmark. A value of
 $1$
indicates a perfect identification of the real clusters (). Each boxplot corresponds to the distribution over
 $50$
tests.

We focus on the impact of the number of codewords per cluster on clusters extracted with Infomap. Considering synthetic networks, we measure the efficiency of reducing the number of representations in the clustering.
These test experiments are made using graphs with more complex clusters and node degree distributions than the ones in Figure 2(a). We use the LFR benchmark (Lancichinetti et al., Reference Lancichinetti, Fortunato and Radicchi2008) to generate directed graphs along with a ground-truth overlapping clustering of the nodes. In this benchmark, the “Mixing” parameter corresponds to the percentage of outgoing edges that are inter-clusters edges. The “Overlap” is the percentage of nodes in more than one cluster. Clusters size range gives the minimum and maximum sizes of clusters. The rest of the parameters take the following values found in the literature (Xie et al., Reference Xie, Kelley and Szymanski2013):
 N=1,000
(number of nodes),
 $om=2$
number of different clusters that overlapping nodes are members of,
 $\bar{k}=10$
(average degree),
 $\max (k)=50$
(maximum degree),
 $\tau _1=2$
(exponent of degree distribution),
 $\tau _2=1$
(exponent for clusters size distribution).
We use a flow dynamic similar to the example of Figure 2: if a traveler coming from a cluster
 $\mathcal{C}_{i}$
arrives at an overlapping node
 $v$
in
 $\mathcal{C}_{i}$
, it will return to a random non-overlapping neighbor of
 $v$
in
 $\mathcal{C}_{i}$
. Otherwise, it will follow an outgoing edge at random. In this situation, the traveler is able to move from a cluster to another by following inter-cluster edges. Knowing the graph, the ground-truth clustering and the flow dynamic we can directly construct the networks and try to recover the original clustering using Infomap. To test the impact of the effects described at the end of Section 3.3, we compare four different Infomap inputs:
Network VON
$_2$
when not correcting for the first effect described in Section 3.2, that is, using different code words for all representations of locationsNetwork VON
$_2$
when correcting for the first effect, that is, using the same code word for representations of a location that belong to the same clustersNetwork MIN-VON
$_2$
where representations are merged according to the clusters they should belong to (as in Figure 2c). We also correct for the first effectNetwork FON
$_2$
(Rosvall et al., Reference Rosvall, Esquivel, Lancichinetti, West and Lambiotte2014) correcting for the first effect


The number of nodes found for VON
 $_2$
and MIN-VON
 $_2$
networks is reported in Table 1 for the various parameters used. Since the number of communities of overlapping locations is
 $2$
, each overlapping location should have
 $3$
representations in MIN-VON
 $_2$
, for example, taking an overlap of
 $15\%$
and
 1,000
locations (first four lines in Table 1), MIN-VON
 $_2$
should contain
 1,300
nodes. The discrepancies with the reported results come from the LFR algorithm that may need to relax some constraints, that is, the number of overlapping nodes may vary. Notice that the number of nodes in VON
 $_2$
is, however, lower with higher mixing values. Indeed, the inter-cluster neighbors of an overlapping location do not generate additional memory nodes.
Difference in number of representations in the LFR benchmark for networks VON
 $_2$
and MIN-VON
 $_2$

The difference between clusterings found and the ground-truth are reported in Figure 3. The distributions of NMI (McDaid et al., Reference McDaid, Greene and Hurley2011) values suggest that correcting for the first effect is important as it greatly improves the detection of the real clustering in all situations. The improvement when using the MIN-VON
 $_2$
is not as large. We can however notice an important gap when the difference in number of representations between VON
 $_2$
and MIN-VON
 $_2$
is the largest (
 $15\%$
mixing ratio and
 $30\%$
of overlapping nodes). In this situation, it seems that too many clusters are identified overall. It also appears that the VON always perform better than the FON
 $_2$
networks. This shows that correcting for the first effect as suggested by Rosvall et al. (Reference Rosvall, Esquivel, Lancichinetti, West and Lambiotte2014) is not enough.
4.2 Comparison of spatial trajectories datasets
Even if the last case study is revealing, the flow dynamic used is rather simple and the LFR benchmark may not reflect real-world systems where the observed sequences occur. Moreover, the networks constructed here correspond to ideal scenario where the transition probabilities are not estimated and the relevant extensions are not extracted from a set of sequences. It is indeed possible that the choice of model does not impact the clusterings of location found for real datasets. It is therefore important to compare results of clustering on real datasets. In this context, we use AGG-VON
 $_2$
model instead of MIN-VON
 $_2$
.
We first show that our aggregated model is more parsimonious and maintains a good representative power. Moreover, such accuracy is not achieved when building smaller VON
 $_2(\alpha )$
with different threshold values. We then show that spatial trajectories can lead to relatively similar Infomap clusterings in one case (US flight itineraries). For the two other cases (Taxi itineraries and Shipping records), the clusterings found contain noticeable variations. When using the model AGG-VON
 $_2$
, clustering tends to contain less clusters and overlapping locations.
4.2.1 Experimental settings
The three datasets correspond to trajectories or movements observation. Spatial sequences are indeed a major source of applications for higher-order network analysis. The datasets studied are however different in terms of nature, number of locations, number of the sequences, etc.. Moreover, they were all used previously as applications of higher-order network mining. For each one, we removed consecutive repetitions of locations in each sequence.
Airports dataset (Rosvall et al., Reference Rosvall, Esquivel, Lancichinetti, West and Lambiotte2014; Scholtes, Reference Scholtes2017): US flight itineraries extracted from the RITA TransStat 2014 databaseFootnote 2 . A sequence corresponds to passenger itineraries (as sequences of airports stops) that took place during the first trimester of 2011. We have
$|\mathcal{A}|=446$
and
$|\mathcal{S}|=2751K$
.Maritime dataset (Xu et al., Reference Xu, Wickramarathne and Chawla2016): Sequences of ports visited by shipping vessels extracted from the Lloyd’s Maritime Intelligence Unit. The sample corresponds to observations that took place between April 1 and July 31, 2009. We have
$|\mathcal{A}|=909$
and
$|\mathcal{S}|=4K$
.Taxis dataset (Saebi et al., Reference Saebi, Xu, Kaplan, Ribeiro and Chawla2020a): Sequences of neighborhoods (represented by the closest police station) visited by taxis in Porto city between July 1, 2013, and June 30, 2014. The original dataset, consisting of GPS trajectories, was part of the ECML/PKDD challenge 2015Footnote 3 . The trajectories are mapped to neighborhoods as described by Saebi et al. (Reference Saebi, Xu, Kaplan, Ribeiro and Chawla2020a). We have
$|\mathcal{A}|=41$
and
$|\mathcal{S}|=1514K$
.


For each constructed network, we report the number of nodes (total number of representations) and the number of representations by location
 $N_{\mathcal{V}}\;:\; \mathcal{A} \rightarrow \mathbb{N}^{+}$
.
To evaluate the networks ability to model the flow dynamics, relevant extensions are extracted using a training set of
 $90\%$
of the sequences. For each constructed network, an accuracy score
 $Acc$
(Equation (8)) is computed on the remaining sequences
 $\mathcal{S}^{test}$
. The score corresponds to the average probability to correctly identify the next location starting with the third entry in each sequence given the two previous entries.
 \begin{equation} Acc(p) = \dfrac{1}{|\mathcal{S}^{test}|}\sum _{S \in \mathcal{S}^{test}} \dfrac{1}{|S|-2} \sum _{i=3}^{|S|} p(s_i|s_{i-2}s_{i-1}) \end{equation}
Since VON networks are variable-order models, if a context
 $s=s_0 s_1 \in \mathcal{A} \times \mathcal{A}$
is not a relevant extension, then the probability
 $p(\sigma |s_0s_1)$
will be estimated using
 $p(\sigma |s_1)$
. Moreover, for the aggregated
 ${VON}_2$
model,
 $p(\sigma |s_{0}s_{1}) = p(\sigma |X)$
where
 $X$
is the merged representation
 $s_{0}s_{1}$
belongs to. As explained in Section 5.1, we can use a value of
 $\alpha \gt 1$
in Equation (2) in order to construct more parsimonious VON. By doing so, we simply make harder for contexts to be qualified as relevant. For each dataset, we find the parameter
 $\alpha ^*$
such that the total number of representations in
 ${VON}_2(\alpha ^*)$
is as close as possible to
 ${AGG-VON}_2$
’s. We therefore compare four networks, for each dataset:
 ${VON}_2(1)$
,
 ${VON}_2(\alpha ^*)$
,
 ${AGG-VON}_2$
and
 ${FON}_2$
.
 ${VON}_2(\alpha ^*)$
networks are used to compare the changes in representative power of
 ${AGG-VON}_2$
. For each dataset and each model, the test was done
 $50$
times and we report the mean
 $Acc$
value and the standard deviation
 $sd(Acc)$
.
Since Infomap is a non-deterministic algorithm, we applied it
 $50$
times on each network and keep the clustering
 $\mathcal{C}$
associated with the smallest code length. We report the number of clusters
 $N_{\mathcal{C}}\;:\; \mathcal{A} \rightarrow \mathbb{N}^{+}$
for each location. We also report the decrease in code length
 $\Delta L$
when compared with the absence of clustering. A
 $\Delta L$
value close to
 $0$
would suggest that the clustering is not a good summary of the flow dynamics. Note this measure (as well as the absolute values of
 $L$
) cannot be used to directly compare the network models between them since the code length will mechanically be higher with the number of nodes, which can vary. We however report the NMI (McDaid et al., Reference McDaid, Greene and Hurley2011) between the clusterings found.
We used the Infomap python library developed by the authorsFootnote 4 . Experiments were done using Intel i7-8650U processors at 1.90 GHz with 30Gio of RAM, running Ubuntu 18.04 and Python 3.6.9.
4.2.2 Results discussion
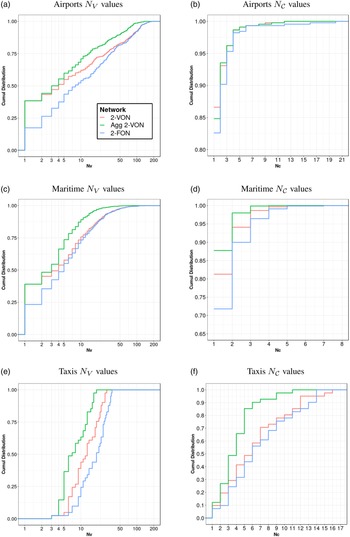
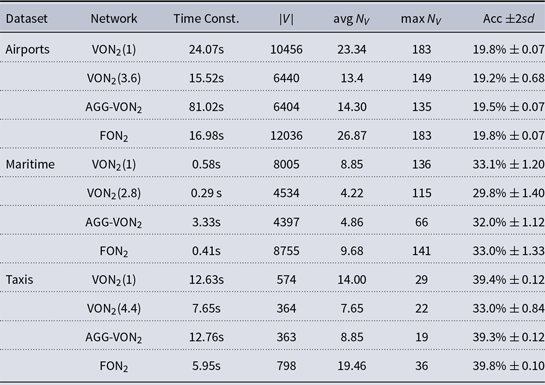
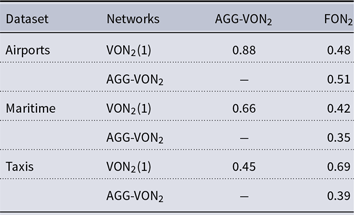
We start by addressing the first two questions at the end of Section 3.3: is the aggregated network more parsimonious and, if so, does it represent flow dynamics well enough? Datasets and networks statistics are given in the top part of Table 2. Cumulative distributions of
 $N_{\mathcal{V}}$
values are shown in the left panels of Figure 4.
Cumulative distribution of the number of representations
 $N_{\mathcal{V}}$
(left column) and clusters
 $N_{\mathcal{C}}$
(right column) for locations. For each panel,
 $y(x)$
gives the ratio of location having at most
 $x$
representations/found in at most
 $x$
clusters. Note that the
 $y$
-axis range varies among the panels.

Network’s model accuracy comparison
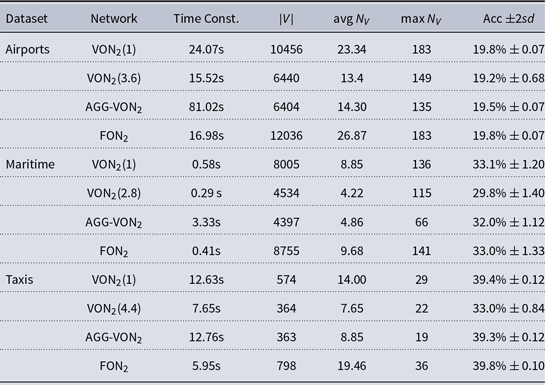
We can first notice that the total number of nodes in the aggregated VON
 $_2$
is significantly smaller than with the VON
 $_2$
or FON
 $_2$
networks. In the top row of Figure 4, we can see that, not surprisingly, the drop in
 $N_{\mathcal{V}}$
values mostly impacts highly represented locations. For the taxis dataset (Figure 4e),
 $N_{\mathcal{V}}$
values are more uniformly distributed. Next, we can see that VON
 $_2$
and FON
 $_2$
models have close accuracy scores. These results are consistent with those of Xu et al. (Reference Xu, Wickramarathne and Chawla2016) albeit the authors used a different definition of accuracy. Lower accuracy values are observed with the AGG-VON
 $_2$
model. The loss seems however negligible when compared to the differences in
 $N_V$
values. Moreover, accuracy results are significantly worse for
 ${VON}_2(\alpha ^*)$
, even if the difference is not necessarily large, as it is with the Airport dataset for instance. We can conclude that our aggregation strategy is efficient in this regard and that our first two hypothesis are verified on these datasets.
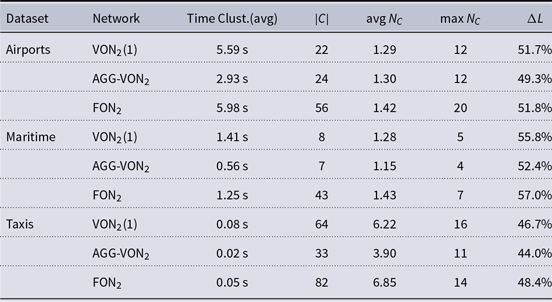
We now discuss the clusterings obtained with the Infomap algorithm using the different models. The relevant statistics are reported in the bottom part of Table 3, and the cumulative distributions for
 $N_{\mathcal{C}}$
are given in the right panels of Figure 4. The similarity (according to the NMI) between the clusterings can be found in Table 4.
Clustering results comparison

NMI between clusterings found with VON
 $_2$
, agg VON
 $_2$
, and FON
 $_2$

The clusterings found for AGG-VON
 $_2$
and VON
 $_2$
networks are almost identical for the Airports dataset. The reported NMI between these networks is smaller in the case of the Maritime dataset. In this case, the
 $N_{\mathcal{C}}$
are lower for most of the locations with the aggregated VON
 $_2$
model (see. Figure 4d). This means there are less overlaps between the clusters. The biggest difference in clustering results between AGG-VON
 $_2$
and the rest appears with the Taxi dataset where the VON
 $_2$
clustering is closer to the FON
 $_2$
clustering. In this case, the number of cluster per location is significantly lower with AGG-VON
 $_2$
. Also, the relevance of the clusterings quantified with
 $\Delta L$
values is lower overall. This seems consistent with the results of the case study of Section 4.1 since it means that the clusterings are less well defined.
Even if those real-world datasets do not include a ground-truth clustering, we can conclude that using AGG-VON
 $_2$
model can lead to significantly different clusterings. This suggests that the impact of the number of representations on random walk-based algorithms is not marginal.
We report in Tables 2 and 3 the computation times for the construction of each network and the average time taken by the Infomap algorithm to produce one clustering. We can see that the aggregation of representations significantly slows down the network construction. The additional time required is obviously dependent on the number of nodes in the VON
 $_2$
network. However, an important speedup is achieved when using Infomap. Remember that, since the algorithm is non-deterministic, it should be run multiple times and only the average time for a single run is reported here.
5. Discussion and future works
5.1 Extension of the aggregated model to any order
The results presented in this paper are valid in the limited case where the maximum order of representation is
 $2$
. The AGG-VON
 $_2$
model shows that we can achieve very different clustering results by using a smaller network model that captures the flow dynamics almost as well. However, for the different datasets considered here, previous studies suggest that strong dependencies exist at higher-order. Indeed, general VON networks contain significantly more representations of each location than VON
 $_2$
networks. We can expect the effects on random walk-based clustering described in Section 3.2 to be, not only still relevant, but strengthened. For instance, the VON networks for the Airports, Maritime, and Taxis datasets contain around
 $443$
K,
 $18$
K, and
 $4$
K nodes, respectively. These observations illustrate the need to generalize our aggregated model.
One important issue is the fact that merging nodes in a VON
 $_k$
with
 $k\gt 2$
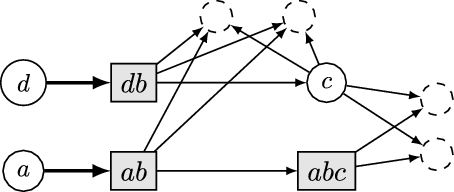
may introduce ambiguities in the encoded sequential dependencies. Indeed, relations between higher-order nodes are a way to force a random walker into specific destinations as expressed in Proposition 1. In the example given in Figure 5, two representations of order
 $2$
are similar in terms of the next visited location but they should not be merged, since doing so would break those constraints. This situation never occurs with a maximum order of
 $2$
, as shown in Section 3.3.
Example of ambiguous case when trying to build the aggregated network when representations of order greater than
 $2$
exist. We assume distributions
 $P_{db}$
and
 $P_{ab}$
are similar. In this context, merging the corresponding nodes together will break the relation
 $ab \rightarrow abc$
that is required to encode this third-order representation of
 $c$
.

This issue seriously limits the gain obtained by merging groups of representations into a single node. This transformation is useful for VON
 $_2$
as it addresses the second and third effects discussed in Section 3.2. Indeed, for the network in Figure 2(b), the probability for a random surfer to teleport to any of
 $\{av,bc,cv\}$
or
 $\{dv,ev\}$
is
 $\frac{3}{10}$
or
 $\frac{2}{10}$
, respectively, while it is
 $\frac{1}{8}$
for both in Figure 2(c). This mitigates the second effect as the probability to use the code word for a representation of
 $v$
is reduced. Moreover, merging those nodes in Figure 2(c) corresponds to the constraint of always considering them as being part of the same clusters. This cancels the third effect.
A possible solution for Infomap clustering of VON networks (at any order) is to still use a priori computed PageRank values but now using non-uniform teleportation rates corresponding to the merged representations. For example, the probability to teleport to any of the
 $\{av,bc,cv\}$
would be
 $\frac{1}{3}\frac{1}{8}$
. Additionally, groups of representations should be moved together from a cluster to another while searching for the best partition. This last constraint would require important changes to the Infomap algorithm. Notice that in this study we only changed the input of the algorithm and used already available options.
5.2 Others network mining tools
The results presented in this paper are in agreement with the idea that Infomap cannot be directly applied to higher-order networks. As locations’ clusters are built from a partition of its representations, the number and distribution of the representations have an important impact. These arguments point toward the importance of adapting classic network mining tools to VON. A similar conclusion was reached when looking at the PageRank metric Coquidé et al. (2022) as the more a location is represented in the higher-order network the higher its PageRank is. It is our opinion that multiple network representations of the same datasets are possible and that VON can successfully capture flow dynamics of the input sequences. However, efficient network mining tools should take the variability of these possible network models into account. This represents a challenge for researchers working in this domain.
This paper focused on random walk-based clustering methods where we demonstrated that important divergence can be achieved with the Infomap algorithm using our aggregated VON model. There are different clustering algorithms that also rely on random walks. We can mention the Walktrap algorithm (Pons and Latapy Reference Pons and Latapy2006). It is based on the comparison of the set of reachable nodes using short random walks and therefore does not use a teleportation mechanism. Thus, it will be interesting to adapt it to VON networks.
Competing interests
None.
Notations
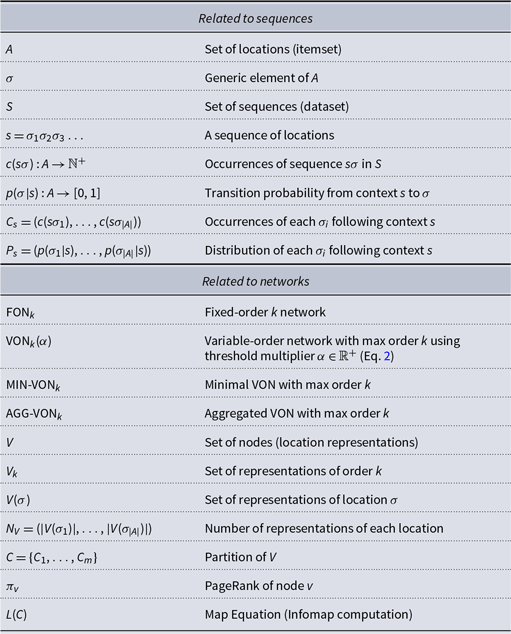
Summary table for notations