South Africa’s minority white population elected the Afrikaner-led National Party in 1948, marking the official start of the apartheid regime that would be in power for the next 46 years. The government soon faced mounting pressure from increased urbanization and political mobilization within the black population. Spatial segregation thus became important for the survival of the apartheid regime (Simkins Reference Simkins1983, 2011). The government created a system of ten ethnically distinct homelands (also called Bantustans) with the goal of dividing the black majority and promoting tribal identity and allegiances. Under the rhetoric of “separate development,” some 3.5 million black South Africans were forcefully relocated between 1960 to 1980 in what has been called the “ultimate apartheid experiment” (Christopher Reference Christopher2001, p. 5). People were deported to resettlement camps (located within homelands) which suffered from stark economic deprivation and overcrowding. In these camps, the “arbitrary assignment to residential sites destroyed a range of existing relationships” (Sharp and Spiegel Reference Sharp and Spiegel1985, p. 144). Homelands were governed by traditional leaders who acted as proxies for the apartheid regime. These leaders were resentful towards the inflow of people making it difficult for the relocated to access land outside the resettlement areas.
Life in resettlement camps had both cooperative and competitive elements. On the one hand, scarcity exacerbated conflict over resources; on the other hand, people needed to build new support networks and could rally around the common goal of fighting the apartheid regime. Consequently, historic accounts report both “endemic violence” (Rogers Reference Rogers1980) as well as acts of solidarity among the displaced people. This ambiguous effect on social cohesion and social capital within the resettlement communities motivates the empirical investigation in this study.Footnote 1
To study the effect of removals on receiving areas, I compare how contemporary levels of social capital in a given homeland vary with proximity to resettlement sites using five waves of Afrobarometer data collected between 2000 and 2010 and newly digitized data on the size and location of resettlement camps. This strategy is based on the premise that effects of forced removal should be largest near these resettlement camps. Comparing individuals with the same demographic characteristics, who belong to the same ethnic group, and reside in the same former homeland, I find that those living in or close to former resettlement sites have higher levels of social capital. They are more trusting towards relatives and neighbors, and are 7.7 percentage points (39 percent) more likely to state that people in general can be trusted. There is also evidence that people in these communities experience lower levels of crime: reported incidences of physical violence are 30 percent lower in former resettlement areas.
As a reaction to nationalist movements in other African countries, the apartheid government tried to promote ethnic identity among Africans.Footnote 2 It issued a White Paper in 1959 stating that the “Bantu people of South Africa…do not constitute a homogeneous people but form separate national units on the basis of language and culture” (Rogers Reference Rogers1980, p. 63). The apartheid regime also stoked inter-ethnic tension through resource and land reallocation. By contrast, the African National Congress (ANC) emphasized that, “South Africa is a single multi-national society, integrated and inter-related” (Mbeki Reference Mbeki1984, p. 38) and tried to counter “attempts to … set its people one against another in tribal, racial and national conflicts” (Tambo Reference Tambo1976). A second set of findings thus explores effects on the levels of trust towards own and different ethnic groups. I find that people living close to former resettlement camps have higher levels of trust towards their own ethnic group (13.7 percent) and even more towards other ethnic groups (21.8 percent). Inter-group trust was essential for South Africa’s democratic transition, which was marked by remarkably little violence and retribution. The ANC under Nelson Mandela entered a power-sharing agreement with the white National Party and (mainly Zulu) Inkatha Freedom Party. This Government of National Unity was able to reduce inter-ethnic violence, create democratic institutions, pass a new constitution, and facilitate national reconciliation through the Truth and Reconciliation Commission (Gibson Reference Gibson2006).
While I argue that the increase in social capital is the effect of living in newly formed resettlement communities, I test various alternative theories that may explain these results. First, resettlement camps were more likely to be located near homeland borders, as the apartheid regime aimed to exploit Africans as sources of cheap labor while keeping them geographically segregated (Christopher Reference Christopher2001). People in these areas were hence more likely to travel outside of homelands even with mobility restrictions in place. To test whether results reflect interactions outside homelands, I control for the distance of individuals to the homeland border, nearest large city, and nearest industrial areas and find that results are robust to these specifications. Second, results could be the effect of (selective) migration: people may have left relocation areas after mobility restrictions were lifted at the end of apartheid. Historic census data show that those who migrated from resettlement camps and comparison areas did not differ along observable characteristics and that population changes (since 1996) are almost identical in these areas. Third, I employ a placebo test to verify that findings are not merely the result of increased urbanization associated with resettlement. Using data from the South African census, I identify wards that are most similar to former resettlement camp areas in terms of population density and race composition and repeat the analysis assuming that the matched wards had a resettlement camp at their centroid. I can reject that coefficients of this placebo test are equal to results of the main specification at significant levels. In sum, the available historic data provide support for the validity of the identification strategy.
While the importance of social capital is widely acknowledged (Putnam, Leonardi, and Nanetti Reference Putnam, Leonardi and Nanetti1993; Fafchamps Reference Fafchamps2006; Guiso, Zingales, and Sapienza Reference Guiso, Zingales and Sapienza2008; Glaeser et al. Reference Glaeser, Laibson, Scheinkman and Soutter2000), most of the literature focuses on its effects with less attention to its sources (Marschall and Stolle Reference Marschall and Stolle2004). This article adds to a small but growing literature on the origin of social capital and is one of the few studies that look at the effect of changes at the community level. The fundamental challenge to establish causality in this literature is that people may select to live in a particular social setting for reasons correlated with the level of social capital. More trusting individuals, for example, may choose to live in more diverse communities. Conversely, the robust negative relationship between levels of income and trust (Li, Pickles, and Savage Reference Li, Pickles and Savage2005; Letki Reference Letki2008) and ethnic heterogeneity and trust (Alesina and La Ferrara 2005) may be driven by differences in crime rates or the provision of public services. The key question is how social capital changes when people are faced with an exogenous shock in their social setting such as experiencing economic hardship or living in a more diverse community. Studying sudden shocks to communities, such as the forceful removal to homelands, may address these identification challenges.
Nunn and Wantchekon (Reference Nunn and Wantchekon2011) find that the slave trade had a detrimental effect on economic development, partly by establishing a culture of mistrust in areas affected by the slave trade. The concept of how historic shocks can lead to persistent changes in attitudes is formalized by Tabellini (Reference Tabellini2008) and Guiso, Zingales, and Sapienza (Reference Guiso, Zingales and Sapienza2008) who show that a change in the external environment can alter the optimal set of values that parents transmit to their children. I address the question of whether effects on social capital persist by testing whether people in homeland areas born after forced removals ended in the mid 1970s also have different levels of trust. Results showing that the effect on younger cohorts are either the same or larger indicate that the removal policies had a persistent impact on affected communities. Resettlement may have inadvertently helped to create a common identity as displaced people, which bridged ethnic cleavages within the African community and facilitated a protest movement that eventually led to the democratic transition in 1994 (Posel 2011).
This study also contributes to the broader literature on how (ethnic) diversity affects social capital. Ethnic fragmentation has persistent and important implications for social cohesion, especially in Sub-Saharan Africa (Alesina, Michalopoulos, and Papaioannou Reference Alesina, Michalopoulos and Papaioannou2016; Papaioannou and Michalopoulos Reference Papaioannou and Michalopoulos2013; Arbatli et al. forthcoming). The probability of civil conflict is strongly correlated with the degree of ethnic fragmentation as reflected in continuous conflict outbreaks in countries like Kenya, Nigeria, Uganda, and South Sudan (Horowitz Reference Horowitz1985; Herbst Reference Herbst2000; Esteban and Ray Reference Esteban and Ray1999; Rohner, Thoenig, and Zilibotti Reference Rohner, Thoenig and Zilibotti2013). Caselli and Coleman (2013) argue that ethnicity can serve as a means to prevent indiscriminate access to gains of the winning group and thus becomes particularly important in times of elections or revolutions. Results of these studies stand in contrast to my finding that levels of trust are substantially higher and crime rates are lower in resettlement areas. I document that despite the goal of creating ethnically homogeneous homelands, former resettlement camp areas are more ethnically diverse (possibly because removing communities along ethnic lines was practically infeasible) and that ethnic fragmentation is positively correlated with measures of inter-ethnic trust only in resettlement communities.
In sum, results suggest that in the long run, the exposure to a large inflow of people from different backgrounds increased understanding of and trust towards different groups, despite potential short-term conflict over resources. This interpretation is in line with recent (quasi-) experimental studies (Clingingsmith, Khwaja, and Kremer Reference Clingingsmith, Khwaja and Kremer2009; Burns, Corno, and La Ferrara 2015; Okunogbe Reference Okunogbe2015) and with the social psychology literature’s finding that “social proximity” fosters a common identity, trust, and cooperation (Putnam Reference Putnam2007). Life in resettlement camps reduced social distance and facilitated a new identity as “resettled people”: people lost their property and were assigned a standard size plot of land. They were not allowed to bring along cattle, which was not only a source of livelihood but also an important symbol of social status. The arbitrary assignment of plots in resettlement camps further facilitated the formation of networks across ethnic lines. The question of why exposure to people from different backgrounds seems to increase trust and tolerance at the micro level, while ethnic heterogeneity has adverse effects on the macro level is a puzzle that warrants future research.
Last, while a small literature studies the long-term effect of apartheid policies (Dinkelman Reference Dinkelman2017; Eriksson Reference Eriksson2014; Fourie and Mariotti Reference Fourie and Mariotti2014; de Kadt and Larreguy Reference de Kadt and Larreguy2018; Bastos and Bottan Reference Bastos and Bottan2014; Mariotti Reference Mariotti2015), this article is, to the best my knowledge, the first study that quantifies the long-term effects of the forced removal of millions of people, an important historic event that is still at the center of public debate in South Africa, due to its effects on land distribution. It relates to a small literature on the socio-economic effects of large-scale removals of people. The majority of these studies have looked at the economic impact on areas from which people were removed, including the effect of slave exports (Nunn Reference Nunn2008), Jewish population in Russia during WWII (Acemoglu, Hassan, and Robinson Reference Acemoglu, Hassan and Robinson2011), and the seventeenth century expulsion of Spanish Muslims from the Iberian Peninsula (Chaney Reference Chaney2008; Chaney and Hornbeck Reference Chaney and Hornbeck2016). Less is known about the effect of relocation in receiving areas. Osafo-Kwaako (Reference Osafo-Kwaako2012) examines the relocation of Tanzanians to developmental villages over the period 1974 to 1982. Bazzi et al. (Reference Bazzi, Gaduh, Rothenberg and Wong2017) study a large-scale resettlement program in Indonesia and find that it led to a deeper ethnic integration. This article is most closely related to Dippel (Reference Dippel2014), who analyzes the resettlement of historically autonomous tribes to Native American reservations. He finds that forced integration led to a decrease in today’s income by 37 percent and argues that these effects are mainly driven by political infighting and resulting economic uncertainty. The consequences of what Dippel calls “forced coexistence” warrants more research given that there are globally 68.5 million forcibly displaced people whose integration in host communities often poses major challenges (UNHRC 2017).
HISTORIC BACKGROUND
Creation of the Homeland System
The apartheid system that South Africa’s Afrikaner-led National Party started to establish in 1948 pursued two main goals: sustaining political supremacy and promoting economic prosperity of the white minority that only made up about 20 percent of the total population. However, these two goals were based on an inherent tension: political supremacy required marginalizing the African majority while the integration of African workers was needed to satisfy industries’ growing demands for cheap labor (Wilson and Ramphele Reference Wilson and Ramphele1989; Posel 2011). In particular, South Africa’s mineral-driven industrialization in the first half of the twentieth century increased demand for labor in cities, leading to growing African urban settlements. Whites feared that this would create a critical mass of African urban workers and a wider political mobilization that would threaten political stability.
This tension explains why the apartheid system was neither stable over time nor followed a linear development trajectory. Instead, the period from when the National Party came into power in 1948 to the first democratic national election in 1994 can be divided into different phases reflecting power shifts between purists favoring total segregation and pragmatists, who focused on economic development. At least three developments led the apartheid regime to shift course and implement more segregationist policies throughout the 1950s. First, the National Party realized that the pragmatists’ approach of regulating the movement of African labor through a labor bureau system failed to establish state control over the allocation of African workers (Posel 2011). Overcrowding and poverty on reserves assigned to Africans in the various land acts and job opportunities in the cities led to urban migration. As a result, the African urban population grew by 50 percent and political protest increased during the 1950s.Footnote 3 Second, the government faced growing pressure from white farmers to remove Africans from their land. While this politically powerful group had previously relied on large numbers of unskilled workers, increased mechanization of agricultural production in the middle of the twentieth century shifted demand to a smaller and more highly skilled workforce to operate the new machines and thus created labor surplus on farms (Platzky and Walker Reference Platzky and Walker1985). Third, in the context of decolonization of other parts in Africa, international opposition to apartheid’s racist policies increased. Apartheid propaganda tried to liken these reforms to the contemporaneous decolonization of European colonies in other parts of Africa (Thompson Reference Thompson2001). However, only four of the ten homelands (Transkei, Venda, Ciskei, Bophuthatswana) subsequently accepted “independence” status between 1976 and 1981.
As a result of these developments, the apartheid government passed legislation that formed the legal basis of the homeland or Bantustan system.Footnote 4 Whites recognized the potential threat of a united African opposition and the importance of actively managing ethnic and racial identities. The government’s stated goal was that “soon there would be no more black South Africans” (C. Mulder, cited in Platzky and Walker Reference Platzky and Walker1985, p. 67). The system thus divided people no longer along racial lines (as black South Africans), but categorized the African population along far narrower ethnic lines.Footnote 5
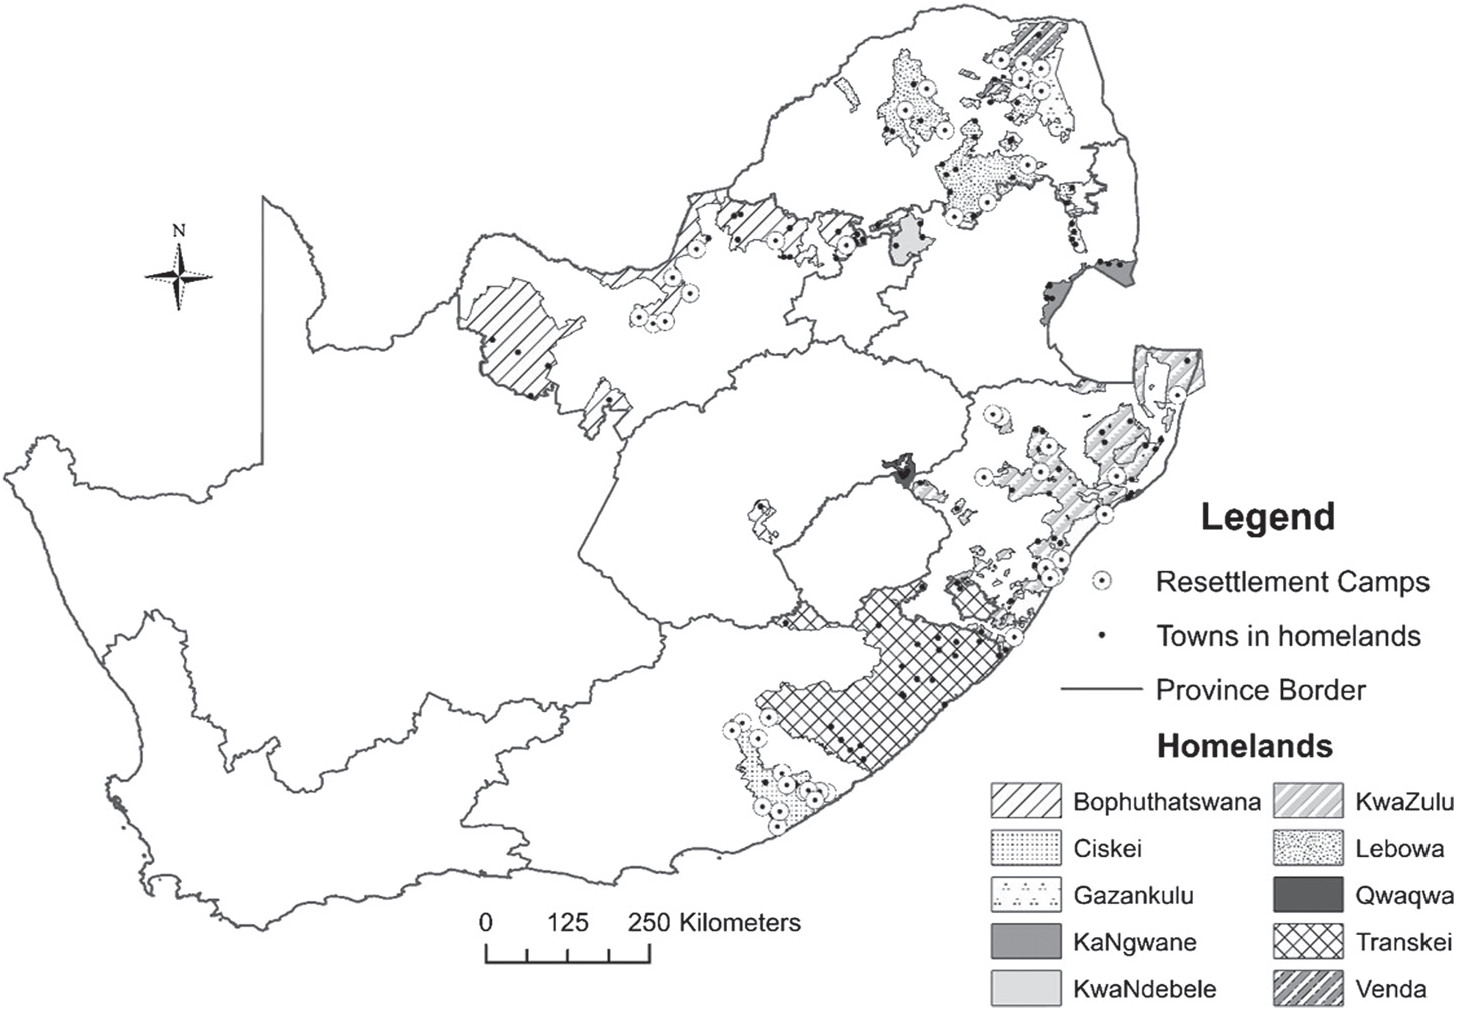
The Group Areas Act of 1950 created ethnically homogenous townships outside the cities and forcefully removed people according to their racial classification, as codified in the Population Registration Act of 1950. The Bantu Authorities Act (1951) and Bantu Resettlement Act (1954) created ten separate ethnic homelands: Transkei and Ciskei (Xhosa ethnicity), KwaZulu (Zulu), Bophuthatswana (Tswana), Venda (Venda), Gazankulu (Tsonga), Lebowa (Sotho), Qwaqwa (Sotho), KaNgwane (Swazi), and KwaNdebele (Sotho) (see Figure 1).
SOUTH AFRICA’S BANTUSTAN SYSTEM

The designated homelands presented only small fragments of the ethnic group’s original territory. The highly contoured and fragmented shape of homeland territories, which were largely based on the native reserves demarcated in the Land Acts of 1913 and 1936, reflect that homeland borders were also determined by the interests of white farmers and the location of mineral deposits rather than just by historic tribal areas as claimed by the apartheid regime (Desmond Reference Desmond1971; Moerdijk Reference Moerdijk1981; Thompson Reference Thompson2001).
The Bantu Self-Government Act (1959) and Bantu Homeland Constitution Act (1971) established political separation of Bantustans: inhabitants became citizens of their respective homeland and were thus regarded as foreigners in South Africa (Kelk Mager and Mulaudzi 2011). The regime justified these reforms adopting rhetoric of “separate development” and claiming that these policies would grant self-determination to nations within the borders of their historic homeland.
In an attempt to divide the African population, the apartheid government abolished the Native Representative Council, consisting of representatives elected by Africans, and shifted power to more conservative parts of the rural population, mainly to the traditional chiefs (Kelk Mager and Mulaudzi 2011). However, while chiefs officially remained the “father of his people,” their actual competencies were limited. Laws still required approval from the national government and budget flows were redirected to homelands that cooperated with the apartheid regime. In addition, substantive administrative authority was held by magistrates, appointed by the South African government (Moerdijk Reference Moerdijk1981). Traditional leaders who complied with the national government received large rents and the power to allocate land, which allowed them to support a system of patronage. As a result, traditional leaders were less accountable to the homeland population and became widely regarded as agents of regime.
This system of “independent nations” served as a justification for large scale removals of people.Footnote 6 Especially in the 1960s and early 1970s, the government forcefully removed Africans from “white areas” to homelands and controlled the inflow of people into cities through a pass system. While exact statistics do not exist, most studies estimate that at least 3.5 million people were removed to Bantustans over the next decades (Surplus People Project (SPP) 1983; Unterhalter Reference Unterhalter1987). Despite the explicit goal of creating ethnically homogenous homelands, we actually observe more ethnic diversity in resettlement communities, as discussed in more detail later.
In 1985, citizens of independent homelands could reapply for South African citizenship. Mobility restrictions were lifted in 1986, and Bantustans were eventually reincorporated into the Republic of South Africa after the 1994 election. Legislation transformed Bantustans into “Traditional Authority Areas,” in which many of the previous leaders could maintain some authority until today.Footnote 7
Removal and Life in Resettlement Communities
The government-appointed Tomlinson Commission (1954) estimated that the homeland areas could sustain the livelihood of 1.8 million people (Timberlake Reference Timberlake1985). Between 1960 and 1970 alone, the total population of the Bantustans increased from 4 to about 6.9 million and continued to rise through the 1970s (Rogers Reference Rogers1980). As the apartheid regime envisioned homelands to serve as reserves of cheap labor, resettlement camps were often located in proximity of homeland borders. The government demarcated sparsely populated areas of homelands for resettlement, often on old cattle-posts or farms (Desmond Reference Desmond1971, p. 50; Green and Hirsch Reference Green and Hirsch1983, p. 62). Camps filled up rapidly. The number of Bantustan towns increased from 3 in 1960 to 77 in 1970 (Unterhalter Reference Unterhalter1987). In the case of the Ciskei, several camps of 30,000 to 50,000 people “sprang up virtually overnight” (Rogers Reference Rogers1980, p. 65). In most cases, no preparation of resettlement sites was made except for the provision of tents or improvised shelter (Desmond Reference Desmond1971; Christopher Reference Christopher2001).
Most people were resettled from rural and peri-urban areas close to the newly established homelands. Frequently, white farmers pressured the government to evict areas on or near their land (Rogers Reference Rogers1980). Removal policies followed a common pattern: first, communities received notifications about the impending eviction. In many cases, schools were closed, water supply cut off, and bus services withdrawn. To coax people into moving “voluntarily,” promises were made about compensation and the availability of land, jobs, and schools in the resettlement areas (Desmond Reference Desmond1971; Platzky and Walker Reference Platzky and Walker1985). Yet, many people refused to vacate the land of their ancestors. In these cases, the government threatened people with imprisonment and sent bulldozers and a fleet of the infamous government garage (GG) trucks to destroy houses and transport people to resettlement sites.
Tenants could not take legal action when land was taken from them since, according to South African law, Africans had no absolute property right in land, even if the family purchased it or had owned it for generations (Rogers Reference Rogers1980). The infamous pass laws prevented escaping resettlement by moving to cities and thus people “found themselves with no option but to move into already overcrowded reserves” (Wilson and Ramphele Reference Wilson and Ramphele1989, p. 217). African villages were therefore typically relocated in their entirety.Footnote 8
At resettlement camps, the reality differed from what people were promised. Living conditions and the provision of public services in resettlement camps were dismal (Desmond Reference Desmond1971; Horrell Reference Horrell1973; Mariotti Reference Mariotti2012). Relocated people typically received only small plots of land with a tin hut and latrine for which they needed to pay rent to local tribal authorities (Green and Hirsch Reference Green and Hirsch1983; Platzky and Walker Reference Platzky and Walker1985; Desmond Reference Desmond1971). The adverse social consequences of these large population resettlements are exemplified by the case of Qwaqwa, a small homeland in a mountainous area near Lesotho. Qwaqwa was the focus of a massive resettlement program. The South African police deported people from all over the Free State and created the vast resettlement camp called Kromdraai. Between 1971 and 1978, the population of Qwaqwa increased from 21,000 to 200,000 (Rogers Reference Rogers1980). A newspaper report in The Voice (4 April 1978) described that “Kroomdraai spread out around the hill, filling every available space with corrugated iron shacks and mud-brick houses.”
Due to the shortage of job opportunities and the fact that social grants were often not paid out in homelands, the survival of many families depended on subsistence farming. However, land ownership in most homeland areas was communal and local chiefs decided who could cultivate it (Sharp and Spiegel Reference Sharp and Spiegel1985; Mbaku Reference Mbaku1991). The possibility of moving from the camp to other areas within the homeland was very limited. Resettled people had little chance to obtain arable land, partly because land was scarce and relatively infertile and partly because they were perceived by local leaders to “have stolen their children’s land” (Green and Hirsch Reference Green and Hirsch1983, p. 83). The situation was exacerbated by the fact that people in resettlement camps were not allowed to own livestock except chickens (Desmond Reference Desmond1971). Due to the lack of economic opportunities, many men and women had to migrate for many months each year to work in the mining industry or as domestic workers.Footnote 9 This weakened the core family and further increased the necessity to broaden the social support base to include relatives, neighbors, and other community members.
In resettlement camps, “crime became a plague, ravaging the community” (Wilson and Ramphele Reference Wilson and Ramphele1989, p. 155), leading to the erosion of social capital (Louw and Shaw Reference Louw and Shaw1997). Yet, the national government had little incentive to interfere. To the contrary, intra-homeland conflict could serve the apartheid cause. News about these faction fights within homelands was then used to prove the dysfunction and inferiority of the Bantu people and to stoke fear of Africans among whites (Wilson and Ramphele Reference Wilson and Ramphele1989).
At the same time, economic hardship and endemic crime appeared to have facilitated the formation of new relationships. Surveys in resettlement camps show that in more than 95 percent of cases, the government assigned relocated people a plot of land (SPP 1983). Visiting relocation camps, Sharp and Spiegel (Reference Sharp and Spiegel1985, p. 144) observed that “arbitrary assignment to residential sites destroyed a range of existing relationships between people” and that many residents “lost all contact with kin.” Resettlement residents thus “attempt to construct networks of neighborliness for the purpose of giving and receiving and to express these relationship in the idiom of kinship” (Sharp and Spiegel Reference Sharp and Spiegel1985, p. 145). These broad networks helped to cope with uncertain and irregular income flows from remittances, especially since work opportunities were often on a short- term basis. Qualitative research from field work in the relocation camps shows that people often depended on informal networks of borrowing and support in the community (Platzky and Walker Reference Platzky and Walker1985, p. 363). This suggests that networks served as a form of insurance, as observed in other developing country contexts (Townsend Reference Townsend1994).
In sum, life in resettlement camps had elements of both cooperation and conflict. Adversity may have led to both conflict over scarce resources and the formation of new networks to cope with economic hardship. The ambiguous effect on social capital motivates the empirical investigation in this article.
DATA AND EMPIRICAL STRATEGY
Data
It is unclear if the anecdotal accounts of how large inflows of people disrupted social peace and caused violent conflict were isolated incidents or reflected a general pattern. Also, it is unclear if spells of conflict were temporary phenomena that abated once new living arrangements were settled or whether the social fabric of these places was permanently changed. The challenge to answering these questions is that the apartheid regime had no interest in collecting data on the exact number of relocated people or the dismal living conditions in the homelands, as this would have tainted the picture of “separate development” it aimed to project to the outside world (Desmond Reference Desmond1971, p. 16). This lack of data may explain the dearth of studies aiming to quantify the impact of the Bantustan system.
The most detailed data on the situation in the homelands were collected by the SPP. From 1980 to 1983, the SPP sent research teams to homelands to document violence and forced removal. Maps of the resettlement areas and numerous detailed case studies were compiled in a five volume report published in 1983. This is by far the most detailed information on the number of people removed and location of resettlement camps. Through extended field visits and inclusion of local people in the research project, the SPP was able to develop extensive contact with respondents, which enabled them to collect detailed accounts of communities’ experience and likely increased the quality of the data collected. In addition, I will use newly digitized micro-data from almost 1,000 surveys administered by the SPP.Footnote 10 To the best of my knowledge, this article is the first to use these data to investigate the (longer term) effects of forced removal under apartheid.
A second empirical challenge is how to measure social capital. Studies that measured social capital through membership in a voluntary association (Putnam, Leonardi, and Nanetti Reference Putnam, Leonardi and Nanetti1993; Alesina and La Ferrara 2002) have been criticized on the ground that this narrow measure does not adequately capture more informal forms of social capital (Letki Reference Letki2008). In particular, Fafchamps (Reference Fafchamps2006) argues that generalized trust can make interactions through clubs less necessary. In this study, I therefore measure social capital as levels of trust towards different groups, (perceived) violence, and attitudes towards the concept of a united country as these beliefs may affect “cooperation among members of a community” (Guiso, Zingales, and Sapienza Reference Guiso, Zingales and Sapienza2008, p. 296).
For the first set of results, I use data on people’s level of trust towards other people and ethnic groups collected in six waves of the Afrobarometer survey between 2000 and 2010 (Abel Reference Abel2019).Footnote 11 Respondents can report the level of trust towards different groups as (i) not at all, (ii) just a little, (iii) somewhat, or (iv) a lot. (Online Appendix Table A.1 reports the distribution of replies for the different measures of trust.) For my main specification, I follow Nunn and Wantchekon (Reference Nunn and Wantchekon2011) and transform responses to numeric values with “not at all” responding to 0 and “a lot” responding to 3. To assist with the interpretation of results, I also report estimates using a binary variable of trust (1 = “a lot” or “somewhat”; 0 = “not at all” or “just a little”).
Empirical Strategy
To isolate the effect of the inflow of relocated people, I look at differences in levels of social capital within homelands, which allows me to control for the distinct institutions, policies, and idiosyncratic shocks of each homeland. The SPP collected data on the exact location and estimates of the number of people relocated (see Figure 1).Footnote 12 Using geo-coded data, I compute the distance of Afrobarometer respondents living in former homeland areas to the closest resettlement camp.Footnote 13 I identify areas around these camps and compare these communities to others in the same homeland but further away from relocation camps. The empirical strategy I employ is based on the premise that effects of forced removal should be larger in close proximity to resettlement camps. This strategy is based on the assumption that outcomes of interest did not differ in these areas for reasons unrelated to the resettlement and that there was no selection on who moved out of these resettlement camps, both before and after mobility restrictions were lifted. I will provide evidence supporting these assumptions.
Specifically, I draw a radius around resettlement camps. The diameter of the radius depends on the estimated number of people that were resettled to a given camp. Based on estimates of typical plot sizes assigned to people (Platzky and Walker Reference Platzky and Walker1985; Desmond Reference Desmond1971, p. 235), I assume a population density of 150 people per square kilometer; a resettlement camp of 10,000 people would thus have a “treatment” area with a radius of 4.6 kilometers. Camps for which I do not have estimates on the number of resettled people get the average radius of other camps assigned. The variable camp i is a dummy for whether a person lives within this radius and in a former homeland. A second specification uses the distance (and squared distance) from the closest resettlement as a continuous measure. To account for the fact that the SPP did not conduct field work in each of the homelands and that some areas in more fragmented homelands like Bophutatswana did not have any large resettlement camps (see Figure 1), I restrict the control group to areas in former homelands located within a certain distance (60 km in the main specification) to the camps. In the Online Appendix, I show that results are robust to different choices of defining control and treatment areas.
Equation (1) shows the corresponding econometric specification:
 $${y_{ijth}} = \alpha + \beta {\rm{ }}cam{p_i} + homelan{d_h} + \gamma {X_i} + eth{n_j} + {\lambda _t} + {e_i}$$
(1)
The level of social capital (y ijth ) of individual i of ethnicity j surveyed at time t is regressed on an indicator variable for whether the person is living near a former resettlement camp (camp i ) or the distance from the camp (dist i ). homeland h is a set of indicator variables for each of the ten homelands. The variable ethn j is a set of ethnicity dummies.Footnote 14 λ t is a set of survey year dummies to control for secular time trends. Standard errors are clustered at the district level to account for correlation of location specific shocks.Footnote 15 (Results are robust to clustering at a higher level, as shown in Online Appendix Table A.6.) I estimate models using OLS, but results are robust to using ordered probit estimators.
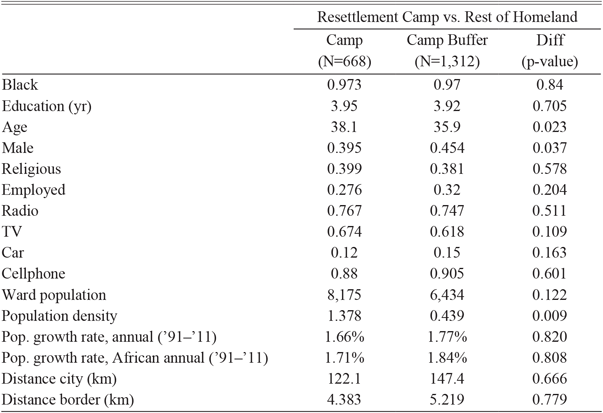
One concern with this analysis is that people in the comparison areas may differ in their levels of social capital for reasons unrelated to the removal policies. Indeed, Table 1 shows that while resettlement and comparison areas are balanced across measures of education and economic outcomes like assets and employment, the population near former resettlement camps is denser, on average older, and has a higher share of women. As a first pass, I address this problem by including specifications with individual control variables (X) such as gender, age, and education, and a dummy for whether respondents live in an urban area.Footnote 16 In the robustness section, I conduct a placebo test to rule out that contemporary differences in community characteristics and in particular population density explain results.
BALANCE TEST OF TREATMENT AND CONTROL AREAS

Note: Table compares sample in treatment areas (resettlement camp) to control area (buffer around camps). P-values reported from test of equal means. Data on population (growth) is from the South African census (2011).
Source: See the Online Appendix.
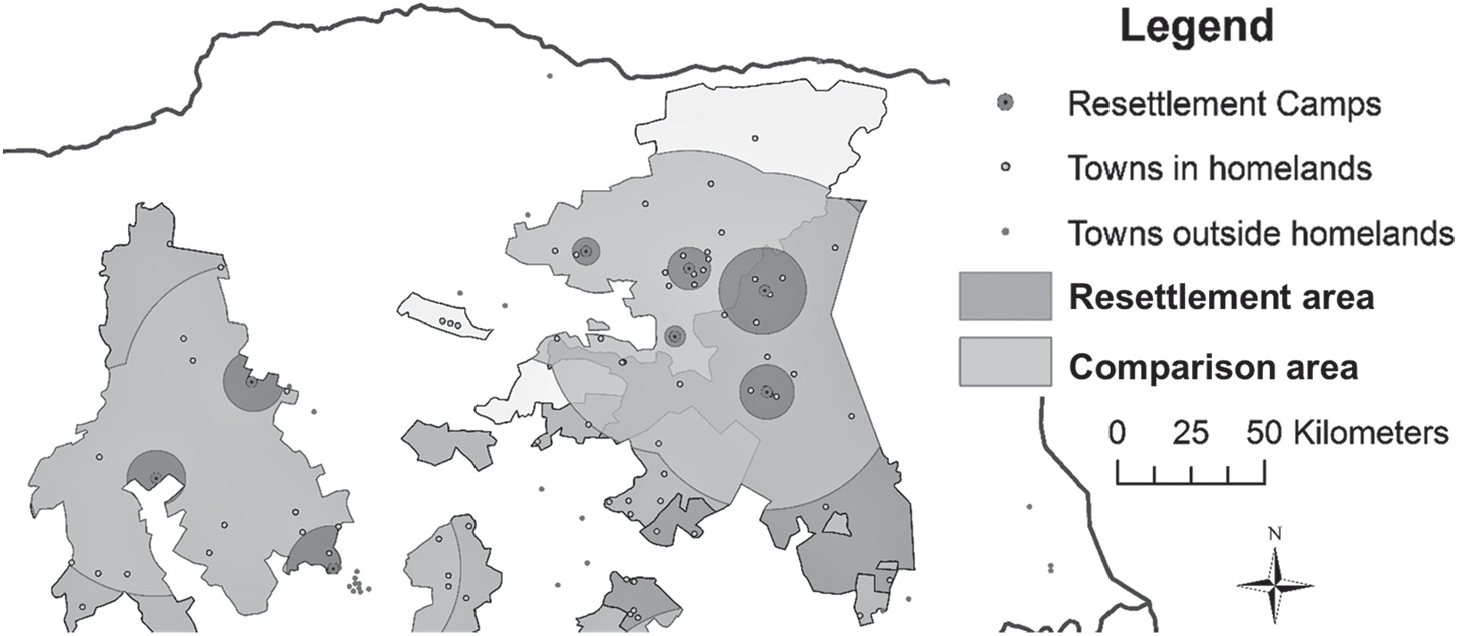
The coefficient of interest (β) is thus estimated from variation in the location of individuals of the same gender, age, education, wealth, ethnicity, living in the same former homeland, and province surveyed in the same year. It effectively tests whether levels of social capital differ in communities that were most affected by resettlement. Since the data do not have information on whether a person was actually relocated, estimates should be interpreted as the effects of relocation on the community, that is on both removed people and those previously residing in or near the relocation camp areas. Figure 2 depicts this estimation strategy visually: Specification (1) in effect compares levels of social capital of respondents in former homelands in the dark grey circle around the camps to those of respondents in the light grey buffer zone.
RESETTLEMENT CAMP ANALYSIS Note: The map (showing the northeast part of South Africa) visualizes the within homeland analysis.

One limitation of this empirical strategy is that available data do not allow me to distinguish between people that were relocated and those already living in the area before the removal policy. However, historic accounts document that camps were typically located on sparsely populated farm land (Green and Hirsch Reference Green and Hirsch1983), suggesting that results mainly capture effects on relocated people.
To learn about the persistence of effects, I conduct subgroup analyses for different age groups. If the Bantustan policies only affected people that actually experienced the resettlement, we would expect to find a larger effect for those who were alive during the height of the forced removal of the 1960s and 1970s. If, on the other hand, effects persisted, we would not expect to find significant differences in social capital for those not yet born or very young at the time of the Bantustan policies. Comparing how effects differ by age may also shed light on what channels can explain effects since groups were exposed to different “treatments”: while both groups grew up in the same communities only the older cohorts experienced the relocation and the environment in newly established resettlement camps.
To explore these questions, I estimate regressions with a dummy variable for whether people were born after 1975 (37 percent of sample) and an interaction term of this dummy with the camp i dummy.
 $${y_{ijth}} = \alpha + \beta cam{p_i} + \delta after75 + \sigma cam{p_i}*after{75_i} + homelan{d_h} + \gamma {X_i} + eth{n_j} + {\lambda _t} + {e_i}$$
If effects of the removal policies persist in the resettlement areas, we would expect σ to be insignificant.
Identification Assumptions
The identification strategy relies on the assumption that there were no differences in migration between resettlement and other homeland areas after mobility restrictions were lifted, as migration decisions may be correlated with levels of social capital. In particular, people may be attracted to or deterred from moving to former resettlement areas if levels of social capital and crime differed (Tiebout Reference Tiebout1956). While I cannot test this explanation conclusively given the data available, historical census data support the assumption that both resettlement and other homeland areas followed similar migration patterns. First, the 1996 census collects data on whether people moved and, if so, what year and from what district they migrated. Online Appendix Table A.2 compares observable characteristics of people migrating out of resettlement camp areas and other homeland areas between 1986 and 1996. Of six socio-demographic characteristics collected in the census, only differences in education levels are different at (marginally) significant levels. Second, I use census data from 1996 to 2011 to compare population growth rates between areas. I find that resettlement and comparison homeland areas have almost identical rates of population growth (annual rate of 1.66 vs. 1.72 percent, p-value=0.82, see Table 1).Footnote 17 These results are consistent with previous research documenting that there was no large-scale exodus from homelands after apartheid ended: Taryn Dinkelman (Reference Dinkelman2017) estimates that even after mobility restrictions were lifted, only 0.4 to 0.6 percent of the homeland adult population migrated each year, and Posel (Reference Posel2010) shows that most of the out-migration was temporary. Using Afrobarometer data, I also find that ethnic diversity remained almost identical between 2000 and 2010 suggesting that there was no selection into migration by ethnicity.
A second assumption related to migration is that relocated people stayed in resettlement camp areas and did not move to different parts of the homelands before mobility restrictions were lifted. While there are no data on within homeland relocation, there is evidence that within homeland migration was restricted. While living conditions were dismal, the apartheid regime often provided resettled people with a small plot of land in relocation camps but restricted free movement within homelands under the “betterment planning” policies (Platzky and Walker Reference Platzky and Walker1985).Footnote 18 Christopher (Reference Christopher2001) further points out that resettled people lacked the political clout and connection to tribal leaders to gain access to land outside the resettlement areas. Even if there was migration out of resettlement areas, this would attenuate my estimates unless migrants differed in their levels of social capital.
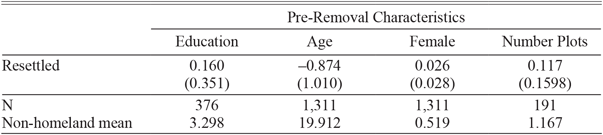
The empirical strategy also makes assumptions about pre-removal levels of social capital. First, it assumes that relocation areas did not already have different levels of trust before resettlement. To assess if the location of resettlement camps is driving the results, the robustness section tests how sensitive estimates are to controlling for various geographical measures. Second, the identification strategy assumes that Africans who were removed had similar initial levels of trust to those residing in parts of homelands used as control areas. There is suggestive evidence in support of this assumption. Data from SPP on resettlement flows show that the vast majority of people were relocated from areas close to homelands. Furthermore, the SPP conducted surveys starting in 1980 both in resettlement camps and in areas outside homelands that were close to communities that were resettled. Table 2 compares characteristics between these two groups and finds that people in both groups were comparable in terms of age, gender, and education (for those who completed schooling before the removals). In addition, both groups were predominantly engaged in farming and had comparable land holdings, supporting the assumption that there was no non-random selection into resettlement camps. The last piece of evidence supporting that effects are not driven by differences in social capital before the removals is that we see larger effects on social capital for the generation born after the removal that grew up in the resettlement communities.
COMPARING PEOPLE IN RESETTLEMENT AREAS TO THOSE IN AREAS OF ORIGIN

Note: In this sample, I compare areas removed from the Ladysmith area to those still living in close proximity to the place of origin of the resettled people to test whether a select group of people was relocated. I test the balance of characteristics that were determined before the relocation. Education years are restricted to people over 40 to limit the group to people who completed their education before the forced removals. The number of plots compares land holdings of those still residing outside homelands to land holding of people in camps before they were relocated from that area.
* p < 0.10, ** p < 0.05, *** p < 0.01
Source: See the Online Appendix.
While the evidence provided in this section and a battery of robustness tests presented in subsequent sections supports the validity of the identification assumptions, it is important to emphasize that some assumptions (e.g., of selective migration) cannot be conclusively tested with available historic data.
RESULTS
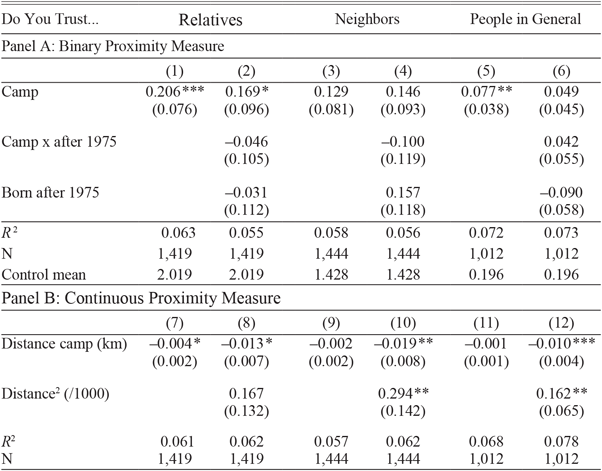
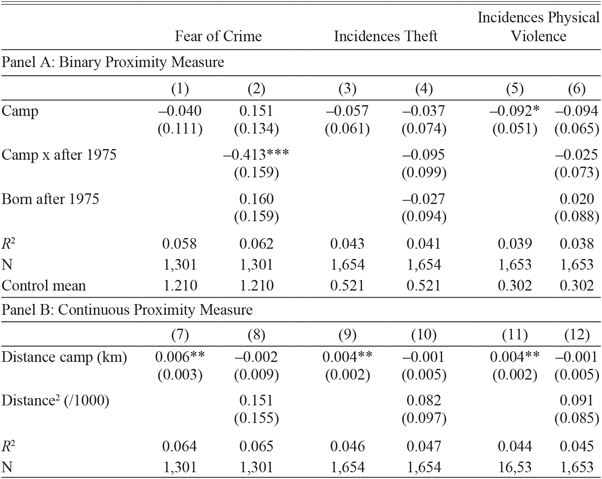
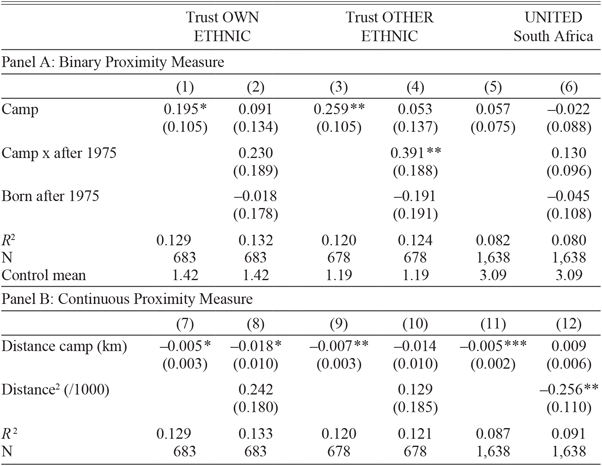
This section reports results on community cohesion, conflict, and inter-ethnic trust. The empirical tests will have a common structure (Tables 3 through 5): Panel A reports estimates of the difference in average levels of social capital between those in areas close to resettlement camps (camp) and those further away (Specification (1)). To test for persistence of these differences I estimate Specification (2), which includes a term of living near a resettlement camp interacted with a dummy for being born after 1975. To test for robustness, Panel B re-estimates Specification (1) with a continuous measure of distance to the closest resettlement camp. Panel B also reports estimates controlling for the squared distance to camps to test for non-linearities.
RESETTLEMENT AND LEVELS OF TRUST

* = Significant at the 10 percent level.
** ** = Significant at the 5 percent level.
*** = Significant at the 1 percent level.
Note: Robust standard errors (clustered at town level) in parentheses.
Results are from OLS Regression with Level of Trust (0=not at all to 3=a lot) as dependent variable. Trust towards people in general is measured by asking respondents Generally speaking, would you say that most people can be trusted? (1=yes,0=no). All regressions control for age and age-square, gender, living in urban area, employment, and an asset index as well as province and survey wave fixed effects (coefficients not reported). Columns (1), (3), (5), and (6) use distance to the nearest resettlement camp are computed in ArcGIS based from the SPP. Columns (2), (4), (6), and (8) interact the near camp dummy with a dummy indicating whether the respondent was born after 1975. The sample is limited to observations in former homelands living within 60 km of a camp. All regressions include dummies for the ten homelands and ethnic groups.
Source: See the Online Appendix.
Trust and Conflict
Table 3 reports the effect of living in or near a resettlement camp area on levels of trust towards relatives, neighbors, and people in general. Estimates suggest that people living in these areas are more trusting towards their relatives (Column (1)), people in general (Column (5)), and neighbors (Column (3)), although the latter result is estimated imprecisely and not statistically significant. These results are confirmed by the negative correlation between distance to resettlement camps and measures of trust (Panel B). The large coefficient on the squared distance further implies that the relationship between trust and distance to location camps is nonlinear, with levels of trust changing most quickly in close proximity to camps.
The magnitude of these estimates is sizable. Converting outcomes to binary variables, I find that the share of people strongly or somewhat agreeing that these groups can be trusted increases by 39.3 percent (7.7 percentage points (p.p.)) for people in general, 12.3 percent (8.3 p.p.) for relatives, and 11 percent (5.2 p.p.) for neighbors (Online Appendix Table A.3).
Testing for heterogeneous treatment effects by age, I find that none of the interaction term coefficients is statistically significant as shown in Columns (2), (4), and (6). This suggests that the effect of living in or near a former resettlement camp does not depend on the respondent’s age. Keeping in mind the caveat that subgroup analyses reduce the sample size and thus the precision of estimates, these findings provide some evidence that effects do not depend on actually experiencing the removal policies. One interpretation consistent with existing theories (Tabellini Reference Tabellini2008; Nunn and Wantchekon Reference Nunn and Wantchekon2011) is that the removal experience changed the values that parents passed on to their children. An alternative interpretation is that the circumstances in homeland communities that led to an increase in social capital did not change substantially even after removals ended, a point I will discuss later.
In sum, results suggest that there is substantial systematic variation in trust within former homelands. In areas near resettlement camps people are more trusting towards both people in their social network (relatives) and especially towards people in general. This is surprising as poverty and the general lack of resources in homelands were intensified by the overpopulation in relocation sites. Two possible explanations for these finding are that the experience of relocation more than three decades ago permanently increased social capital among those living in resettlement areas despite continuous conflict in these communities. As a second explanation, higher levels of social capital may have translated into more peaceful coexistence. To shed some light on which mechanism is at play, I next test whether perceived and actual crime levels are higher in former Bantustans and if they vary within homelands.
Table 4 reports results on whether people feared crime at home and the frequency with which they experienced theft or physical violence (0=never through 3=at least three times). Estimates draw a consistent picture across these three outcomes. People in former resettlement camp areas are both less afraid of crime and experience less theft and violence compared to those living in other parts of former homelands as shown in Columns (1), (3), (5), (7), (9), and (11). Coefficients are statistically significant for physical violence in Panel A and across all measures in Panel B. Effects on actual violence are sizable in magnitude with coefficients 11 and 30 percent of the control mean for measures of theft (Column (3)) and physical violence (Column (5)), respectively. While some of these estimates are imprecise, findings suggest that higher levels of social capital in former resettlement camps coincide with reduced crime, despite the fact that crime tends to be higher in urban areas. Looking at different age groups, I find that incidences of theft and violent crime do not vary by age (Columns (4) and (6)). An interesting pattern emerges when we compare perceived threat of crime between younger and older people living near former camps: those born before 1975 are more afraid of crime despite reporting fewer incidences of crime, while younger people fear crime much less compared to people in same age cohorts living further away from camps (Column (2)). One interpretation of this finding is that experiencing the events of forced removal had a traumatizing effect with long-term effects on the perception of safety despite actual improvements in security.
RESETTLEMENT AND LEVELS OF CRIME AND VIOLENCE

* = Significant at the 10 percent level.
** ** = Significant at the 5 percent level.
*** = Significant at the 1 percent level.
Note: Results are from OLS Regression. Robust clustered standard errors in parentheses.
All regressions control for age, gender, living in urban area, employment, and an asset index as well as province and survey wave fixed effects (coefficients not reported). Outcomes measure (0=Never, 3=Three or more times): Over the past year, how often have you or anyone in your family (i) feared crime in your own home?, (ii) had something stolen from your house, (iii) been physically attacked?
Source: See the Online Appendix.
Intra- vs. Inter-Ethnic Trust
If the apartheid strategy of dividing the black population by creating ethnically homogeneous communities succeeded, we may expect people growing up in resettlement communities to trust their own ethnic group more and other ethnic groups less. Results in Table 5, Column (1), show that within Bantustans, people indeed trust members of their own ethnicity more in former resettlement areas. Respondents are 11.4 percentage points (25.3 percent) more likely to agree or strongly agree that people of their own ethnicity can be trusted (see Online Appendix Table A.3). At first glance, one may interpret these results as evidence that apartheid’s identity politics succeeded in facilitating trust within ethnic groups. However, results in Column (3) show that there are even slightly larger positive effects with regard to trust towards different ethnicities: people living in former resettlements are 12 percentage points (30 percent) more likely to strongly or somewhat trust members from other ethnic groups compared to those living in other homeland areas (see Online Appendix Table A.3). Interestingly, I find that this increase in inter-ethnic trust is driven by cohorts born after the height of removals as shown in Table 5, Column (4). In sum, results suggest that the removal increased inter-ethnic trust and solidarity. I will discuss possible explanations for this finding later.
RESETTLEMENT AND INTER-GROUP TRUST AND NATIONAL IDENTITY

* = Significant at the 10 percent level.
** = Significant at the 5 percent level.
*** *** = Significant at the 1 percent level.
Note: Results are from OLS Regression. The top panel uses Level of Trust (0=not at all to 4=a lot) as dependent variable. All regressions control for age, gender, employment, and an asset index as well as province and survey wave fixed effects (coefficients not reported). The variable “United South Africa” is measured whether respondents agree (0=strongly disagree, 4=strongly agree) with the following statements: It is desirable to create one united South African nation out of all the different groups who live in this country. Standard errors in parentheses.
Source: See the Online Appendix.
I next explore whether effects of living in a resettlement camp area differed between members of ethnic majorities and ethnic minorities. I add to Specification (1) a dummy variable measuring whether a person is part of the ethnic minority in their former homeland area (43 percent) and an interaction term of living in a resettlement camp area and being a member of the ethnic minority. Results reported in Online Appendix Table A.5 provide suggestive evidence that treatment effects on measures of intra- and inter-ethnic trust are larger for members of ethnic minorities. Treatment estimates for ethnic minorities are twice as large for intra-ethnic trust (Column (8)) and more than three times as large for measures of inter-ethnic trust (Column (10)). However, these estimates are estimated imprecisely and not statistically significant.
As described earlier, a second strategy to create disunity within the black population was to foster ethnic identity through the promotion of tribal rituals, institutions, and customs. I investigate whether this resulted in less support for the idea of a united nation. This outcome can be regarded as a measure of social capital as desire for a united nation facilitates cooperation among members of a community, especially among those that are not part of the same immediate social network. Results in Table 5 show that people in regions close to former resettlement camps tend to have more support for the idea of a united country (see Columns (5) and (11)). However, the differences are not large in magnitude and only statistically significant in the specification using the continuous proximity measure.
ROBUSTNESS
Location of Camps
A potential concern with the identification strategy is that the location of resettlement camps was not random. As confirmed by Figure 1, these sites tended to be near homeland borders. People living in closer proximity to non-homeland cities may have different levels of social capital compared to communities at the center of Bantustans. Online Appendix Figure A.3 assesses how measures of social capital vary throughout the country by geographically interpolating data from the Afrobarometer survey.Footnote 19 The maps on the different social capital outcomes do not suggest that there is a clear pattern of spatial variation within homelands. For measures like trust towards neighbors it seems that levels are higher within centers of homelands whereas trust towards people in general appears higher in border areas of Bantustans.
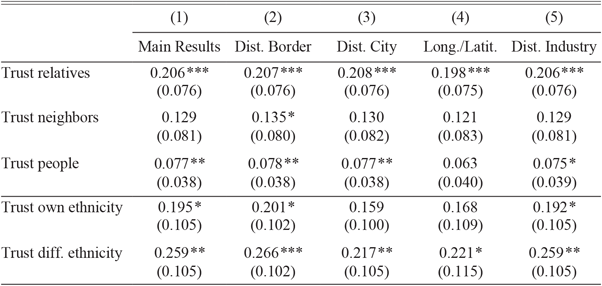
To formally test how sensitive results are to controlling for the location within homelands, Table 6 presents results from several robustness tests. Column (1) reports previous results of main Specification (1). Column (2) controls for the distance of respondents to the homeland border. All results remain significant suggesting that the geographic location is not driving the effects of resettlement camps. A related concern is that resettlement sites were often located in proximity to large cities to facilitate commuting of workers. This proximity may have affected social capital through interactions outside the homeland areas. To test this possibility, Column (3) controls for the distance to the nearest city with a population of at least 200,000. Results are robust to this specification. To further test the sensitivity of results to the location of homelands, Column (4) controls for the longitude and latitude of places as well as their squared values. Coefficients remain relatively stable, but are estimates less precise.
ROBUSTNESS TEST: PROXIMITY TO RESETTLEMENT CAMPS

* = Significant at the 10 percent level.
** = Significant at the 5 percent level.
*** = Significant at the 1 percent level.
Note: Robust clustered standard errors.
All regressions control for age, age square gender, living in urban area, religion, employment, and an asset index as well as province and survey wave fixed effects (coefficients not reported). Column (1) reports results of estimate Equation (1).
Column (2) controls for the distance of respondents to the homeland border. Column (3) controls for the distance to the nearest city with a population of at least 200,000. Column (4) controls for the longitude and latitude of place as well as their squared values.
Source: See the Online Appendix.
The concept of industrial centers in or adjacent to Bantustans referred to as “growth points,” formed the cornerstone of apartheid’s industrial policy (Geyer Reference Geyer1989; Kerby Reference Kerby2014). The goal of this industrial decentralization was to counter urban migration of Africans. As resettlement camps tended to be located in proximity to these zones, one may be concerned that results capture the effect of living close to an industrial area. The South African Statistical Yearbook from 1982 provides information on the location of growth points. Regressions in Column (5) control for the distance of respondents to the closest growth point. The fact that coefficients remain stable and statistically significant provides some evidence against the hypothesis that interaction at the workplace in these industrial zones is a main driver of developing social capital. It also alleviates concerns related to the endogenous placements of resettlements camps, which was partly determined by demand for African workers.
Placebo Resettlement Camps
The previous analysis showed that resettlement camp areas are more densely populated. In addition, a slightly larger share of my sample in these areas is older (Table 1). While I control for demographic differences in the empirical analysis, controlling for population density is problematic since it is a direct outcome of the resettlement policies (Angrist and Pischke Reference Angrist and Pischke2009). Concerns thus remain that the differences in social capital are the effect of unobservable differences between treatment and control areas. To address this concern, I use 2011 census data on the population of South Africa’s 4,278 wards to identify areas that are similar to resettlement camp areas. Specifically, I employ Mahalanobis distance matching to identify the wards that are most similar in terms of population density, ethnic fragmentation, and age composition (Rosenbaum and Rubin 1985). I then re-estimate Model (1) using the centroid of these matched wards as the location of placebo resettlement camps (see Figure 3).
PLACEBO CAMP ANALYSIS

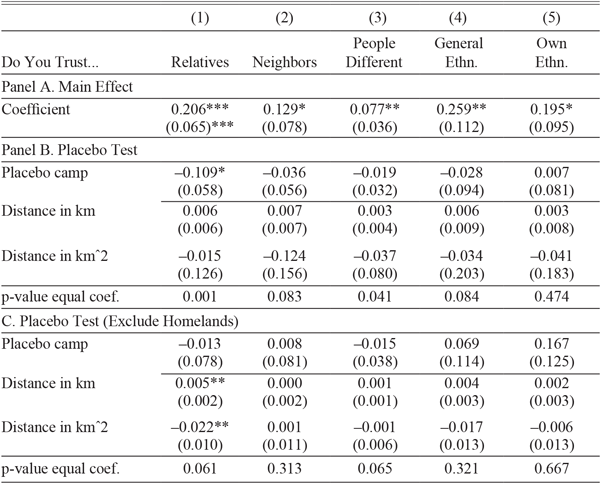
Table 7 summarizes results of this placebo test for the main social capital outcomes. Panel A reports the results of the previous analysis against which I compare placebo estimates. To increase the pool of potential comparison areas, Panel B uses matches from non-homeland and homeland areas (excluding the original treatment sample and the more urban Gauteng and Western Cape provinces). I report regression estimates using both the binary treatment variable, Equation (1), and the distance from the camp as a continuous treatment variable.Footnote 20 Results show that most of the placebo coefficients are close to zero and insignificant. The only significant effect (Column (1)) is of the opposite sign than the main effect. The last row reports p-values of an F-test that tests if the main and placebo coefficients (of the binary treatment variable) are equal. Results show that I can reject this hypothesis for all but one outcome at significant levels, which lends support to the interpretation that the original findings are the result of resettlement rather than differences in community characteristics. Results for this placebo test are qualitatively similar when I restrict placebo camps towards outside of homelands (Panel C).Footnote 21
PLACEBO TEST

* = Significant at the 10 percent level.
** = Significant at the 5 percent level.
*** = Significant at the 1 percent level.
Note: Robust clustered standard errors.
Panel B (C) present results that estimate Specification (1) with placebo camp inside (outside) former homelands. P-values are reported from a test of equal coefficients of the main and placebo camp coefficient.
Source: See the Online Appendix.
Spatial Correlation and Estimation Specification
Social capital outcomes like trust are likely to be spatially correlated. For example, local events like crime may affect levels of trust in a community. Failing to address this correlation in the empirical analysis would overestimate the precision of estimates and thus risks false rejections of the null hypotheses. Acknowledging that levels of social capital may be correlated beyond the city level, I allow for clustering in the error covariance matrix at the district level in the previous analysis. However, it is plausible that outcomes are affected by policies at the homeland or province level, which would require clustering standard errors at a more aggregate level. As it is difficult to identify the correct aggregation level (Cameron and Miller 2010), I test how robust results are to using different levels of clustering. Given the small number of province and homeland clusters, I employ bootstrap procedures to estimate standard errors at these levels (Cameron, Gelbach, and Miller Reference Cameron, Gelbach and Miller2008). Online Appendix Table A.6 shows that while standard errors tend to increase at higher aggregation levels, almost all of the estimates remain significant.
The estimation model controls for a covariate vector that includes the gender, age, education level, and employment status of respondents. One may be concerned that the latter variables may themselves be affected by the removal policies and would thus bias treatment effect estimates. Results (not reported) show that all coefficients remain significant and qualitatively identical when I estimate Equation (1) without the control variate vector X. Results (not reported but available upon request) show that findings are also very robust to using ordered probit estimators for specifications with ordinal outcome measures.
Last, I test how sensitive results are to different choices of defining treatment and control areas. Online Appendix Figure A.1 shows how coefficients change for different definitions of resettlement area. As one would expect the treatment effect decreases as I increase the distance. Note that the range from 6 to 12 kilometers corresponds to assumed population densities at the original resettlement site ranging from about 50 to 200 people per square kilometer. Online Appendix Figure A.2 shows that estimates are robust for different choices of defining the control area.
DISCUSSION
The main result, that people in former resettlement areas have higher levels of social capital, is somewhat surprising in light of the existing literature. In particular, the finding that levels of inter-ethnic trust are higher in the more ethnically heterogeneous relocation camps stands at odds with a number of studies that find a robust positive relationship between ethnic fragmentation and conflict (Easterly and Levine Reference Easterly and Levine1997; Esteban and Ray Reference Esteban and Ray1999; Herbst Reference Herbst2000; Rohner, Thoenig, and Zilibotti Reference Rohner, Thoenig and Zilibotti2013; Caselli and Coleman 2013; Arbatli et al. forthcoming). Likewise, results showing that levels of trust were generally higher in resource-deprived relocation camps contrast with previous studies documenting a positive relationship between standards of living and social capital (Li, Pickles, and Savage Reference Li, Pickles and Savage2005; Letki Reference Letki2008). This section discusses potential mechanisms that could explain these results. While the argument remains inconclusive due to the lack of available data, these hypotheses may provide guidance for future research.
Identity and Social Capital
The finding that people in former resettlement areas have higher levels of trust towards both people in the immediate social network and especially people in general may be related to the phenomenon that shared crises can create shared interests and shared identities (Putnam Reference Putnam2002). The shared experience of being forcefully removed by the apartheid regime and living in hardship may have reduced socio-economic and ethnic cleavages, created a common identity as displaced people, and led to a “unified consciousness of shared racial grievances” (Posel 2011, p. 323). However, the social psychology literature is ambiguous on the effects of social interactions on attitudes towards people from different backgrounds. Results from laboratory experiments show that interaction between members of different groups reduces conflict in cooperative situations but has the opposite effect in competitive settings (Cooper Reference Cooper1999; Pettigrew and Tropp Reference Pettigrew and Tropp2006).
What is interesting about the homeland context is that it had both cooperative and competitive elements. On the one hand, scarcity exacerbated conflict over resources but on the other hand, people needed to expand their support networks and could rally around the common goal of fighting the apartheid regime. The fact that we observe higher social capital levels in resettlement areas suggests that the cooperative elements outweighed the competitive ones. In addition, conflict and deprivation may have abated over time while the common goal of fighting apartheid remained, which could explain why we see larger positive effects for most trust measures among younger cohorts.Footnote 22 The 1981–1983 SPP surveys support this hypothesis: of almost 600 respondents in resettlement camps, 69.6 percent said that the relationship with their neighbors was either good or very good; 27.9 percent reported to have a peaceful coexistence or limited contact; and only 2.5 percent say they had some form of conflict or disagreement (SPP 1983). In addition, there are numerous accounts of solidarity and friendship between people that ended up as neighbors by government assignment.
The apartheid regime’s treatment of inhabitants of each homeland as one people may have further strengthened the notion of shared interests and the image of a common enemy. This phenomenon has been observed in other refugee camp settings. Napier-Moore (Reference Napier-Moore2005) describes how long-term Somali refugees in the northwest of Kenya developed a “refugee identity” and a study of Palestinian camps concludes that through “Libya’s expulsion of Palestinians and Israel’s policies of collective punishment …[created] a sense of collective identity… reinforced and strengthened in narratives of self and collectivity” (Peteet Reference Peteet, Guidry, Kennedy and Zald2000, p. 186).
Diversity and Social Capital
Alesina and La Ferrara (2000) find that in more racially or ethnically fragmented areas of the United States, social capital measured as the participation in associational activities such as clubs, religious groups, or sport groups is significantly lower. The authors explain this finding with a “natural aversion to heterogeneity” (Alesina and La Ferrara 2002, p. 225). Yet, despite careful attempts to control for potential statistical confounders, the negative correlation between heterogeneity and trust may be driven by unobserved variables.Footnote 23 This study attempts to address this concern by investigating an arguably exogenous shock to the ethnic diversity of people’s communities.
Findings in this article suggest that instead of dividing the African population, forced removal to homelands increased trust between different ethnic groups. To further explore these results, I measure how ethnic fragmentation varies within homelands. I use 2011 census data to compute an ethnic fractionalization index (at the ward level), defined as (Esteban, Mayoral, and Ray Reference Esteban, Mayoral and Ray2012):
 $$F = \mathop \sum \limits_{i = 1}^m {n_i}\left( {1 - {n_i}} \right),$$
with population shares n i of each of the ethnic groups. The index has values between zero and one. The value zero presents a ward in which only one group comprises the population. Values closer to one present populations with many equally large population groups.Footnote 24 I compute the ethnic fragmentation index of wards within 15 km to the camps and those within 16–60 km from the camps. The average fragmentation index for areas near resettlement camps is 0.256 compared to 0.232 of areas further away from the camps indicating that areas near relocation sites are more ethnically fragmented than other parts of homelands.Footnote 25 (The difference in means is 0.14 standard deviations.)
It is likely that people in resettlement camps interacted more frequently with people from different backgrounds, especially since people did not have any say about which plot within camps they were assigned: in fact, of the almost 900 resettled people asked by the SPP how their land or house was allocated, less than ten people replied that they chose their own plot or purchased it (SPP 2016). These artificially created residential spaces forced people to interact with people of different backgrounds and ethnicities. Findings in this study suggest that by providing opportunities for heterogeneous interactions and inter-ethnic experiences, resettlement camps inadvertently contributed to the development of social capital between ethnic groups. Recent studies on the effect of interacting with people from diverse backgrounds on trust and tolerance draw similar conclusions (Clingingsmith, Khwaja, and Kremer Reference Clingingsmith, Khwaja and Kremer2009; Rao Reference Rao2019; Burns, Corno, and La Ferrara 2015; Okunogbe Reference Okunogbe2015).
It is difficult to distinguish the importance of these two and other potential channels in explaining the observed effect on social capital since relocation simultaneously affected both diversity and adversity. In an attempt to shed light on this question, I take advantage of the fact that we observe variation in ethnic fragmentation across resettlement camps; while relocation created adversity in all camps, the level of ethnic diversity differed. If interactions with people from different backgrounds created inter-ethnic trust, we should observe higher levels of trust in more diverse camps.
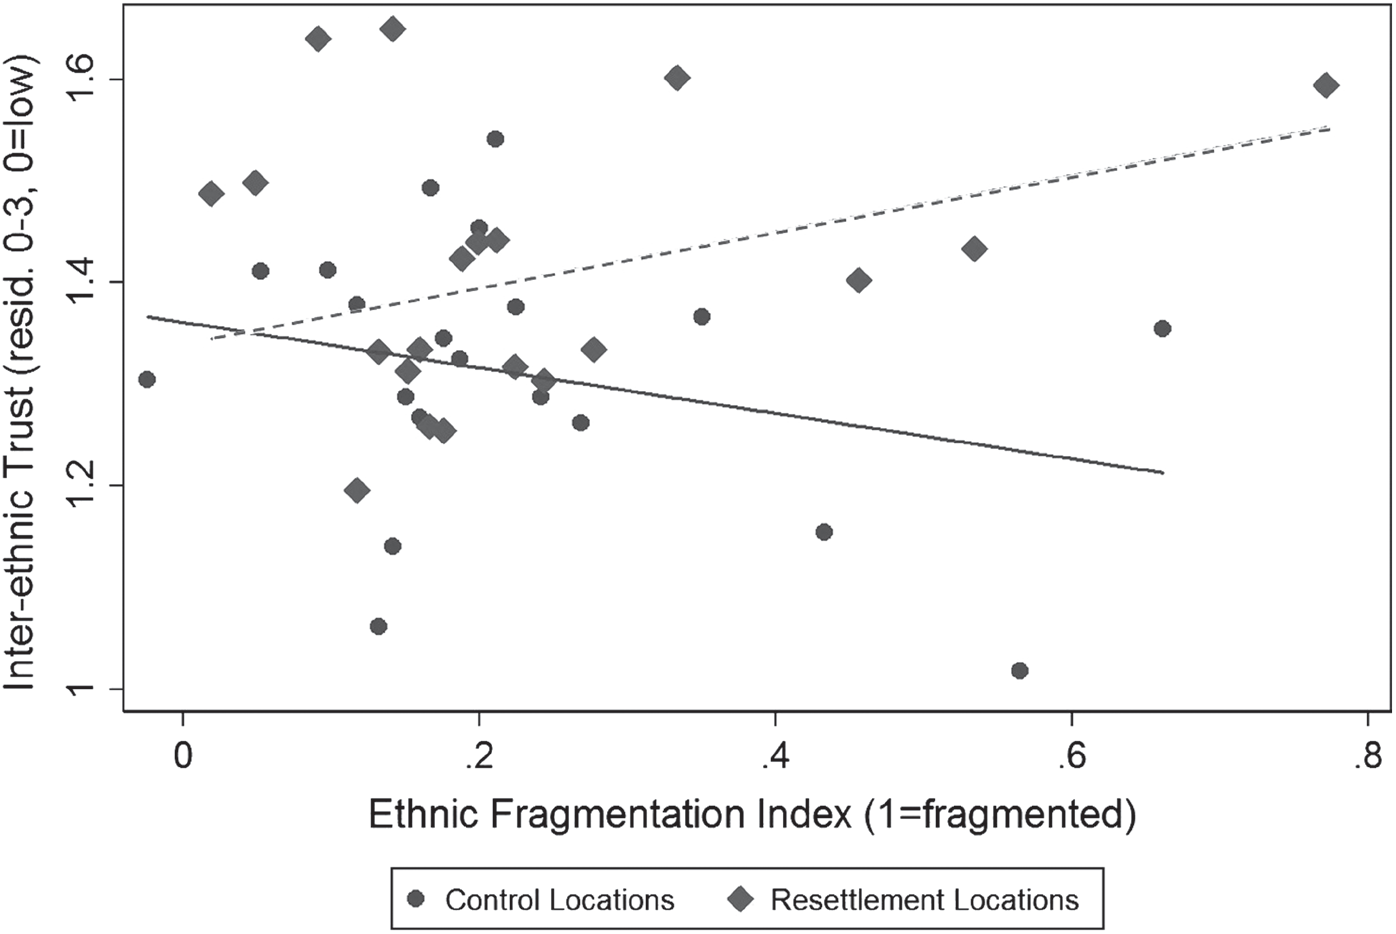
Figure 4 shows the relationship between ethnic fragmentation and (residualized) inter-ethnic trust. The solid fitted line shows that there is a negative correlation in non-resettlement camp homeland areas.Footnote 26 Interestingly, the relationship is reversed for the relocation camp areas (depicted by the dashed fitted line). The difference in slope is marginally statistically significant (p-value: 0.059). While areas with low levels of ethnic fragmentation have very similar levels of inter-ethnic trust, the difference increases in the level of ethnic diversity. This pattern is consistent with the explanation that the observed negative correlation between diversity and inter-ethnic trust observed in the control areas and various other contexts previously studied is due to unmeasured differences across communities whereas the plausibly exogenous increase in ethnic fragmentation due to relocation facilitated inter-ethnic trust. Taken at face value, this finding may thus help to reconcile the paradox in the existing literature that inter-ethnic contact at the micro-level appears to increase trust while more diverse communities seem less trusting at the aggregate level. However, this test remains inconclusive since I do not observe whether the degree of diversity among relocation camps is correlated with unobserved factors that may affect trust.
ETHNIC FRAGMENTATION AND INTER-ETHNIC TRUST

CONCLUSION
Large scale resettlements of people are expected to become increasingly common, both due to effects of climate change and conflict. How to cope with the large movements of people is considered one of the key humanitarian and geo-political challenges in the twenty-first century. While these events often present humanitarian catastrophes, Putnam (Reference Putnam2002) points out that experiences of destruction and violence have the potential to create a sense of cooperation. The present article studies this question in the context of one of history’s largest social engineering exercises, the apartheid regime’s forceful removal of some 3.5 million black South Africans to homelands.
I investigated how the forced removal affected the “new South Africa” through its long-term effect on social capital and identity. Using data collected 5 to 15 years after the end of the apartheid, I find that communities that were affected by large in-migration of relocated people during the 1960s and 1970s have higher levels of social capital. In particular, I show that people in these communities are more trusting towards their relatives and people in general as well as towards members of both their own and different ethnic groups. Despite the apartheid’s goal of creating ethnically homogeneous homelands and stirring disunity among Africans, these results suggest that it instead increased understanding of and trust towards different groups, despite potential short-term conflict about resources. One explanation is that the ANC and other opposition groups succeeded in promoting solidarity among the oppressed people, leading to the formation of new support networks among relocated people. In addition, resettlement may have facilitated a common identity that bridged ethnic cleavages within the African community. The implications are of historic importance. Posel (2011, p. 329) speculates that, “everyday racial crossings opened … spaces for political allegiances, solidarity and friendship that would ultimately contribute critically to the [apartheid] regime’s demise.” The hopeful findings of this study contrast with much of the existing literature, which finds that ethnically fragmented areas in Africa have more incidents of conflict and lower levels of development.