I. INTRODUCTION
In the severe and complex corrosive oil and gas wells with high temperature and high pressure as well as with high H2S, CO2, Cl−, and organic sulfur,Reference Liu, Wang and Wei1 the pipe must meet the requirements of good physical and mechanical properties and high corrosion resistance. Traditional stainless steels are difficult to serve in this harsh environment. Therefore, it is necessary to investigate a potential application of nickel-based alloys containing high content of chromium, nickel, and molybdenum as an oil well pipe material.
Incoloy028 (Fe–Ni–Cr–Mo) alloy is a low carbon austenite alloy, in which the copper content is about 1% (weight). Because of low carbon content and high contents of chromium, molybdenum, and copper, its comprehensive corrosion resistance and chloride ion stress corrosion resistance are good, and more, excellent intercrystalline corrosion resistance. However, it is difficult to adopt the method of hot piercing process for Incoloy028 alloy due to its large hot deformation resistance. Hot extrusion process is the unique method at present and the extrusion deformation only can be completed in a short period at high temperature by controlling the extrusion processing parameters, strain rate usually changes with ten orders of magnitude.
The sine-hyperbolic equations are widely used for modeling flow stress evolutions of steels and other alloys, such as IN690 alloy,Reference Sun, Liu, Li, Zhang and Dong2 Incoloy800H.Reference Sun, Liu, Li and Zhang3 Sun studied the constitutive equation of Incoloy028 alloy in temperature range of 1223–1423 K and strain rate range of 0.01–30 s−1, he got one general constitutive equation.Reference Sun, Liu, Zhang, Li and Wang4
The hot working maps have been successfully used to analyze many alloys. MurtyReference Murty and Rao5 analyzed the instability criteria of IN718 in the strain rate range of 0.001–100 s−1. The processing map has been used by CaiReference Cai, Xiao, Liu, Sun and Yao6 to analyze Ni-based super alloy. SunReference Sun, Liu, Zhang, Li and Wang4 had studied the hot working maps of Incoloy028 alloy, but these maps have limited guidance to hot extrusion process.
In this paper, on basis of the results of compression tests, the specific constitutive equations in temperature range of 1223–1473 K and strain rate range of 0.1–50 s−1 will be analyzed and modeled with the thermal general constitutive equations developed by Sellars and Tegart.Reference Sellars and Tegart7 In addition, the hot working maps will also be established, which can be used to guide hot extrusion deformation process of Incoloy028 alloy pipe.
II. EXPERIMENTAL PROCEDURES
The chemical compositions of Incoloy028 alloy used in this study were: Ni30–34, Cr26–28, Mo3–4, Mn < 2.5, Si < 1, Cu0.6–1.4, P < 0.03, S < 0.03, and balance Fe. The raw material was a die-cast ingot produced by electro-slag re-melting process. The bar-shaped billet with a diameter of 400 mm was made by forging the cast ingot with a radial forging machine (GFM1800, GFM, Steyr, Austria). To reduce the precipitated phase of Incoloy028 billet, the solid solution treatment at 1423 K was adopted after the billet was forged.
Cylindrical specimens (10 mm in diameter and 15 mm in height) for compression tests were cut and machined from the forged bar. Hot compression tests were conducted on a Gleeble-3800 thermo-mechanical simulator (Dynamic Systems Inc., New York, New York) at the temperature range of 1223–1473 K with intervals of 50 K at different strain rates ranging from 1 to 50 s−1. The top and bottom surfaces of specimens were coated with graphite/teflon paste to reduce the friction between anvil and specimens. All the specimens were heated up to 1473 K at a heating rate of 5 K/s and held for 3 min to obtain uniform microstructure. The specimens were then cooled down to different testing temperatures at a cooling rate of 5 K/s and held for 2 min prior to every test, and deformed to the height of 7.5 mm (50% reduction in height) corresponding to a true strain of 0.60 and then the compressed specimens were water-quenched to room temperature immediately. The strain and stress values obtained could be arranged to outline true strain–stress curves.
The samples were sectioned in the center for microstructure analysis. The sectioned samples were then progressively ground to 2000 grids with SiC sand paper, whereupon they underwent electrolytic polishing. Electrolytic corrosion was done in a 10% H2C2O4 solution for 20 seconds to reveal the microstructure, connected to power supply 20 times, and the solution temperature is 298 K. The optical metallographic microscope type is TS100 (Nikon, Tokyo, Japan).
III. RESULTS AND DISCUSSIONS
A. Flow stress–strain curves
Based on the isothermal hot compression tests results, the load–stroke curves obtained at different temperatures and strain rates were converted into true strain–stress curves. Figure 1 shows the typical flow stress curves of Incoloy028 at various temperatures (1223–1473 K) and strain rates (1–50 s−1). Obvious viscoplastic behavior can be observed. The flow stress increases with the increase in strain. When the strain rises up to a certain value, the flow stress becomes stable and even decreases. Moreover, the evolution of all the flow stress curves follows the same trend, i.e., an increase at the initial stage followed by a gentle decrease or a plateau. The increase in the initial stress was caused by dislocation entanglement and pile-ups and the increasing strain energy of deformed grains. The decrease about flow stress is due to the combined effects of dynamic recovery and recrystallization, which led to the dislocation annihilation. When a dynamic balance was achieved between the dislocation aggregation and annihilation, the flow stress plateaus could be observed. In the case of high strain rate (50 s−1) conditions, dynamic recovery led to the dislocation annihilation as a result of dislocation slipping and climbing.
Stress–strain curves at various temperatures and strain rates of (a) 0.1 s−1, (b) 1 s−1, (c) 10 s−1, and (d) 50 s−1.

B. Constitutive equations
Zener and Hollmon proposed and verified the relationship between strain rate and temperature; Z parametersReference McQueen and Ryan8,Reference Zener and Hollomon9 can be used to describe the relationship, which were expressed by Eq. (1).
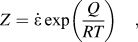 $$Z = {{\dot \varepsilon }}\,\exp \left( {{Q \over {RT}}} \right)\quad ,$$
where  ${{\dot \varepsilon }}$ is strain rate, T is deformation temperature, R is molar gas constant, Q is hot deformation activation energy.
The hot deformation process is controlled by thermal activation energy, the flow behavior of which can be expressed by the relationships between flow stress σ, strain rate  ${{\dot \varepsilon }}$, and deformation temperature T. StudiesReference Takuda, Fujimoto and Hatta10–Reference Sakai and Jonas12 have shown that following relationships existed among σ,
 ${{\dot \varepsilon }}$, and T.
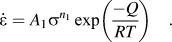
At low stress conditions, the relationship meets power exponential function.
 $$\dot \varepsilon = {A_1}{\sigma ^{{n_1}}}\,\exp \left( {{{ - Q} \over {RT}}} \right)\quad .$$
At high stress conditions, the relationship meets exponential function.
 $$\dot \varepsilon = {A_2}\,\exp (\beta \sigma )\,\exp \left( {{{ - Q} \over {RT}}} \right)\quad .$$
At all stress conditions, the relationship meets hyperbolic sine function.
 $$\dot \varepsilon = A{[\sinh (\alpha \sigma )]^n}\,\exp \left( {{{ - Q} \over {RT}}} \right)\quad ,$$
where σ is flow stress, A 1, A 2, A, n 1, n, α, and β are constants, and α = β/n 1. Take natural logarithm at both sides at Eqs. (2)–(4), respectively, the Eqs. (5)–(7) can be obtained.
At low stress conditions:
 $$\ln \,\dot \varepsilon = {n_1}\ln \,\sigma + \ln\, {A_1} - Q/(RT)\quad .$$
At high stress conditions:
 $$\ln \,\dot \varepsilon = \beta \sigma + \ln\, {A_2} - Q/(RT)\quad .$$
At all stress conditions:
 $$\ln \,\dot \varepsilon = n\ln \left[ {\sinh \left( {\alpha \sigma } \right)} \right] + \ln \,A - {Q \mathord{\left/ {\vphantom {Q {\left( {RT} \right)}}} \right. \kern-\nulldelimiterspace} {\left( {RT} \right)}}\quad .$$
When the temperature remains unchanged, n 1, β, n are slopes of the curves of  $\ln\, \dot \varepsilon - \ln\, {\rm{\sigma }}$,
 $\ln\, \dot \varepsilon - \sigma$,
 $\ln\, \dot \varepsilon - \ln \left[ {\sinh (\alpha \sigma )} \right]$, respectively. The curves of
 $\ln\, \dot \varepsilon - \ln\, \sigma$ and
 $\ln\, \dot \varepsilon - \sigma$ will be obtained when taking one-dimensional linear regression, the values of n 1 and β are slopes of the curves. According to α = β/n 1, the value of α can be gotten. Because the peak stress can reflect the maximum load that the material withstands in process of hot deformation, it is significant to establish the relationship among peak stress and thermal deformation condition, the stress involved in this study is peak stress.
The relational expressions of  $\ln\, \dot \varepsilon - \ln\, \sigma$ at different temperatures could be described by following equations and the relation diagram was shown by Fig. 2.
Diagram of  $\ln\, \dot \varepsilon - \ln\, \sigma$ at different temperatures.
When T is 1223 K,  $\ln\, \dot \varepsilon = 11.529\ln\, \sigma - 65.067\quad .$
When T is 1273 K,  $\ln\, \dot \varepsilon = 17.832\ln\, \sigma - 98.058\quad .$
When T is 1323 K,  $\ln\, \dot \varepsilon = 14.395\ln\, \sigma - 76.516\quad .$
When T is 1373 K,  $\ln\, \dot \varepsilon = 13.223\ln\, \sigma - 67.711\quad .$
When T is 1423 K,  $\ln\, \dot \varepsilon = 10.815\ln\, \sigma - 53.389\quad .$
When T is 1473 K,  $\ln\, \dot \varepsilon = 9.850\ln\, \sigma - 46.916\quad .$
The relational expressions of  $\ln\, \dot \varepsilon - \sigma$ at different temperatures could be described by following equations and the relation diagram was shown by Fig. 3.
Diagram of  $\ln\, \dot \varepsilon - \sigma$ at different temperatures.
When T is 1223 K,  $\ln\, \dot \varepsilon = 0.036\sigma - 10.610.$
When T is 1273 K,  $\ln\, \dot \varepsilon = 0.069\sigma - {\rm{16}}{\rm{.903}}\quad {\rm{.}}$
When T is 1323 K,  $\ln\, \dot \varepsilon = 0.068\sigma - 13.964\quad .$
When T is 1373 K,  $\ln\, \dot \varepsilon = 0.074\sigma - 12.599\quad .$
When T is 1423 K,  $\ln\, \dot \varepsilon = 0.079\sigma - 11.322\quad .$
When T is 1473 K,  $\ln\, \dot \varepsilon = 0.077\sigma - 9.222\quad .$
Thus the average value of n 1 is 12.941, the average value of β is 0.06721, according α = β/n 1, and the value of α is 0.00519. The relational expressions of  $\ln\, \dot \varepsilon - \ln \left[ {\sinh (\alpha \sigma )} \right]$ at different temperatures could be described by the following equations and the relation diagram was shown in Fig. 4.
Diagram of  $\ln\, \dot \varepsilon - \ln\, \left[ {\sinh \left( {\alpha \sigma } \right)} \right]$ at different temperatures.
When T is 1223 K,  $\ln\, \dot \varepsilon = 6.561\ln \left[ {\sinh (0.00519\sigma )} \right] - 4.845\quad .$
When T is 1273 K,  $\ln\, \dot \varepsilon = 11.542\ln \left[ {\sinh (0.00519\sigma )} \right] - 5.765\quad .$
When T is 1323 K,  $\ln\, \dot \varepsilon = 10.449\ln \left[ {\sinh (0.00519\sigma )} \right] - 2.528\quad .$
When T is 1373 K,  $\ln\, \dot \varepsilon = 10.398\ln \left[ {\sinh (0.00519\sigma )} \right] - 0.115\quad .$
When T is 1423 K,  $\ln\, \dot \varepsilon = 9.296\ln \left[ {\sinh (0.00519\sigma )} \right] + 2.143\quad .$
When T is 1473 K,  $\ln\, \dot \varepsilon = 8.600\ln \left[ {\sinh (0.00519\sigma )} \right] + 3.706\quad .$
Temperature is an important parameter in deformation process at high temperature, which affects deformation difficulty degree of Incoloy028 alloy directly. When the strain rate remains constant, assume that the activation energy Q remains constant in a small temperature range, the Eq. (8) can be expressed as follows:
 $$\ln \left[ {\sinh \,\alpha \sigma } \right] = A' + B'{{1000} \over T}\quad ,$$
where  $A' = (\ln\, \dot \varepsilon - \ln\, A)/n$,
 $B' = Q/(1000nR)$, take peak stress and deformation temperature into Eq. (8), the relation diagram of
 $\ln \left[ {\sinh (\alpha \sigma )} \right] - 1000/T$ was shown by Fig. 5. Take linear regression analysis on expression (8), the relational expressions of
 $\ln \left[ {\sinh (\alpha \sigma )} \right] - 1000/T$ at different strain rates can be described by following equations.
Diagram of  $\ln\, \dot \varepsilon - \ln\, \sigma$ at different strain rates.
When  ${{\dot \varepsilon }}$ is 0.1 s−1,
 $\ln [\sinh (0.00519\sigma )] = 8.623(1000/T) - 6.528\quad .$
When  ${{\dot \varepsilon }}$ is 1 s−1,
 $\ln \left[ {\sinh \left( {0.00519{\rm{\sigma }}} \right)} \right] = 7.568\left( {1000/T} \right) - 5.467\quad .$
When  ${{\dot \varepsilon }}$ is 10 s−1,
 $\ln \left[ {\sinh \left( {0.00519\sigma } \right)} \right] = 8.557\left( {1000/T} \right) - 6.004\quad .$
When  ${{\dot \varepsilon }}$ is 50 s−1,
 $\ln \left[ {\sinh \left( {0.00519\sigma } \right)} \right] = 9.958(1000/T) - 6.885\quad .$
To master the hot working property and describe the plastic deformation law at high temperature of Incoloy028 alloy, it is necessary to establish deformation constitutive equations. Take partial differential to Eqs. (7) and (8), the Eq. (9) can be gotten.
 $$Q = R{\left\{ {{{\partial \ln \left[ {\sinh \left( {\alpha \sigma } \right)} \right]} \over {\partial \left( {{1 \over T}} \right)}}} \right\}_{\dot \varepsilon }}{\left\{ {{{\partial \ln \,\dot \varepsilon } \over {\partial \ln \left[ {\sinh \left( {\alpha \sigma } \right)} \right]}}} \right\}_T}\quad .$$
Take the slopes of  $\ln \left[ {\sinh \left( {\alpha \sigma } \right)} \right] - 1000/T$ and
 $\ln\, \dot \varepsilon - \ln \left[ {\sinh \left( {\alpha \sigma } \right)} \right]$ into Eq. (9), the activation energy Q at different strain rates can be gotten, as shown in Table I:
Activation energies at different strain rates.

We can find out that the activation energy changes with strain rate, activation energy is 679.21 kJ/mol when strain rate is 0.1 s−1, the activation shows the tendency of increase when strain rate is larger than 1 s−1.
Take Eq. (4) into Eq. (1), Eq. (10) can be gotten, as follows:
 $$Z = A{\left[ {\sinh \left( {\alpha \sigma } \right)} \right]^n}\quad .$$
Take logarithmic function at both side of Eq. (10), Eq. (11) can be gotten, as follows:
 $$\ln \,Z = \ln\, A + n\left[ {\ln \sinh \left( {\alpha \sigma } \right)} \right]\quad .$$
The relational expressions of  ${\rm{ln}}\,Z - \ln \left[ {\sinh \left( {\alpha \sigma } \right)} \right]$ at different strain rates can be described by the following equations. The relation diagram of
 $\ln\, Z - \ln \left[ {\sinh \left( {\alpha \sigma } \right)} \right]$ was shown by Fig. 6. Take linear regression fitting on the data points of
 $\ln\, Z$ and
 $\ln \left[ {\sinh \left( {\alpha \sigma } \right)} \right]$ at different strain rates and temperatures. These results indicate that the hyperbolic sine function about Z parameters can be used to describe flow stress behavior of Incoloy028 alloy during hot compression deformation.
Diagram of  $\ln\, Z - \ln \left[ {\sinh \left( {\alpha \sigma } \right)} \right]$ at different strain rates.
When  ${{\dot \varepsilon }}$ is 0.1 s−1,
 $\ln\, Z = 8.200\ln \left[ {\sinh \left( {0.00519\sigma } \right)} \right] + 58.225,\;r = 0.9985\quad .$
When  ${{\dot \varepsilon }}$ is 1 s−1,
 $\ln\, Z = 6.254\ln \left[ {\sinh \left( {0.00519\sigma } \right)} \right] + 50.625,\;r = 0.9926\quad .$
When  ${{\dot \varepsilon }}$ is 10 s−1,
 $\ln\, Z = 7.534\ln \left[ {\sinh \left( {0.00519\sigma } \right)} \right] + 57.594,\;r = 0.9908\quad .$
When  ${{\dot \varepsilon }}$ is 50 s−1,
 $\ln\, Z = 20.532\ln \left[ {\sinh \left( {0.00519\sigma } \right)} \right] + 67.584,\;r = 0.9764\quad .$
Take α, Q, A and n into Eq. (4),the constitutive equations of Incoloy028 alloy at high temperature and different strain rates can be gotten, as follows:
When  ${{\dot \varepsilon }}$ is 0.1 s−1, the constitutive equation is.
 $\dot \varepsilon = {\left[ {\sinh \left( {0.00519\sigma } \right)} \right]^{8.200}}\,\exp \left( {58.225 - {{679.21} \mathord{\left/ {\vphantom {{679.21} {RT}}} \right. \kern-\nulldelimiterspace} {RT}}} \right)\quad .$
When  ${{\dot \varepsilon }}$ is 1 s−1, the constitutive equation is.
 $\dot \varepsilon = {\left[ {\sinh \left( {0.00519\sigma } \right)} \right]^{6.254}}\,\exp \left( {50.625 - {{596.11} \mathord{\left/ {\vphantom {{596.11} {RT}}} \right. \kern-\nulldelimiterspace} {RT}}} \right)\quad .$
When  ${{\dot \varepsilon }}$ is 10 s−1, the constitutive equation is.
 $\dot \varepsilon = {\left[ {\sinh (0.00519\sigma )} \right]^{7.534}}\,\exp (57.594 - {{674.01} \mathord{\left/ {\vphantom {{674.01} {RT}}} \right. \kern-\nulldelimiterspace} {RT}})\quad .$
When  ${{\dot \varepsilon }}$ is50 s−1, the constitutive equation is
 $\dot \varepsilon = {\left[ {\sinh \left( {0.00519\sigma } \right)} \right]^{20.532}}\,\exp (67.5844 - {{784.36} \mathord{\left/ {\vphantom {{784.36} {RT}}} \right. \kern-\nulldelimiterspace} {RT}})\quad .$
Through the constitutive equations at different high temperatures, we can find out that flow stress increases with the rise of strain rate when the deformation temperature remains constant, which decreases with the rise of temperature when strain rate keeps constant. The deformation constitutive equations at high temperature reflect the change rule between the parameters in process of compression deformation, which provides theory basis effectively for controlling the organization and making deformation process for Incoloy028 alloy.
C. Hot working maps
The constitutive behaviors of materials are usually studied through the investigation of hot working maps based on dynamic materials model, which have been described in detail by Prasad.Reference Prasad and Sasidhara13 Energy dissipation during hot deformation consists of two portions: one is used for plastic deformation, and the other is consumed by structural changes. The ratio η of the energy dissipation that is consumed by structural changes to the total is plotted with a contour line as a function of strain rate and temperature. Thus, an energy dissipation map can be developed.
The efficient energy dissipation ratio ηReference Srinivasan, Prasad and Rama14 during hot working is:
 $$\eta = {{2m} \mathord{\left/ {\vphantom {{2m} {\left( {m + 1} \right)}}} \right. \kern-\nulldelimiterspace} {\left( {m + 1} \right)}}\quad .$$
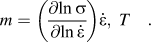
In Eq. (12), m is the strain rate sensitivity,Reference Prasad and Seshacharyulu15 which can be denoted as:
 $$m = \left( {{{\partial \ln\, \sigma } \over {\partial \ln\, \dot \varepsilon }}} \right)\dot \varepsilon ,\;T\quad .$$
At a certain temperature, m is a function about the stress and strain rates. Prasad and SeshacharyuluReference Prasad and Seshacharyulu16 have validated that flow instability may occur during hot working when the following is satisfied:
 $$\xi (\dot \varepsilon ) = {{\partial \ln \left( {{m \mathord{\left/ {\vphantom {m {(m + 1)}}} \right. \kern-\nulldelimiterspace} {(m + 1)}}} \right)} \over {\partial \ln\, \dot \varepsilon }} + m \lt 0\quad .$$
If ξ is negative, flow instability will occur. The instability parameter varies with temperature and strain rate. Energy dissipation ratio η satisfied Eq. (14), temperature, and strain rate in the contour map constitutes an instability map. A processing map will be obtained by superimposing the instability map on the energy dissipation map. In short, the hot working maps consist of safe domains and unsafe domains, which present respective microstructure mechanisms.
Based on the stress–strain curves and the methods described above, six hot working maps in the temperature range 1223–1473 K and strain rate range 0.1–50 s−1 for the Incoloy028 alloy were obtained by Mat-lab and Origin software. The results are shown in Fig. 7. The numbers in the contour lines represent energy dissipation percentage at the respective deformation conditions. The hot working maps at various strains exhibit similar broad features, but they are different in details; the gray regions denote rheological instability domains.
Hot working maps of the Incoloy028 alloy in the true strain range of (a–f) 10–60%.
The hot working map can be divided into, “A”, “B”, “C”, and “D”, four regions. The gray regions “A” and “B” denote instability domains, power dissipation factor decreases with the increase of strain rate, the hot workability of material becomes bad, in addition, when strain increases from 20% to 60%, instability domains “A” and “C” shrink to the left direction with the rise of strain.
Domain “B” is a small hot working region, the processing temperature range is from 1223 K to 1423 K in this region, the strain rate range is from 0.6 s−1 to 1 s−1. The allowable range of strain rate widens gradually with the increase of temperature. The right half of the region “B” magnifies gradually when strain increases from 20% to 60%.
Domain “D” is a large hot working region, the hot workability is good in the temperature range of 1423–1473 K and strain rate range of 0.1–50 s−1. When strain changes from 20% to 60%, the domain “D” expands to the left direction with the rise of strain. The essential temperature decreases with the rise of strain rate. When strain increases from 20% to 60%, the essential temperature decreases from 1453 K to 1438 K at 0.1 s−1, the critical temperature decreases from 1443 K to 1223 K at 50 s−1. Because single channel compression tests were implemented, the power consumption of material caused by plastic deformation converted into viscoplastic heat mostly, the energy of this part offsets the energy which is necessary for microstructure transformation.
D. Corresponding microstructure evolutions
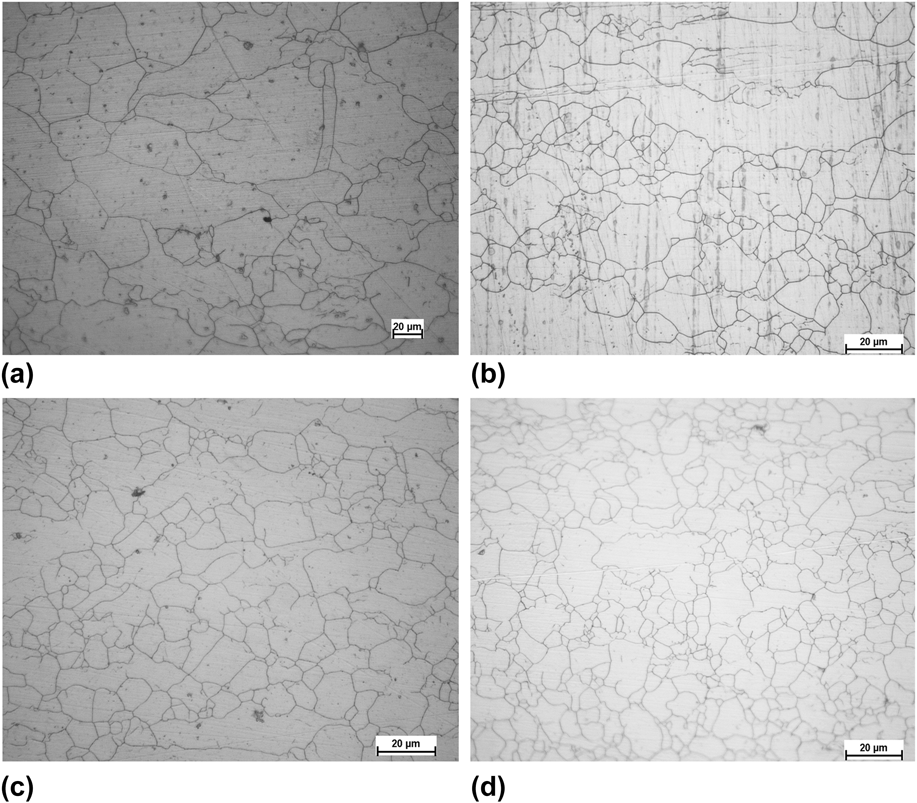
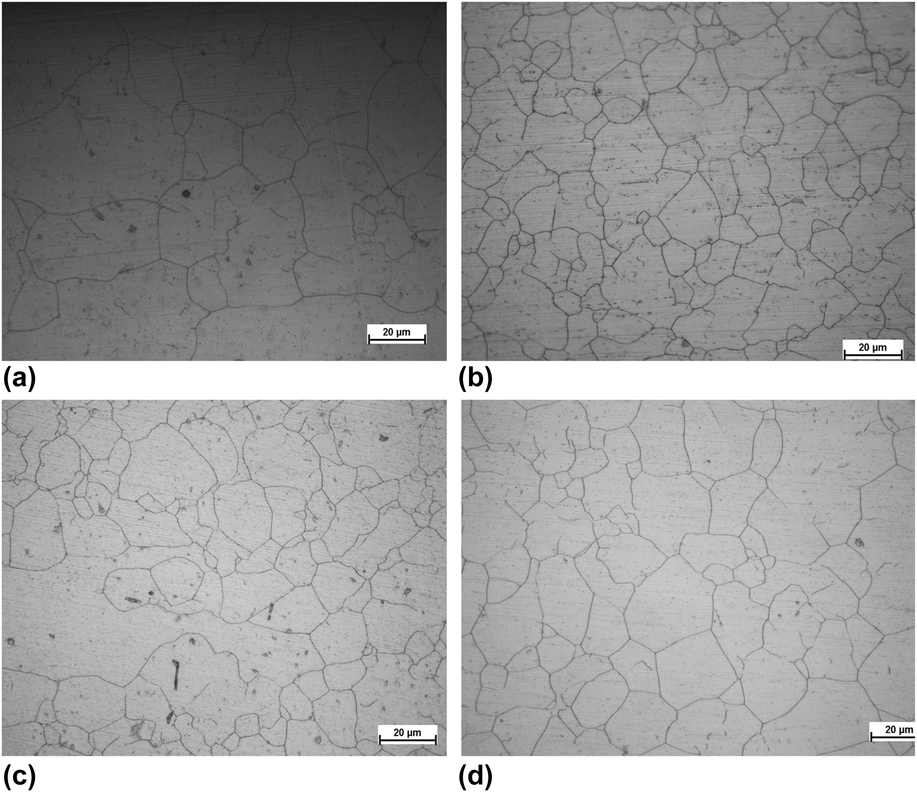
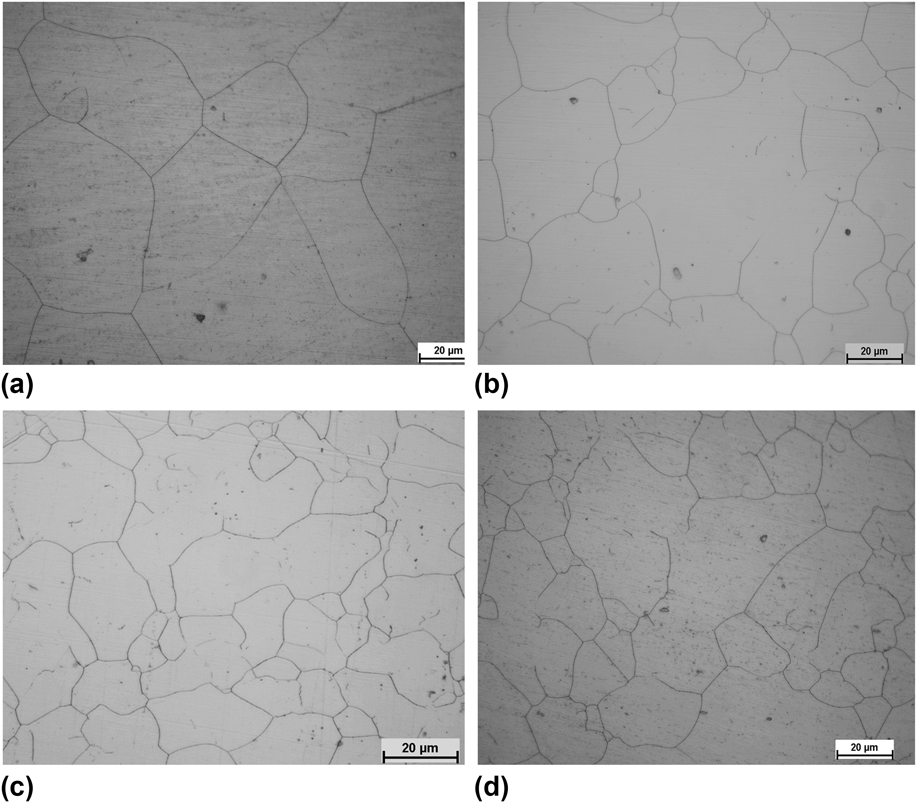
Figure 8 shows the microstructure of specimens at 1373 K and in the strain rate range of 0.1–50 s−1 after compression tests. Figure 9 shows the microstructure of specimens at 1423 K and in the strain rate range of 0.1–50 s−1 after compression tests. Figure 10 shows the microstructure of specimens at 1473 K and in the strain rate range of 0.1–50 s−1 after compression tests. At the same temperature, recrystallization grains become fine with the rise of strain rate, but become coarse with the increase of temperature. The dislocation movement velocity increases, result in the raise of recrystallization rate and degree, when the recrystallization grain achieves required conditions, the repeated recrystallization takes place, and the grain size will be smaller and smaller.
Microstructures of specimens at 1373 K and strain rate of (a) 0.1 s−1, (b) 1 s−1, (c) 10 s−1, and (d) 50 s−1.
Microstructures of specimens at 1423 K and strain rate of (a) 0.1 s−1, (b) 1 s−1, (c) 10 s−1, and (d) 50 s−1.
Microstructures of specimens at 1473 K and strain rate of (a) 0.1 s−1, (b) 1 s−1, (c) 10 s−1, and (d) 50 s−1.
IV. CONCLUSIONS
The constitutive equations of Incoloy028 alloy are established by compression tests. The hyperbolic sine function can be used to describe flow stress behavior of Incoloy028 alloy during hot compression deformation. The activation energy and constitutive equation changes obviously with the strain rate. The constitutive equations cannot be expressed by one same expression simply, which should be expressed by different mathematical formulas.
The hot working maps are developed for different strains, the hot working map is divided to “A”, “B”, “C”, and “D” four domains. Power dissipation factor decreases with the increase of strain rate in instability domains “A” and “C”. Domains “A” and “C” shrink to left direction with the rise of strain in the range of 20–60%. In the small hot working domain “B”, the reasonable hot working temperature range is 1223–1423 K, the strain rate range is limited to 0.6–1 s−1. In the large hot working domain “D”, the hot workability is reasonable in the temperature range of 1423–1473 K and strain rate range of 0.1–50 s−1. The critical temperature decreases with the rise of strain rate. In the strain range of 20–60%, the critical temperature decreases from 1453 K to 1438 K at 0.1 s−1, and decreases from 1443 K to 1423 K at 50 s−1. Recrystallization grains become fine with the rise of strain rate, but become coarse with the increase of temperature. Large strain rate and low temperature are favorable to achieve excellent mechanical performance.
ACKNOWLEDGMENTS
The authors are grateful for the financial support of Foundation of National Natural Science (51305228) and the assistance of Lian Jie in compression tests in this paper. The authors appreciate Miss. Shujuan Dong from Wuhan University of technology for her contribution to the English revision.