

Introduction
Primary care interventions for people with common mental health problems in England are primarily delivered through Improving Access to Psychological Therapies (IAPT) services. IAPT in England is a stepped care model which has three principles:
-
1. Evidence-based psychological therapies at the appropriate dose: where National Institute for Health and Care Excellence (NICE) recommended therapies are matched to the mental health problem, and the intensity and duration of delivery is designed to optimise outcomes.
-
2. Appropriately trained and supervised workforce: where high-quality care is provided by clinicians who are trained to an agreed level of competence and accredited in the specific therapies they deliver, and who receive weekly outcomes-focused supervision by senior clinical practitioners with the relevant competences who can support them to continuously improve.
-
3. Routine outcome monitoring on a session-by-session basis, so that the person having therapy and the clinician offering it have up-to-date information on the person’s progress. This helps guide the course of each person’s treatment and provides a resource for service improvement, transparency and public accountability (National Collaborating Centre for Mental Health, 2020; p. 8).
Care in IAPT is delivered by two types of psychological therapy practitioners:
-
1. Most high intensity therapists (HITs) are trained to British Association of Behavioural and Cognitive Psychotherapy (BABCP) accreditation standards in cognitive behavioural therapy (CBT) for moderate and severe depression and anxiety disorders. IAPT also includes a range of other therapies (e.g. eye movement desensitisation and reprocessing, interpersonal therapy, counselling for depression) as recommended by NICE (Clark, Reference Clark2011).
-
2. Psychological wellbeing practitioners (PWPs) are trained in CBT-based approaches for people with mild-to-moderate depression and anxiety disorders (Clark, Reference Clark2011); these approaches include guided self-help and psycho-educational groups. The training curriculum for PWPs is structured and includes specific interventions that can effectively be adapted for people with intellectual disabilities (Dagnan, Reference Dagnan and Papworth2018).
IAPT service priorities have developed over time and have included specific focus on a range of groups and presentations. Currently IAPT priorities are to ensure that 1.9 million adults access treatment each year by 2024, to ensure a focus on people with long-term conditions who are at significant risk of mental health problems associated with their physical health challenges, a continued emphasis on supporting people to find or stay in work, to reduce geographic variation in the numbers of people who recover and to reducing inequalities in access and outcomes for particular population groups (e.g. Black, Asian and minority ethnic patients; Beck et al., Reference Beck, Naz, Brooks and Jankowska2019). The IAPT Manual (National Collaborating Centre for Mental Health, 2020) discusses these issues and identifies the need to adapt processes to meet the needs of disadvantaged populations.
There is a large body of work on adapting psychological therapies for people with learning disabilities. For example, recommendations for the adaptation of therapies for people with learning disabilities are included in National Institute for Health and Care Excellence (NICE) guidance for mental health problems in people with learning disabilities (National Institute for Health and Care Excellence, 2016) and are summarised in a number of other publications (e.g. Surley and Dagnan, Reference Surley and Dagnan2019). There is also a recent large-scale trial of interventions for depression for people with learning disabilities which has presented materials and manuals for an eight-session guided self-help intervention and a 12-session behavioural activation intervention (Jahoda et al., Reference Jahoda, Hastings, Hatton, Cooper, Dagnan, Zhang and Melville2017). These intervention structures are ideally placed to be incorporated into IAPT structures.
There has been initial work to consider processes for people with learning disabilities using IAPT services. Several authors have interviewed IAPT staff about their willingness and preparedness to work with people with learning disabilities (Chinn and Abraham, Reference Chinn and Abraham2016; Shankland and Dagnan, Reference Shankland and Dagnan2015; Marwood et al., Reference Marwood, Chinn, Gannon and Scior2018). In general, these studies find that IAPT staff have positive views on the inclusion of people with learning disabilities in IAPT services but do not feel confident about working with this group. Dagnan and colleagues (Dagnan et al., Reference Dagnan, Masson, Cavagin, Thwaites and Hatton2015b; Dagnan et al., Reference Dagnan, Masson, Thwaites, James and Hatton2018) described training IAPT staff to work with people with learning disabilities and looked at outcomes of therapist confidence, based on the premise that IAPT training gives therapists skills that are applicable to people with learning disabilities but that they need to gain confidence in how to use these skills with this client group. Dagnan et al. (Reference Dagnan, Burke, Davies and Chinn2015a) present a revision of the IAPT Learning Disabilities Positive Practice Guide which describes good practice in all processes for people with learning disabilities entering, being assessed, and being treated within IAPT services.
IAPT conforms to the NHS Data Model and Dictionary standards (NHS Digital, 2021b). One of the descriptive datasets collected is the ‘disabilities code’, which includes codes for behavioural and emotional disabilities, hearing, sight, speech, gross motor difficulties, manual dexterity, disabilities in identifying danger, difficulties in personal care and continence and progressive diseases. The code for learning disabilities (code number 4) is stated as disabilities in ‘memory or ability to concentrate, learn or understand; learning disabilities’.
IAPT in England gathers session by session clinical outcome measures and other defined outcome data. Each step of the pathway through IAPT is recorded, often using bespoke IAPT data collection and management systems. The unique IAPT data outcomes are listed in the core data set definitions listed by NHS Digital (NHS Digital, Reference Digital2019b) and include data for time from referral to first appointment, those who leave the service after first appointment, those who ‘complete’ therapy, those who improve, those who show reliable change on the basis of the core measure and those who ‘recover’ according to IAPT definitions of recovery.
NHS Digital makes available national data at the level of individual services, including core data on referrals, pathways and outcomes. For some of these variables, data can be extracted for people with learning disabilities. The aim of this paper is to present analyses of these data to explore outcomes for people with learning disabilities compared with outcomes for people with other disabilities and people with no recorded disabilities.
Method
Data sources
National data for IAPT are presented as quarterly data for a subset of possible process and outcome variables and are available for years 2015–2016 to 2019–2020. Referral numbers only are available for 2012–2013 to 2014–2015. All data are available at a service provider level (144 providers in 2012–2013 increasing to 154 providers in 2019–2020) and are presented for total referrals and several sub-groups; including separately for all disabilities codes (NHS Digital, Reference Digital2021c).
Data presentation and analysis
In this paper data are presented for:
-
1. The subgroup of people in disabilities group 4 (learning disabilities);
-
2. For all other people with a disabilities code (behavioural and emotional disabilities, hearing, sight, speech, gross motor difficulties, manual dexterity, disabilities in identifying danger, difficulties in personal care and continence and progressive diseases) as a combined group; and
-
3. For all people who do not have a disabilities code.
Data are presented as a mean percentage from service level data for each group with 95% confidence intervals for each data point presented on the graphs.
Results
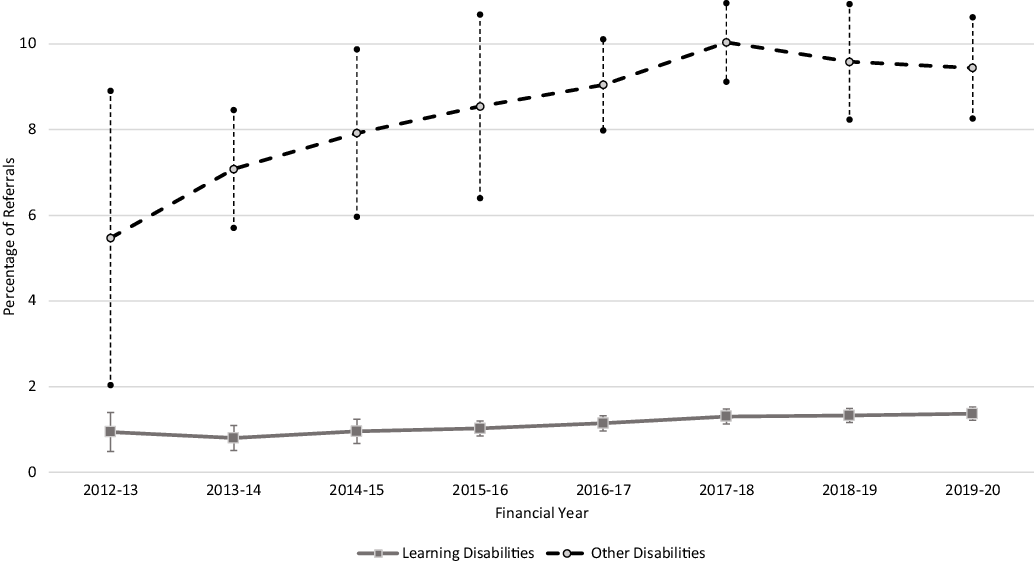
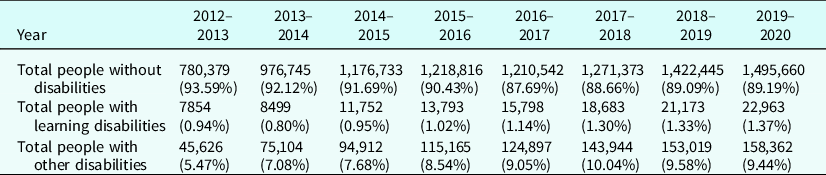
Figure 1 shows referrals that have learning disabilities and other identified disabilities as a percentage of the total annual referrals to IAPT, with 95% confidence intervals at the service level for eight years, from 2012–2013 to 2019–2020. Table 1 shows the total numbers of referrals for people with learning disabilities, people with other disabilities and people without disabilities for the same period. Table 1 and Fig. 1 show that referrals of people with learning disabilities to IAPT have increased from 0.94% of all referrals in 2012–2013 to 1.37% in 2019–2020 (a 146% increase) and the absolute numbers of referrals for people with learning disabilities have increased from 7854 to 22,963 (a 290% increase). Over the same period there was an increase of 172% in numbers of people with other identified disabilities referred to IAPT and an increase in absolute numbers of 354%.
Percentage of total referrals for people with learning disabilities and people with other recorded disabilities. Confidence intervals (95%) from service level data.

Numbers of referrals for people with learning disabilities, people with other recorded disabilities and those with no recorded disabilities

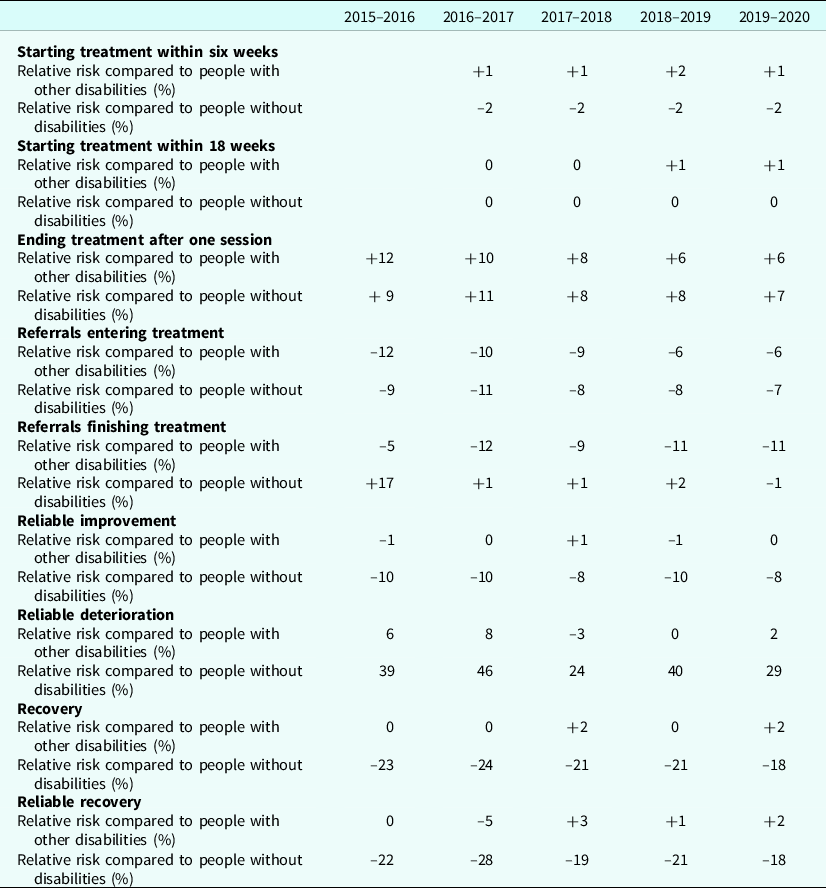
Subsequent figures (Figs 2–10) show the percentages of people with learning disabilities, those with other identified disabilities and those with no identified disabilities at all available stages through the pathway from referral; the figures are presented in conjunction with Table 2 where the degree of difference between groups is summarised as the relative risk for people with learning disabilities (calculated as mean percentage for the variable for the named group/mean percentage for the variable for people with learning disabilities). A positive score indicates a data point where the mean percentage for people with learning disabilities is higher than for the comparator group; a negative score indicates a data point where the mean percentage for people with learning disabilities is lower.
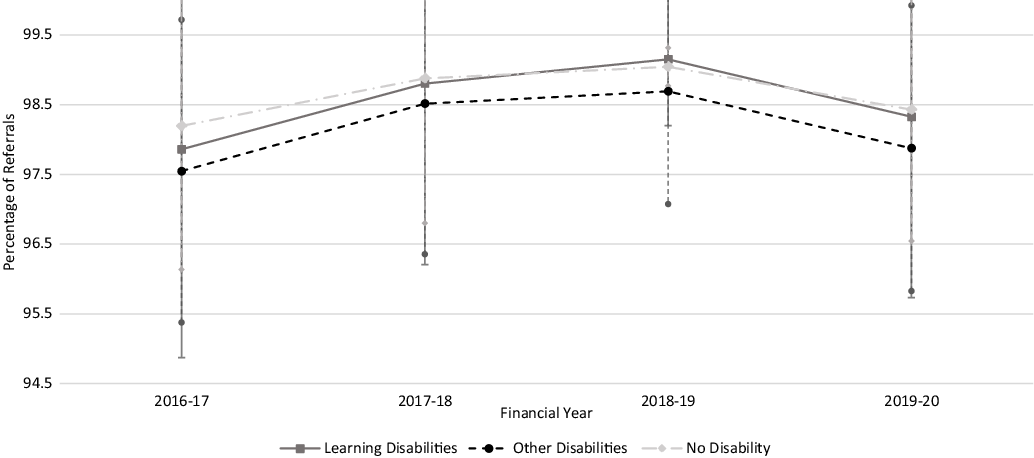
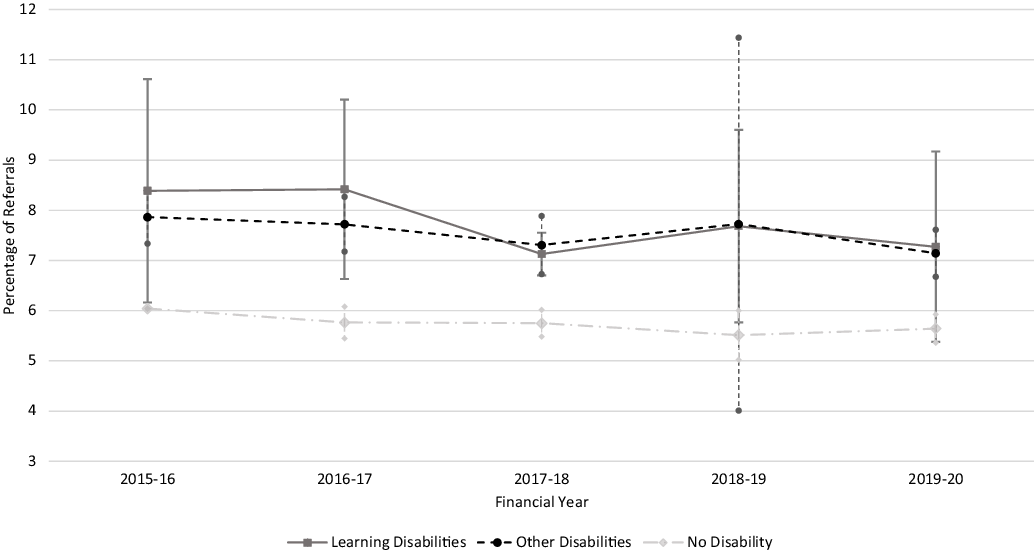
Percentage of referrals starting treatment within 6 weeks of referral, people with learning disabilities, people with other recorded disabilities and people with no recorded disabilities. Confidence interval (95%) from service level data.

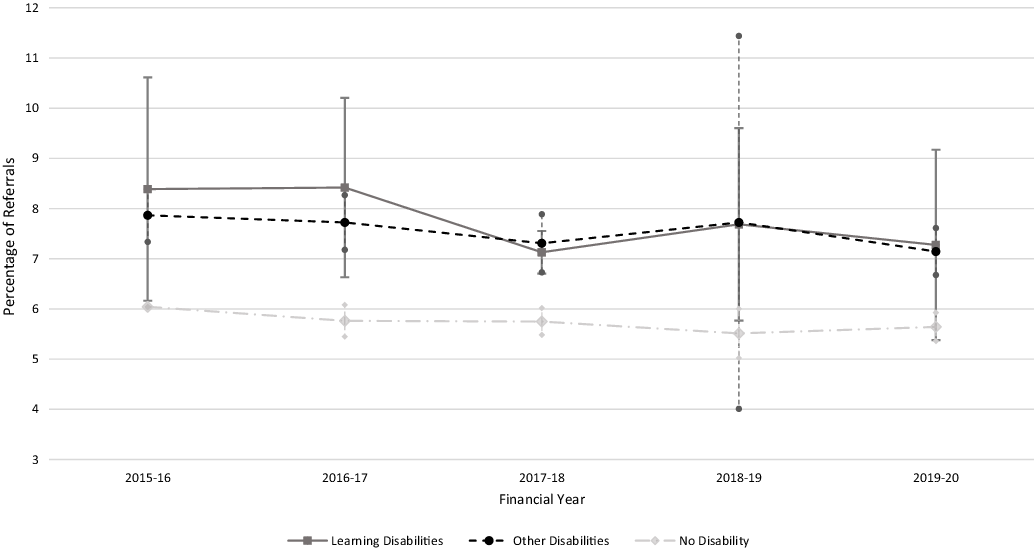
Percentage of referrals starting treatment within 18 weeks of referral, people with learning disabilities, people with other recorded disabilities and people with no recorded disabilities. Confidence interval (95%) from service level data.

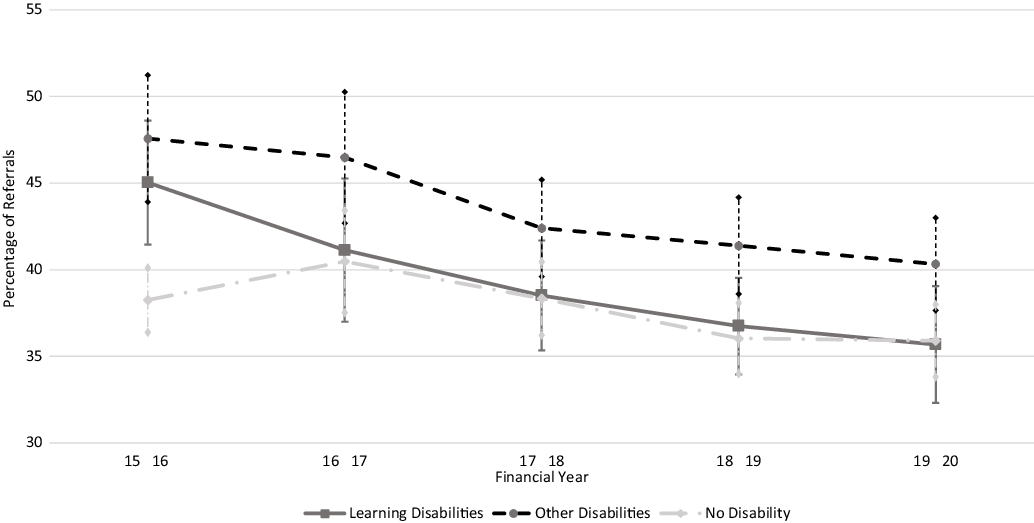
Percentage of referrals ending treatment after one session, people with learning disabilities, people with other recorded disabilities and people with no recorded disabilities. Confidence interval (95%) from service level data.

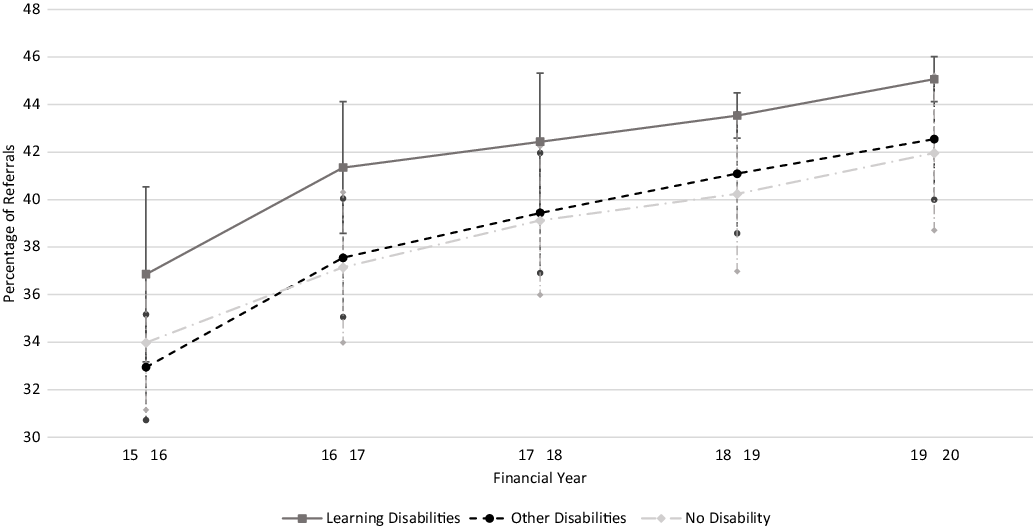
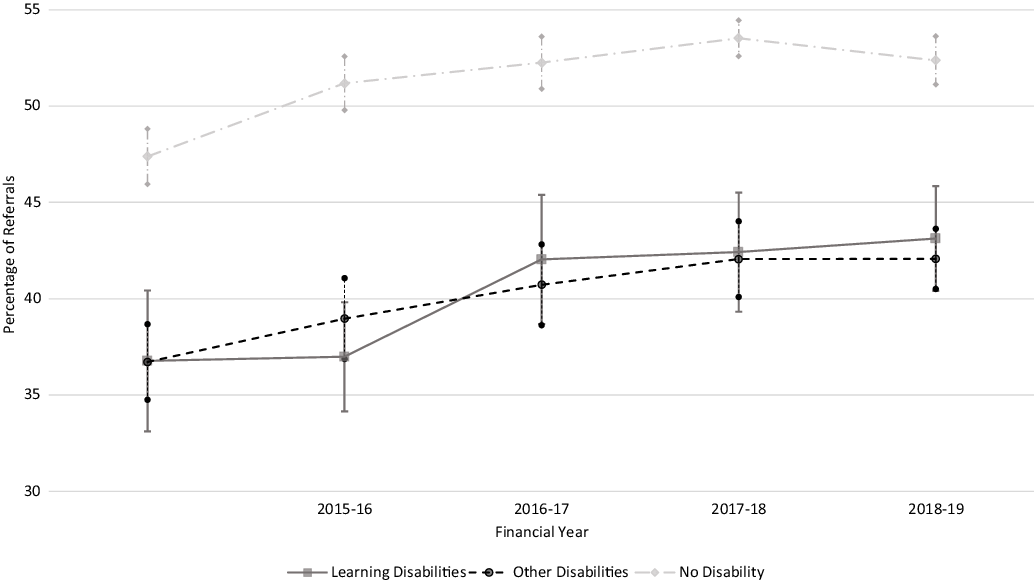
Percentage of referrals entering treatment, people with learning disabilities, people with other recorded disabilities and people with no recorded disabilities. Confidence interval (95%) from service level data.

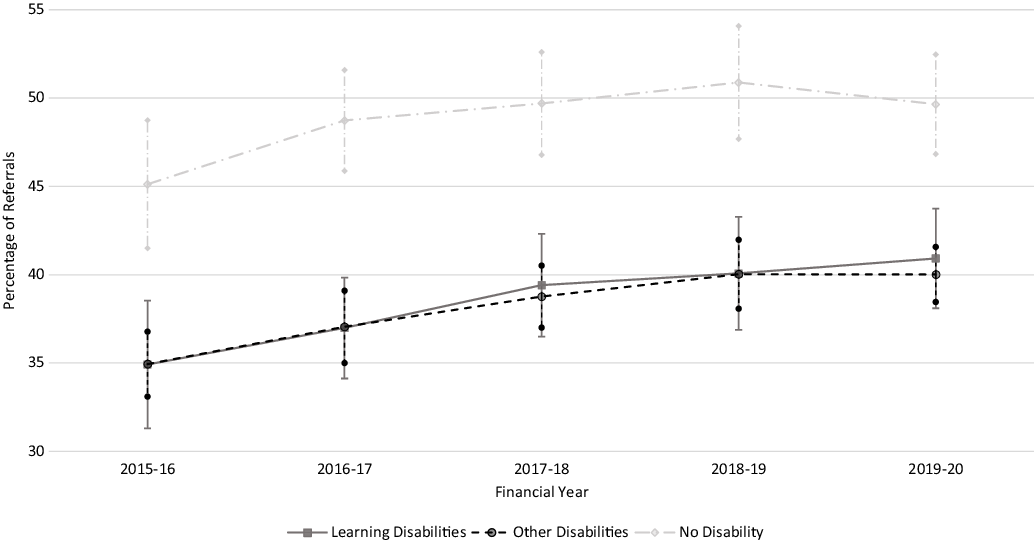
Percentage of referrals finishing treatment, people with learning disabilities, people with other recorded disabilities and people with no recorded disabilities. Confidence interval (95%) from service level data.

Percentage of referrals showing reliable improvement on leaving treatment, people with learning disabilities, people with other recorded disabilities and people with no recorded disabilities. Confidence interval (95%) from service level data.

Percentage of referrals showing reliable deterioration on leaving treatment, people with learning disabilities, people with other recorded disabilities and people with no recorded disabilities. Confidence interval (95%) from service level data.

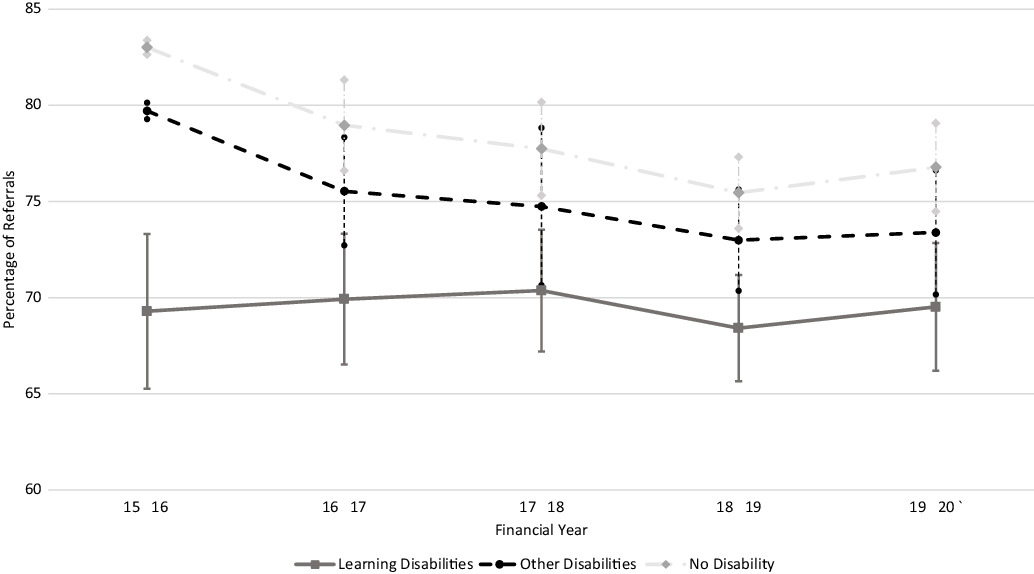
Percentage of referrals recovering on leaving treatment, people with learning disabilities, people with other recorded disabilities and people with no recorded disabilities. Confidence interval (95%) from service level data.

Percentage of referrals showing reliable recovery on leaving treatment, people with learning disabilities, people with other recorded disabilities and people with no recorded disabilities. Confidence interval (95%) from service level data.

Relative risk for key pathway details and outcomes for people with learning disabilities relative to people with other disabilities and relative to people with no recorded disabilities

All definitions for the pathway stages below are taken from the IAPT Manual (National Collaborating Centre for Mental Health, 2020), unless otherwise referenced.
Waiting times
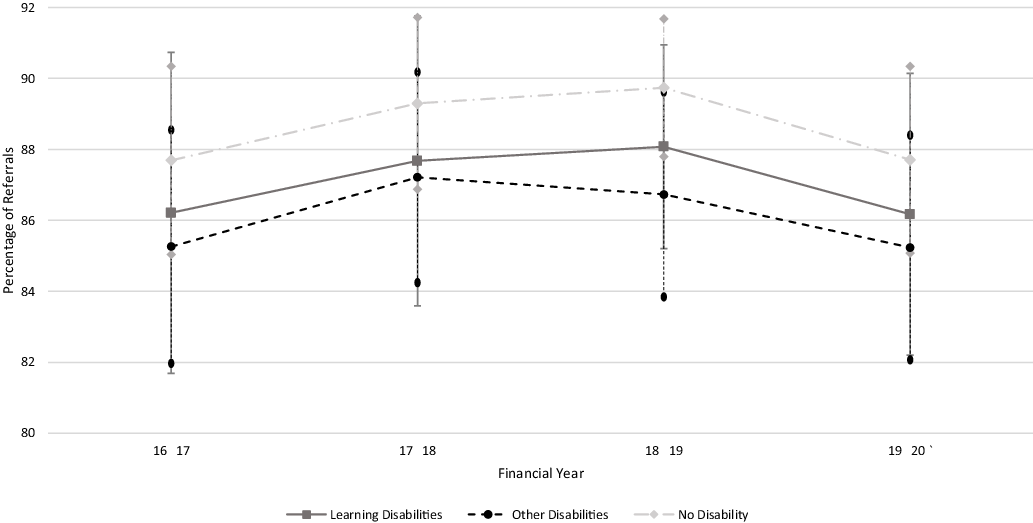
The waiting time within IAPT is counted as the time between the date of referral being received and the start of treatment or assessment. The aim is that 75% of people who attend treatment do so within 6 weeks and 95% within 18 weeks (NHS Digital, Reference Digital2021a). The percentages of people seen within 6 weeks (Fig. 2) and within 18 weeks (Fig. 3) are presented (2016–2017 to 2019–2020).
Figures 2 and 3 show that the percentage of people with learning disabilities who start treatment or assessment within 6 weeks and 18 weeks of referral is broadly the same as the percentage for people without learning disabilities; with small differences in relative risk of 1–2% compared with people with other disabilities and 2% compared with people with no disabilities. At 18 weeks the relative risk to two decimal places suggests no difference in outcome risk. All groups show a generally positive trend from 2016–2017 to 2019–2020 with a slight drop in 2020–2021.
Percentage of referred people entering treatment
This is defined as people who were seen at least once (those who were assessed and were given advice and were either signposted on or offered treatment) and is presented in Fig. 4 (2015–2016 to 2019–2020). To be recorded as entering treatment requires that the attended session has time devoted to delivering a NICE-supported intervention (which may include advice and/or signposting).
Percentage of people leaving treatment after only one session
This is presented in Fig. 5 (2015–2016 to 2019–2020).
Percentage of people finishing treatment
This is defined as people who had two treatment sessions within IAPT (including initial assessment and advice) before being discharged, and is presented in Fig. 6 (2015–2016 to 2019–2020).
The definitions of entering and finishing treatments are very specific for IAPT services and Figs 4–6 show a complex picture for these indicators. A higher proportion of people with a learning disability leave treatment after one session and a smaller proportion enter treatment compared with both people with other disabilities and people without recorded disabilities with a relative disadvantage for people with learning disabilities of 7–10%. However, the proportion of people with learning disabilities who finish treatment is the same as for people with no recorded disabilities, although somewhat less than people with other disabilities who have an advantage over both other groups.
Percentage of people reliably improving
Reliable improvement occurs when a person’s scores on the depression and/or the anxiety measure have reduced by an amount greater than ‘the measurement error of the scale’ and neither measure has shown an increase greater than ‘the measurement error of the scale’ (this percentage includes everyone who has completed treatment regardless of their initial caseness) and is shown in Fig. 7 (2015–2016 to 2019–2020). In IAPT ‘the measurement error of the scale’ is the reliable change index (Jacobson and Truax, Reference Jacobson, Truax and Kazdin1991).
Percentage of people reliably deteriorating
Reliable deterioration occurs when scores on the depression and/or the anxiety measure having increased by a reliable amount and is shown in Fig. 8 (2015–2016 to 2019–2020).
Percentage of people recovering
Recovery is a central outcome measure for IAPT services and a person is counted ‘recovered’ when initial scores on depression and/or relevant specific anxiety disorder measure are above the clinical cut-off at start of treatment and both are below the clinical cut-off at the end of treatment, and is shown in Fig. 9 (2015–2016 to 2019–2020).
Percentage of people showing reliable recovery
This is defined as people who recover where the change to recovery is a reliable amount for the measure and is shown in Fig. 10 (2015–2016 to 2019–2020).
Figures 7–10 show that people with learning disabilities and people with other recorded disabilities have poorer recovery and poorer reliable recovery scores than people with no recorded disabilities. For both the core recovery and reliable recovery variables people with learning disabilities have around 20% relative disadvantage compared with people with no recorded disabilities. However, for reliable change there is around a 10% relative disadvantage for people with learning disabilities compared with those with no recorded disability. Finally, there is between a 24 and 46% greater likelihood for people with learning disability to show reliable deterioration compared with those who have no recorded disability.
Discussion
The data reported here show that 22,936 people with learning disabilities were referred to IAPT services in 2019–2020, representing 1.37% of all referrals. This represents a 146% increase in the proportion of people with learning disabilities within the total referral numbers and a 290% increase in the total number of people with learning disabilities referred from 2012–2013 to 2019–2020. Over the same period there was an increase of 172% in people with other identified disabilities referred to IAPT and an increase in absolute numbers of 354%. The smaller proportional increase for people with learning disabilities might reflect a ceiling effect for the proportion of the population with learning disabilities than can benefit from IAPT as currently structured. It is also possible that the presence of other disabilities in the general population is increasing (Department of Work and Pensions, 2021).
Data for people with learning disabilities in England suggest that, in 2019–2020, 5.1 out of every 1000 people on GP practice lists were recorded as having learning disabilities (NHS Digital, Reference Digital2020). Based on this figure the percentage of people referred to IAPT who are recorded as having a learning disability exceeds the proportion of the general population who are recorded as having a learning disability in primary care. However, the category of learning disability in the IAPT data set is self-identified and Public Health England (2016) identifies that the number of people with learning disabilities in England could be four times the number identified in GP registers. Whilst people with learning disabilities have slightly higher levels of anxiety disorder and similar levels of depression than people without learning disabilities (Cooper et al., Reference Cooper, Smiley, Morrison, Williamson and Allan2007), not all people with learning disabilities will be able to use the talking therapies present in IAPT services and as such the proportions for people with learning disability identified in IAPT services in 2020–2021 is positive, if not entirely representative.
In general, initial process outcomes, for people with learning disabilities in IAPT are broadly the same as those for people without learning disabilities. In particular, we have noted a small relative risk of 1–2% for not meeting the 6-week waiting target relative to people with other disabilities and 2% compared with people with no recorded disabilities. At 18 weeks the relative risks are so small that a relative risk to two decimal places suggests no difference in outcome. All groups show a generally positive trend from 2016–2017 to 2019–2020 and all groups, in all years meet the target set for waiting times (NHS Digital, Reference Digital2021c).
IAPT indicators for entering and finishing treatment are specifically defined and may be met with a relatively minimal engagement. People with learning disabilities are 7–10% more likely to leave treatment after one session and less likely to enter treatment relative to both people with other disabilities and people without recorded disabilities. However, the proportion of people with learning disabilities who finish treatment is the same as for people without learning disabilities. The higher proportion of people with learning disabilities leaving IAPT after one session may include some people who are being appropriately signposted elsewhere within learning disability, mental health or local authority systems. However, these outcomes are also likely to be associated with therapy processes, for example leaving therapy after only one session may be a failure of therapy engagement associated with core processes and communication. In particular the sessional use of clinical assessments may present challenges for many people with learning disabilities, and it is of particular note that the psychometric properties of scales used in IAPT are very well understood for populations of people without learning disabilities (e.g. Boothroyd et al., Reference Boothroyd, Dagnan and Muncer2018) but have not yet been reported for people with learning disabilities. Some services have described approaches that reduce assessment demand, but which are not IAPT compatible and would not be reported in national data (e.g. Salmon et al., Reference Salmon, Gibson, Nagel, Roscoe, Vidalaki and Ubhi2013). However, the Learning Disabilities Positive Practice Guide (Dagnan et al., Reference Dagnan, Burke, Davies and Chinn2015a) describes a number of possible adaptations to IAPT processes and assessments that may make it easier for people with learning disabilities to negotiate these aspects within IAPT services. This difficulty in initial engagement may also be a factor in the under-representation of people with learning disabilities in total referrals to IAPT services. Many people with learning disabilities live in environments where the presence of depression or anxiety may not be recognised (e.g. Chinn and Abraham, Reference Chinn and Abraham2016). The decision-making process that identifies IAPT as an appropriate service, the process of being referred (which includes self-referral; NHS Digital, Reference Digital2019a), arranging the appointment, and taking up the offer of the appointment also requires literacy and organisational skills that may result in people with learning disabilities presenting less to primary care and being less likely to take up offered appointments (Dagnan, Reference Dagnan and Papworth2018).
Both people with learning disabilities and people with other recorded disabilities have generally poorer recovery scores relative to people with no recorded disabilities. However, the outcome data shows that, in 2020–2021 for example, 41% of people with learning disabilities who entered IAPT at caseness for both depression and anxiety and who had at least one treatment session moved to recovery. This supports the view that IAPT staff have the core skills to be able to work with this group and that increasing confidence in working with people with learning disabilities is an important outcome for therapists in IAPT services (Dagnan et al., Reference Dagnan, Masson, Thwaites, James and Hatton2018). However, the proportion of people with learning disabilities who improve or recover is lower than those without learning disabilities. This suggests that therapists can further adapt their approaches for people with learning disabilities. For example, Dagnan et al. (Reference Dagnan, Burke, Davies and Chinn2015a) present an update of the Positive Practice Guide for People with Learning Disabilities which gives an overview of ways in which assessment and intervention can be adapted to meet the needs of people with learning disabilities within IAPT services. In addition, structured and manualised interventions that are suitable for adoption in IAPT services have been developed and shown to be effective in definitive trials (e.g. Jahoda et al., Reference Jahoda, Hastings, Hatton, Cooper, Dagnan, Zhang and Melville2017).
These analyses suggest several further areas of research. There are reports of innovative adaptation and training approaches to support IAPT services in working with people with learning disability (e.g. Dodd et al., Reference Dodd, Burke, Gibson, Hines, Howarth, Jennison, Mackintosh, Radcliffe, Vieira and Unsworth2017) and some services are more often in the top 30 services for recovery rates for people with learning disabilities. For example, in the data for the five years 2015–2020, four services are in the top 30 for recovery rates for people with learning disabilities in four of the five years. It would be useful to examine the processes and approaches offered within these services to determine if there are generalisable lessons. Additionally, it may be possible to support processes and therapy interventions for some services and, as part of the evaluation, to use nationally reported data to determine the effects of these interventions whilst using national data from other similar services (in terms of size and geographic and demographic context) as a ‘control’. It is also important to describe how specialist learning disability services interact with IAPT services and whether variation in specialist service provision affects referral rates and outcomes in IAPT. Finally, the data reported here do not include months that are affected by COVID-19 social distancing, lockdowns, or higher rates of infection. It will be possible to present a more detailed analysis of the months preceding the lockdown and social distancing periods associated with COVID-19 and the year 2020–2021. This will help us understand whether the challenges of delivering IAPT in a social distanced environment has differentially affected people with learning disabilities.
A key challenge in interpretation of these data is that the primary indicator of people with learning disabilities in IAPT services is part of a national dataset but has not been validated (NHS Digital, 2021b). The disabilities question is typically asked at initial contact and the question is structured to be asked in the form, ‘Do you consider you have a disability?’, and if the client states they do they are then asked to consider which of the possible disabilities in the IAPT list they consider they have. Thus, the structure of the question is complex and may result in both false positive and false negative identification, i.e. there may be people included in the ‘learning disability’ code who do not meet clinical criteria for learning disability diagnosis and there may be people who do or would meet the criteria who are not included in the code. There are a variety of ways this may happen, for example, the question may be subject to social desirability effects, and people with learning disabilities may be reluctant to state they have a disability as they may think this will exclude them from services. It is also possible that people with other reasons for their difficulties in ‘memory or ability to concentrate, learn or understand’ are included in the code. We know little about how the code is used nationally and whether there is variation in its application between services. However, this item is intended to identify people with learning disabilities and is the variable used in national data reporting to describe processes and outcomes for people with learning disabilities and so we would argue it is legitimate to present analyses in this paper based on this code. We would strongly suggest that further work is needed to validate the learning disability question and understand how it is used in IAPT services. If the use of the question is better understood it may be possible to work with IAPT services to standardise the use of the question. If this was applied in a standardised way, then the data available from all services and at a national level would be even more powerful in monitoring the outcomes for people with learning disabilities in IAPT.
Key practice points
-
(1) IAPT national data reports outcomes for people with learning disabilities.
-
(2) People with learning disabilities are more likely to leave treatment after one session and less likely to enter treatment compared with people without recorded disabilities. However, the proportion of people with learning disabilities who finish treatment is the same as for people with no recorded disability. People with learning disabilities are less likely to recover than people with no recorded disabilities.
-
(3) IAPT services can be adapted to make them more accessible to people with learning disabilities.
Acknowledgements
None.
Financial support
No financial support was received for this paper.
Conflicts of interest
R.T. declares that he is the Editor-in-Chief of the Cognitive Behaviour Therapist, and confirms that he had no role in the peer review or editorial decision processes for this manuscript, which were conducted by other members of the journal’s Editorial Board.
Ethics statements
The analyses described here use publicly available data, and no ethical review was required. The authors have abided by the Ethical Principles of Psychologists and Code of Conduct as set out by the BABCP and BPS.
Data availability statement
Data availability is not applicable to this article as no new data were created or analysed in this study.
Author contributions
Dave Dagnan: Conceptualization (equal), Data curation (lead), Formal analysis (lead), Investigation-(lead), Methodology (equal), Writing – original draft (equal), Writing – review & editing (equal); Caroline Rodhouse: Data curation (supporting), Formal analysis (supporting), Writing – original draft (equal); Richard Thwaites: Conceptualization (equal), Formal analysis (supporting), Writing – original draft (supporting), Writing – review & editing (supporting); Chris Hatton: Conceptualization (equal), Formal analysis (equal), Methodology (equal), Writing – original draft (equal), Writing – review & editing (equal).



Comments
No Comments have been published for this article.