Introduction
The proportion of elderly drivers has long been increasing, and will continue to grow in the oncoming decades (Eurostat, 2015). The new generation of elderly differs from previous generations. The elderly today are more likely to keep their driving licenses, possess a car and travel more kilometers than previous generations (Hjorthol et al., Reference Hjorthol, Levin and Sirén2010). Especially elderly with access to a vehicle have been found to increase their number of trips after retirement (Paez et al., Reference Paez, Scott, Potoglou, Kanaroglou and Newbold2007). Not only does driving cessation lead to increased difficulty in fulfilling everyday tasks, it also lead to a decrease in perceived autonomy and independence and increase in depressive symptoms (Musselwhite and Shergold, Reference Musselwhite and Shergold2013).
Driving a car at a higher age is not without risk; older drivers’ physical frailty puts them at higher risk of getting seriously injured or killed in traffic (Gopinath et al., Reference Gopinath2015). Furthermore, decreasing functional abilities (e.g. visual function, physical abilities, and cognitive functions) can have an effect on driving abilities and fitness to drive leading to the inability to drive. This decrease in functional abilities, determines to a large extent whether an elderly person is fit to drive (Ball et al., Reference Ball2006). Functional impairments are often caused by disease and fitness to drive studies have often focused on older drivers with diagnosed diseases, such as Alzheimer's or Parkinson's Disease (Grace et al., Reference Grace, Amick, D'abreu, Festa, Heindel and Ott2005; Carr et al., Reference Carr, Barco, Wallendorf, Snellgrove and Ott2011; Piersma et al., Reference Piersma2016).
A large group in society suffering from age-related cognitive decline, not meeting the diagnostic criteria for dementia, are those with mild cognitive impairment (MCI). MCI has been associated with intact functional abilities, although complex instrumental activities might be impaired (Petersen, Reference Petersen2004). Only recently, research has given attention to driving ability assessments in this group and included MCI patients in their research design. Using on-road assessments, Wadley found MCI patients to perform “less optimal” than control patients (Wadley et al., Reference Wadley2009). Similarly, Pavlou concludes that MCI patients differ from healthy controls in their driving performance profile, but to a lesser extent than patients with Alzheimer's or Parkinson's disease (Pavlou et al., Reference Pavlou, Beratis, Papadimitriou, Antoniou, Yannis and Papageorgiou2016). Using a driving simulator, Devlin et al. (Reference Devlin, Mcgillivray, Charlton, Lowndes and Etienne2012) found evidence for decreased performance in negotiating intersections in MCI patients compared to healthy elderly, but did not extend their research to other aspects of driving behavior. Another driving simulator study by Fritelli and colleagues, compared patients with MCI to healthy controls and patients with mild Alzheimer's disease. MCI patients only differed from healthy controls on time-to-collision, but not on other measures, such as reaction times. The Alzheimer's disease group differed significantly from both healthy controls and MCI patients on various other driving measures (Frittelli et al., Reference Frittelli2009).
The earlier-mentioned studies confirm the rationale that age-related cognitive decline that does not yet meet the criteria for dementia can be viewed as a gliding scale. The statement of diagnosis is not necessarily the point when a person is unfit to drive or when driving abilities start to diminish (Bennett et al., Reference Bennett, Chekaluk and Batchelor2016). Studies on driver fitness among drivers with MCI or (very) mild dementia report wide ranges of fail rates during on-road tests of between 18% and 70% (Martin et al., Reference Martin, Marottoli and O'neill2013).
Subjective cognitive impairment (SCI) has been argued to be a preceding cognitive stage to MCI or dementia. Studies found people experiencing SCI have a higher risk than healthy non-complaining older adults to progress into MCI or dementia (Reisberg and Gauthier, Reference Reisberg and Gauthier2008; Reisberg et al., Reference Reisberg, Shulman, Torossian, Leng and Zhu2010). Furthermore, studies concerning elderly with SCI showed lower performance on a global measure of cognition, such as the Mini-Mental State Examination (Folstein et al., Reference Folstein, Folstein and Mchugh1975; Clarnette et al., Reference Clarnette, Almeida, Forstl, Paton and Martins2001). Although activities of daily life are considered intact in SCI, driving a car is a very-complex instrumental activity of daily life. We therefore argue that some older drivers presenting with SCI might be experiencing impact on their driving performance. No previous studies have focused on this group of drivers that is in need of objective screenings of their fitness to drive.
The current study focuses on a group of active elderly drivers with SCI or suspected of diminished driver fitness. In line with the Belgian legislation, patients first turn to their general practitioner for advice regarding fitness to drive. Previous studies have reported how medical doctors lack guidelines for assessing fitness to drive in an office setting (Spannhorst et al., Reference Spannhorst, Toepper, Schulz, Wenzel, Driessen and Kreisel2016). Although some off-road assessment, such as DriveAble (Dobbs, Reference Dobbs1997) or Drive Safe & Drive Aware (Kay et al., Reference Kay, Bundy and Clemson2009), have proven good sensitivity and specificity, these screening procedures are less suitable for general practitioners, because of required training and time needed to administer these screenings. Furthermore, these instruments are not based on already well-known and often used clinical tests, troubling their integration in general practitioners’ visits.
The goal of the present study therefore is to identify functional ability tests (i.e. physical, visual, and cognitive tests) that can give a first indication of a person's fitness to drive. As previous studies indicated that it is unlikely that a single functional ability test is able to predict on-road fitness to drive (Bowers et al., Reference Bowers2013), we aim to develop a clinically useful battery of tests that is easy to administer within a doctor's office, within a reasonable timeframe. We do not expect perfect prediction in elderly drivers presenting with SCI, but aim for a test battery with acceptable sensitivity and specificity as this can already reduce the need for large percentages of them to be evaluated by a stressful on-road test. Given the expected rise in elderly in society, reducing the need for expensive on-road evaluations can provide a considerable saving on elderly driver evaluation for society. We expect, in line with Bowers, that further evaluation is still needed for those drivers that are not clearly classified as fit to drive or not from a clinical test battery (Bowers et al., Reference Bowers2013).
The second goal of our study is to investigate the added value of a short driving simulator test in the prediction of fitness to drive. If a driving simulator assessment improves the sensitivity and specificity of the predictive model, the need for on-road evaluations might be reduced further. Although previous studies have investigated driving behavior of a cognitively impaired population by making use of a driving simulator, they have not focused on assessing fitness to drive in this population (Frittelli et al., Reference Frittelli2009; Devlin et al., Reference Devlin, Mcgillivray, Charlton, Lowndes and Etienne2012). Only recently, studies from the Netherlands, have sought to use driving simulation as a tool in investigating fitness to drive in patients with Alzheimer's disease (Piersma et al., Reference Piersma2016) or MCI (Fuermaier et al., Reference Fuermaier2016). Both studies used only a limited set of performance parameters from the driving simulator assessment, such as driven speed, lateral position on the road and number of collisions. To maximize the usability of the driving simulator assessment, anticipating on possible training options for the future, we include a broader range of performance measures from simulated driving. Lastly, we test both the predictive ability of a driving simulator assessment based on structured observation, as well as on objective parameters collected directly from the simulation.
Methods
Participants
Recruitment of older drivers occurred through the geriatrics day hospital of the Jessa Hospital (Belgium), as well as through information sessions at local elderly organizations by means of information brochures. In all brochures and information material it was specified that either elderly drivers with cognitive complaints and\or older drivers suspected of diminished driving abilities by a caregiver were sought and that participation in the study had no consequences for the possession of their driving license. Participants were included if they were over the age of 70 years, active drivers at the moment of participation, and either presented with cognitive complaints and\or were suspected of cognitive decline by an (in)formal caregiver. No participants received treatment for cognitive impairments at the time of study. Conditions leading to legal unfitness to drive (e.g. history of stroke in the last six months) according to the Belgian Royal Decree concerning the driving license were exclusion criteria. One hundred thirty-six elderly drivers (102 male) agreed to participate in the study and gave written informed consent.
Procedure
All participants were seen three times over the course of the study. On the first day of participation, participants underwent evaluation of their visual, physical, and cognitive abilities at the Jessa Hospital. On their second appointment participants completed a driving simulator test with a trained researcher of the Transportation Research Institute. During their last appointment participants completed an on-road driving assessment similar to the Belgian fitness to drive evaluation procedure. All three study visits are described in more detail later. This study protocol was approved by the ethical review committees of Hasselt University and the Jessa Hospital.
Day 1: Functional ability tests
All participants visited the local hospital for extensive functional evaluation (i.e. visual, motor, and cognitive abilities). Examinations were carried out by a geriatrician, an occupational therapist, and a neuropsychologist. Tests were selected based on their previously established relationship with fitness to drive. We chose to include well-known tests in daily geriatric medical practice and mainly included paper-and-pencil tests in our screening procedure, to guarantee maximum usability in clinical practice. A short description of each test and its relation to driving performance is provided hereafter.
Visual
Visual acuity – Snellen Chart: The Snellen chart is used to assess visual acuity. The chart consists of 12 lines of letters that have to be read from 6 m distance. Possible scores range from 0 to 1.2. A score of 0.5 is the minimal requirement for fitness to drive according to Belgian legislation.
Contrast sensitivity – Pelli Robson: Contrast sensitivity was measured using the Pelli–Robson chart (Pelli and Robson, Reference Pelli and Robson1988). The test is taken with both eyes open from a distance of 1 m. Scores range from 0 to 2.25. Contrast sensitivity has been found to be of importance for driving skills in elderly drivers (Wood, Reference Wood2002).
Physical
Timed get-up-and-go: The timed get up and go test addresses functional mobility and gait (Podsiadlo and Richardson, Reference Podsiadlo and Richardson1991). The participant is asked to get up from a chair, walk for 3 m, return, and sit down again. The time to completion is recorded as the outcome measure. Impaired performance has been found to be predictive of lane deviations in drivers with Alzheimer's disease (Dawson et al., Reference Dawson, Anderson, Uc, Dastrup and Rizzo2009).
Functional reach test: The functional reach test is a test of physical balance (Duncan et al., Reference Duncan, Weiner, Chandler and Studenski1990), and was found to be a predictor of safety errors in elderly drivers with Alzheimer's dementia (Dawson et al., Reference Dawson, Anderson, Uc, Dastrup and Rizzo2009). The participant stands up straight with one arm extended forward and is then asked to reach forward as far as possible. Difference between arm length and maximal forward reach is recorded.
Cognitive
Mini-Mental State Examination: The MMSE is a brief, widely used, screening test for global cognitive functioning (Folstein et al., Reference Folstein, Folstein and Mchugh1975). Lower scores reflect impaired cognitive performance (range 0–30). Although the predictive value of the MMSE in assessing fitness to drive is still debated, the test is used very often in clinical practice and was therefore included in our battery (Spannhorst et al., Reference Spannhorst, Toepper, Schulz, Wenzel, Driessen and Kreisel2016).
Clock Drawing test: The Clock Drawing test is a very short screening test for the detection of cognitive impairments. Scores were based on the ability of a person to draw the face of a clock and place the hands on “10 past 11”. Total scores range from 0 to 7 with higher scores indicating better performance. The test has been found to be a good predictor of passing or failing a simulator-based fitness to drive examination (Freund et al., Reference Freund, Colgrove, Burke and Mcleod2005).
Amsterdamse Dementie Screening (ADS) – Eight Word subtest (Lindeboom and Jonker, Reference Lindeboom and Jonker1989): The eight-word test is an auditory verbal learning test. Eight words were presented verbally to the participant with the instruction to recall as many as possible. This procedure was repeated five times, leading to a scoring range between 0 and 40 correctly recalled words with higher scores representing better memory performance. After a 15-minute interval the participant was asked to recall as many words as possible. Subsequently, the examiner read aloud 16 words among which the eight words of the previous test, and eight new words. The participant was asked to identify the words from the list presented before. Auditory verbal learning was previously found to play an important role in traffic sign and landmark recognition in cognitively impaired drivers (Uc et al., Reference Uc, Rizzo, Anderson, Shi and Dawson2005).
Rey complex figure test: The Rey–Osterrieth complex figure test (Rey, Reference Rey1941) involved participants to copy a complex two-dimensional figure from the example. Immediately after completing this copy trial, the example was removed, and the participant was asked to draw the figure again from memory. As a third trial, after a delay of 15 minutes, the participant was again asked to draw the figure from memory. Each trial was scored separately with a maximum score of 36 per trial. The test has been found to be predictive of driving errors in an older driver population (Dawson et al., Reference Dawson, Uc, Anderson, Johnson and Rizzo2010)
WAIS III – Digit Span: The Digit Span test was used to assess working memory capacity in adults (Wechsler, Reference Wechsler1997). Sequences of digits were read along by the experimenter and participants were asked to repeat these progressing number of digits. The test consists of two parts; one with recall in the order similar to presentation and one in reversed order. Outcome measure was maximum number of digits recalled. Working memory performance has been related to on-road driving abilities in elderly drivers (Adrian et al., Reference Adrian, Postal, Moessinger, Rascle and Charles2011).
Trail Making test: The Trail Making test part A and B are widely used in neuropsychological testing and in the field of fitness to drive. Trail A consisted of 25 numbered dots which the participant was asked to connect with a pencil in subsequent order. Trail B consisted of both numbers and letters that the participant connects alternately (1-A-2-B etc.). Time to completion was recorded. The TMT B is widely used for screening for fitness to drive after stroke (Radford and Lincoln, Reference Radford and Lincoln2004).
Useful Field of View: The Useful Field of View (UFOV (Ball and Owsley, Reference Ball and Owsley1993)) consists of three subsequently presented subtests, used to assess participants’ visual processing speed (UFOV1), divided attention (UFOV2) and selective attention skills (UFOV3). Scores per subtests were expressed in milliseconds (minimum duration of stimulus presentation at which a participant performed with accuracy level of 75%) separately for each subtest and range from 16.7 ms to 500 ms. Higher reaction times corresponded with diminished performance. The UFOV test has been related to crash risk, and training with an UFOV protocol has proven to reduce crash risk in elderly drivers (Ball et al., Reference Ball, Edwards, Ross and Mcgwin2010), delay driving cessation and reduce associated mobility loss (Edwards et al., Reference Edwards2009).
Stroke Drivers Screening Assessment – Knowledge of Road Signs: The Road Sign Recognition test is a subtest of the Stroke Driver Screening Assessment used to evaluate driving of post-stroke patients (Radford and Lincoln, Reference Radford and Lincoln2004). The participant was given 20 pictures of road signs. The participant was asked to match the correct road sign to traffic situations that were presented in front of him. Two points were given for a correct match within the scope of 3 minutes, 1 point was given for a correct match after 3 minutes.
Porteus Maze test: The Porteus Maze test is a simple test of visuospatial abilities, planning, and visual attention. Selected mazes of the test have been found to be related to prospective crash risk in healthy older adults (Staplin et al., Reference Staplin, Gish, Lococo, Joyce and Sifrit2013). Participants were presented with a paper version of a maze and asked to start in the middle, do not lift their pencil from the paper and trail through the maze until the exit was reached. A total number of ten mazes with increasing complexity were presented. The index number of the most complicated maze that was completed successfully was used as the outcome measure.
Day 2: Driving simulator assessment
Participants completed the driving simulator test in a fixed-based STISIM3 driving simulator. The driving mock-up had an adjustable car seat, accelerator-, brake- and clutch-pedal, and a standard steering wheel with direction indicator. Speedometer, rear-view-, and side-mirrors were projected in their natural positions on screen. All participants drove two practice scenarios to get used to the driving simulator. Data were collected at frame rate (60 Hz), but was interpolated to a distance based logging of one data point per meter. This procedure was followed to prevent an overrepresentation of data points in areas were speed is low, leading to bias in the mean values of variables related to speed. Technical details with respect to this interpolation can be found in Ariën et al. (2015).
The driving simulator test consisted of six subsequent scenario in three different road environments, i.e. urban, rural, and motorway, including on-ramp. All road environments were presented twice with differing complexity levels (high vs. low). The order of presentation of the scenarios was counterbalanced between patients.
As the elderly are known to be more prone to transient adverse health effects related to the use of a driving simulator – so called simulator sickness – scenarios were short and participants were closely watched for signs of simulator sickness (Kolasinski, Reference Kolasinski1995). Participants experiencing symptoms were excluded from participation in the driving simulator assessment.
Driving simulator performance was assessed in two different ways. First, by means of observation, the experimenter completed the Test Ride for Investigating Practical Fitness to Drive – Belgian Version (De Raedt and Ponjaert-Kristoffersen, Reference De Raedt and Ponjaert-Kristoffersen2001). The TRIP is an observational grid for the evaluation of driving performance. All items are scored on a four-point scale. For the current study, we used the sum of 11 subscales scores as the total score (total range 11–44). The two subscales dealing with following distance were excluded because natural traffic was not present in front of the driver.
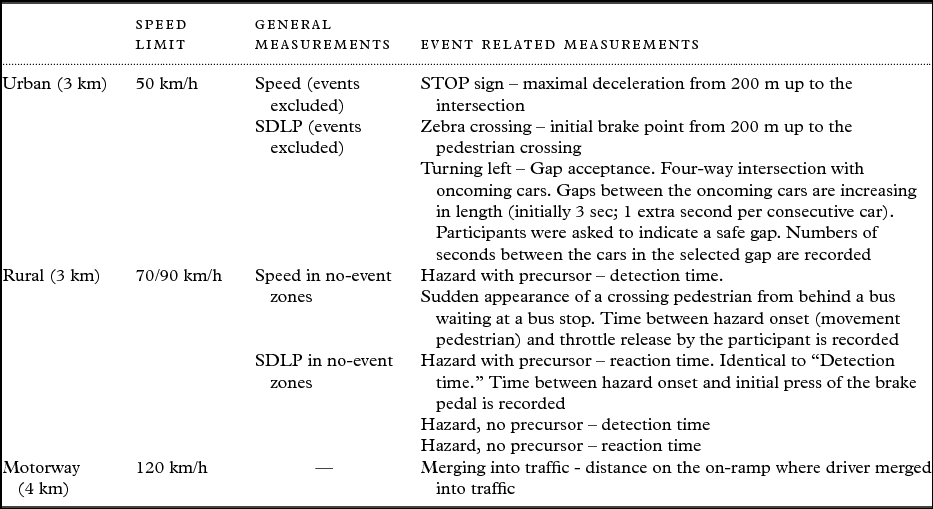
As an alternative to the observational assessment, performance parameters from the driving simulator were used to predict the on-road fitness to drive outcome. As performance parameters during fixed stretches of road, average speed and standard deviation of lateral position (SDLP) in zones without events. In addition to standard measures speed and lateral position, several specific events known to be difficult for older drivers were included in the driving simulator scenarios. These performance measures related to the events are described hereafter. A schematic overview of the scenario can be found in Table 1.
Description of driving simulator scenario

SDLP = standard deviation of lateral position.
Merging into traffic: Participants started the scenario on the on-ramp of a motorway and had to merge into passing traffic. Distance in meters along the on-ramp at which the participant changed lanes was measured.
Maximum deceleration – stop sign: The participant approached a stop-sign controlled intersection in a rural area. The maximum deceleration (m/s2) from 100 m before the intersection was recorded as a measure of abruptness of breaking and anticipation.
Initial brake point – zebra crossing: The participant approached a zebra crossing in a rural area and pedestrians intending to cross were presented. Pedestrians were visible to the driver during approach but only crossed the road when the time to collision between themselves and the driver was 3 sec. The distance from the zebra crossing where the participant started braking was recorded. Initial brake points were only calculated from 100 m before the zebra crossing to prevent including brake responses to other events.
Turning left – gap acceptance: When approaching an intersection in an urban area, a vocal recording “Turn left at the next intersection” was played. Participants were instructed to act as if they would turn left, mimicking the procedure as described in Cuenen et al. (Reference Cuenen2016). An oncoming stream of cars was presented with increasing number of seconds between each successive car. Participants were asked to indicate between which cars they would cross the oncoming traffic. The gap in seconds between those cars was recorded. Participants were asked not to truly turn left, as turning increases the risk of experiencing simulator sickness.
Detection time to road hazards: In a rural environment an unexpected pedestrian crossed the road. Participants had to break hard to avoid a collision with this pedestrian. Time in seconds from hazard onset (when a pedestrian started to cross) to first release of the throttle (10% release) was recorded as detection time.
Reaction time to road hazards: In the same scenario as described earlier, time in seconds from hazard onset (pedestrian starts crossing) to first input of the brake pedal was recorded as reaction time. For both the reaction, as well as detection time, the values were not averaged over the scenario with high and low traffic as the road hazard in the scenario with high traffic is signaled by a precursor (a bus stop) while in the low traffic scenario it is not.
Day 3: On-road driving test
The on-road driving test was performed in an instructor vehicle with a specialized fitness to drive evaluator from CARA and mimicked the official licensing procedure in Belgium. The assessor completed the TRIP assessment form for all participants, and classified participants as either “fit to drive,” “unfit to drive,” or “fit to drive under certain conditions (e.g. only in a restricted area).”
Statistical analyses
Following the methodology of Ott et al. (Reference Ott2013), the driving assessment outcome was dichotomized into pass/fail categories. Participants in the category “conditional” were merged with the category “fail.” Stepwise logistic regression was used to identify the best predictive model of the pass/fail outcome of the on-road driving test. In a first model, demographic characteristics and functional abilities were considered as predictors. In a second model, we investigated whether a driving simulator assessment improved our pass/fail classification. Two different evaluations were used: either a more holistic, observation based evaluation (hereafter; TRIP-based), or a performance parameters–based evaluation.
For all logistic regression models, predicted values derived from the model were saved. Receiver operating characteristics analyses were carried out with the predicted values to assess the accuracy, sensitivity and specificity of the predicted model. Sensitivity is defined as the chance that a person unfit to drive is identified as unfit to drive by the predictive model, while specificity is the chance that a person fit to drive is correctly identified as fit to drive by the predictive model. Optimal cut-off scores are determined by using the Youden index (Youden, Reference Youden1950).
Results
Participants descriptives and functional abilities
One hundred thirty six (102 males) volunteers participated in this study. More than two-thirds (68.4%) of those had a lower or professional education. 32.6% of the sample drove up to 5,000 km per year, 53% drove between 5,000 and 15,000 km per year while the remaining 14.4% drove more than 15,000 km per year.
After day 1, 9 participants discontinued their participation. Eleven participants did not complete the on-road driving test, due to various reasons (drop-out of the study, disease at the moment of on-road driving test, etc.). Therefore, a total of 116 participants completed all parts of the study. Seventy-five participants (65%) were considered fit to drive, 19 (16%) were unfit to drive and 22 (19%) were conditionally fit to drive.
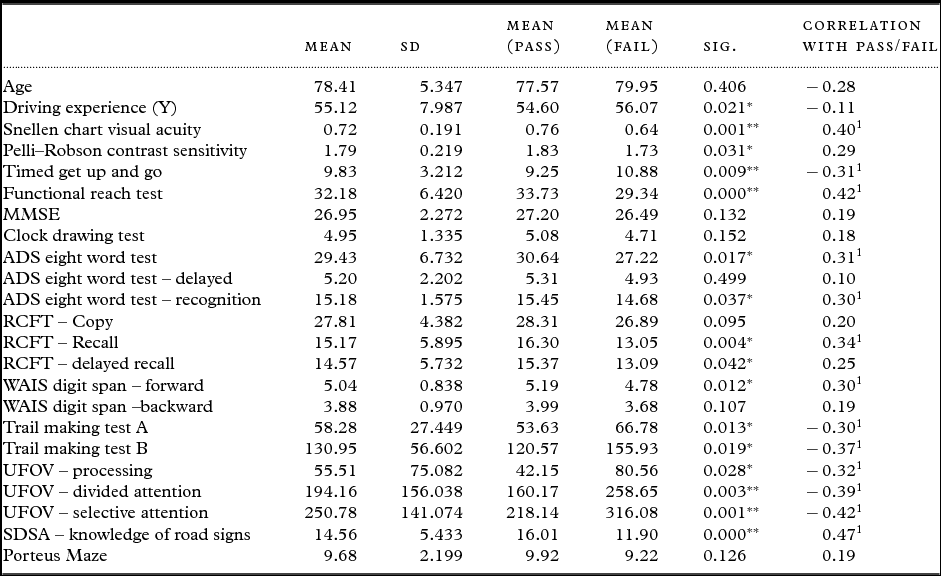
Demographic characteristics and functional test results of the complete sample (N = 116) are presented in Table 2. Biserial correlation coefficients of the functional test measures with the fitness to drive outcome are provided for all predictor variables in Table 2.
Descriptive statistics and biserial correlation coefficients of the functional test measures

*p < 0.05.
**p < 0.001.
1Selected for entrance in logistic regression model.
All variables with correlations of at least medium effect size (>0.30) with the pass/fail outcome were selected for inclusion in stepwise logistic regression model. Inter-predictor correlations above 0.80 were considered as a multi collinearity problem. Correlation between UFOV divided attention and UFOV selective attention was 0.91 (p < 0.001). Therefore, only UFOV selective attention was entered into the logistic regression analysis.
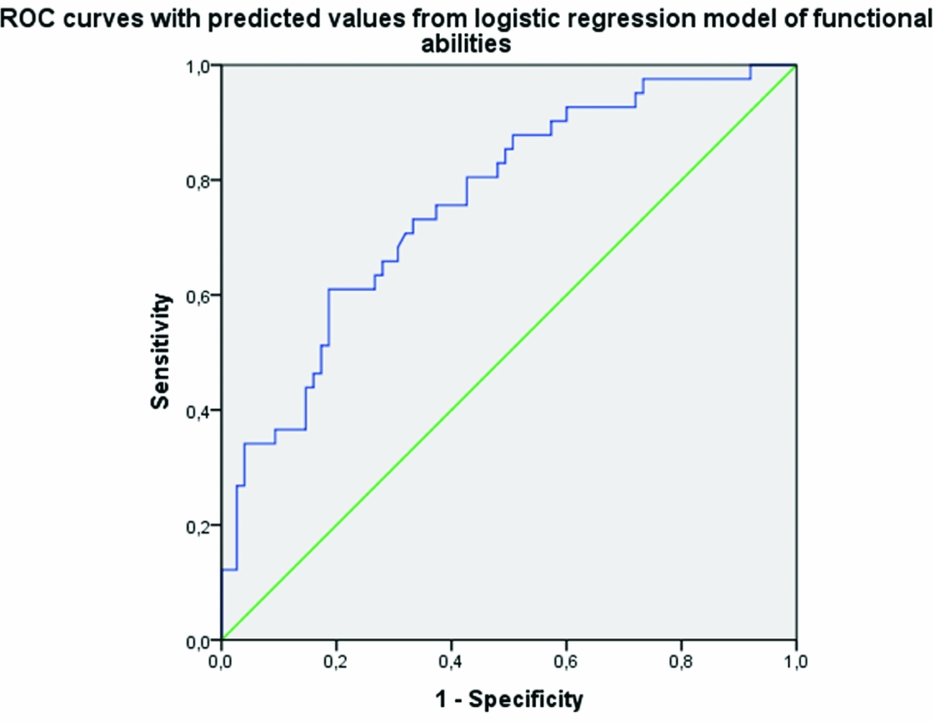
The most parsimonious, significant model for predicting on-road driving test pass or failure is formed by the Functional Reach test, Snellen chart visual acuity and Knowledge of Road Signs (χ 2 (3) = 24.80, p < 0.01). This model classifies 69% of participants correctly and explains 26.5% of the variance in the outcome measure (Table 3). Area under the curve was found to be 0.76 (SE: 0.046, p < 0.001, Figure 1) indicating that our model discriminates those unfit to drive from those fit to drive better than by chance.
Regression coefficient of the functional abilities model

R 2 = 0.265 (Nagelkerke) Model χ 2 (3) = 24.80**.
AUC = 0.760, SE=0.046, p < 0.001**.
*p < 0.05.
**p < 0.01.
Area under the curve as predicted from functional abilities model.

Driving simulator assessment – TRIP
Thirty-seven participants were excluded from the dataset before analyses of the driving simulator assessment (both observational, as well as performance measures), because of simulator sickness. The total number of participants that successfully completed the study, and thus are included in these analyses, is 79.
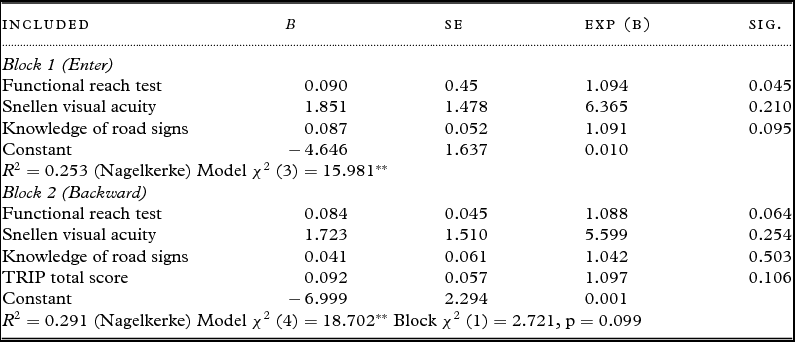
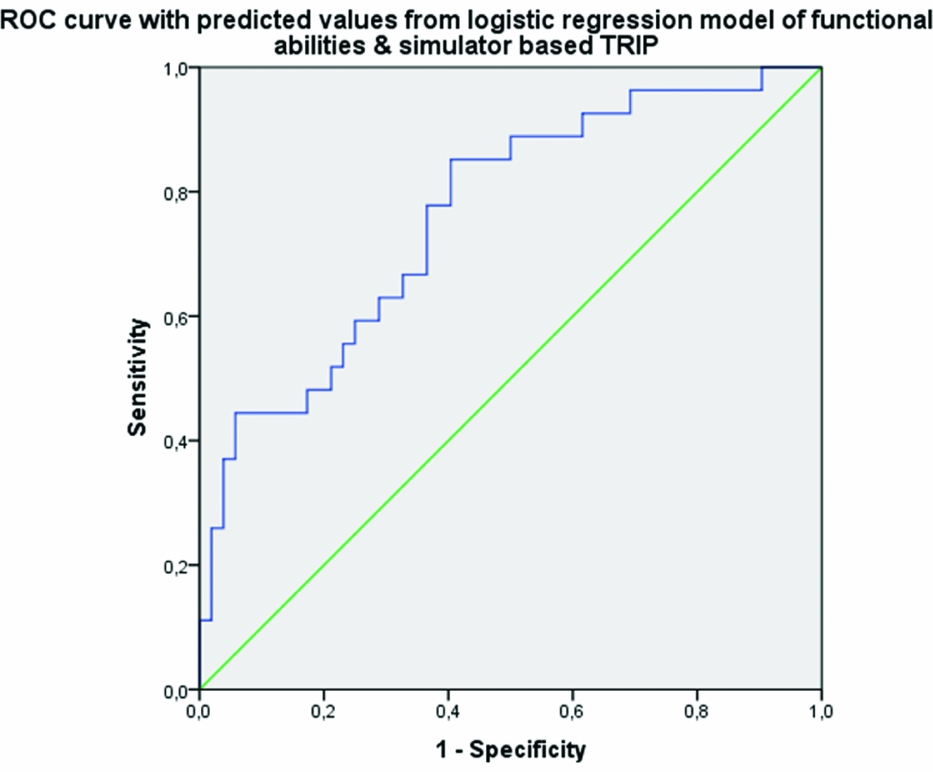
Participants that were judged as fit to drive differed significantly from participants that were unfit to drive in their TRIP score (37.35 vs. 32.70, min. 11, max. 44, t = −3.491, p = 0.001). Biserial correlation coefficient between the pass/fail classification and the TRIP total score was 0.45. The logistic regression model (backward stepwise) with addition of the holistic TRIP-based simulator assessment is a significant predictor of the on-road driving test outcome (χ 2 (4) = 18.702, p = 0.001). This model explains 29.1% of the variance and classifies 77% of participants correctly. Coefficients can be found in Table 4. Area under the curve was found to be 0.763 (SE = 0.056, p < 0.001) indicating that our model discriminates those unfit to drive from those fit to drive better than by chance (Figure 2). When compared to the previous model, prediction is not significantly improved. (χ 2 (1) = 2.721, p = 0.099).
Regression coefficient of the functional abilities+TRIP model

AUC= 0.763, SE = 0.056.
*p < 0.05.
**p < 0.001.
Area under the curve as predicted from functional abilities + TRIP model.

Driving simulator assessment – performance measures
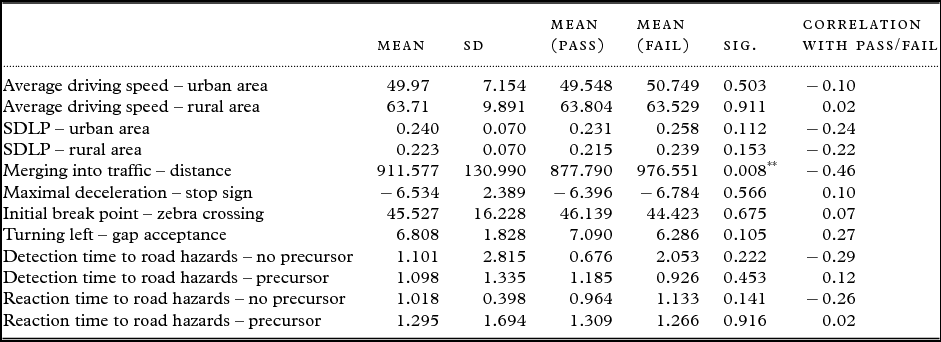
As an alternative to the holistic observation based evaluation, performance measures from the driving simulator were included in the logistic regression model. Descriptive statistics are presented in Table 5. The same procedure was followed as for selection of functional tests: individual biserial correlation coefficients between the pass/fail outcome measure and all performance parameters from the driving simulator were calculated (Table 5).
Descriptive statistics of driving simulator performance parameters

*p < 0.05.
**p < 0.001.
Only performance parameters with correlations <0.30 with the pass/fail outcome measure were included in the logistic regression model. Identical to the procedure with the TRIP-based evaluation, the selected set of functional abilities (model 1) is entered in a first step block. Thereafter, in a second block, performance parameters with sufficiently high correlation were added through a backward logistic regression method.
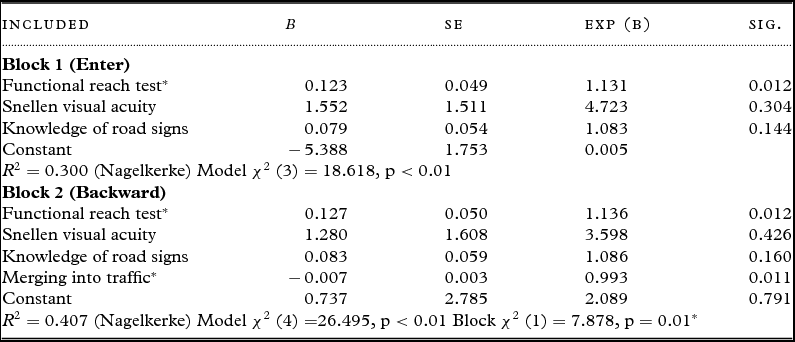
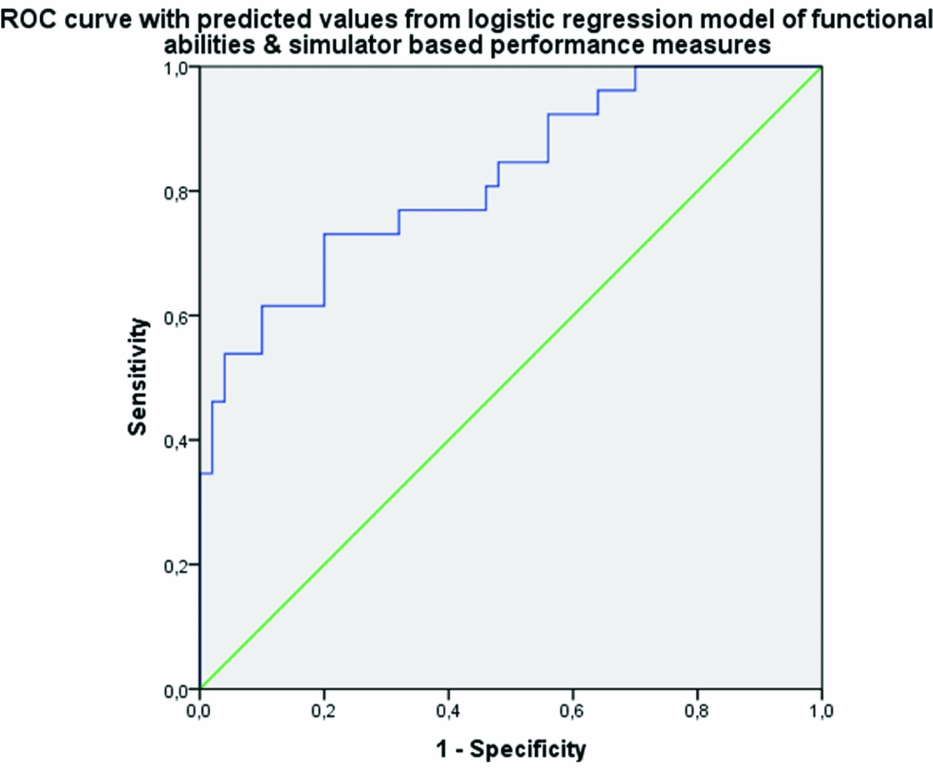
The model with addition of the performance parameters from the driving simulator is a significant better predictor than the model with only functional abilities tests (χ 2 (1) = 7.878, p = 0.005), and the addition of the driving simulator parameters increases the explained variance from 30% to 40.7%. This new model classifies 78.9% of participants correctly. The regression coefficients can be found in Table 6. Area under the curve was found to be 0.821 (SE = 0.052, p < 0.001), indicating that our model discriminates those unfit to drive from those fit to drive better than by chance (Figure 3).
Regression coefficient of the functional abilities+driving simulator model

AUC = 0.821, SE = 0.052.
*p < 0.05.
Area under the curve as predicted from functional abilities + driving simulator model.

This last regression model consisting of functional abilities, as well as driving simulator performance measures lead to the largest area under the curve, and was therefore selected as the best predictive model. Youden's index (Youden, Reference Youden1950) was used for determining the optimal cut-off of the predicted values to optimize sensitivity and specificity. Sensitivity is defined as the chance that a person unfit to drive is identified as unfit to drive by the predictive model, while specificity is the chance that a person fit to drive is correctly identified as fit to drive by the predictive model.
An optimal cut-off was found at 0.5. This cut-off results in 72.7% sensitivity and 81.5% specificity. Using this cut-off, chance that a person who is predicted to be unfit to drive, is actually found to be unfit during the on-road test is 61.5% (positive predictive value). However, the chance of a person who is predicted to be fit to actually be fit according to the on-road test is 88% (negative predictive value). The importance that is given to either correct identification of safe or unsafe drivers influences the choice of the optimal cut-off. When a cut-off score of 0.8 is used, this maximizes the chance of a driver predicted as unfit to drive to actually be unfit is maximized to 80.8%, thus decreasing the chance of taking away the license of a safe elderly driver. A cut-off score of 0.4 on the other hand increases the chance of a predicted fit person to be actually fit 94%.
Discussion
Elderly drivers rated as fit to drive differed significantly from those rated as unfit to drive on visual and physical abilities, such as visual acuity, contrast sensitivity, flexibility, and balance. Furthermore, on a cognitive level, both groups differed on measures of memory (ADS & RCFT direct and delayed recall), attention and processing speed (UFOV & TMT-A), working memory (digit span), mental flexibility (TMT-B), and knowledge of road signs (SDSA). Both groups did not differ in either age or driving experience, thus supporting previous findings by Ball that not age but functional abilities have a large effect on driver fitness (Ball et al., Reference Ball2006). Therefore, our results plead against a mandatory age based screening of older drivers.
Elderly drivers rated as unfit to drive scored significantly lower on the total score of the observational grid (TRIP) in the driving simulator than those fit to drive. Looking at the performance parameters collected from the driving simulator, participants passing or failing the on-road evaluation only differed on the measure “merging distance on a motorway.”
This study shows that elderly drivers regarded as fit to drive differ from those rated as unfit to drive on both the physical, as well as cognitive level of functioning, even when pathological changes are not present in such a magnitude that it is diagnosed as MCI or dementia. This finding supports the hypothesis that very subtle physical and cognitive changes can have an effect on driver fitness, and thus expands the previous results from Fritelli and Devlin to elderly persons without diagnosed cognitive impairment (Frittelli et al, Reference Frittelli2009; Devlin et al., Reference Devlin, Mcgillivray, Charlton, Lowndes and Etienne2012)).
The primary goal of this study was to develop a predictive battery of tests for fitness to drive screenings. This battery should be administered in a doctor's office setting within a limited timeframe to ensure both practical usability by medical professionals, as well as tolerance by elderly drivers. According to our results, this battery should consist of the Snellen chart of visual acuity, the Functional reach test and Knowledge of Road signs.
None of the considered cognitive tests were selected as a contributing predictor, despite their significant bivariate correlations with the fitness to drive outcome. This result deviates from previous studies predicting fitness to drive in elderly driver (sub)populations that have found cognitive tests to predict fitness to drive (Carr et al., Reference Carr, Barco, Wallendorf, Snellgrove and Ott2011; Hoggarth et al., Reference Hoggarth, Innes, Dalrymple-Alford and Jones2013; Bennett et al., Reference Bennett, Chekaluk and Batchelor2016). Mathias and Lucas (Reference Mathias and Lucas2009) conclude in their review study that predictive value is, among others factors, dependent on the outcome measurement used. They report separate results for different measures of unsafe driving (e.g. on-road driving tests, simulator based driving assessments, crash reports). To maximize chances of adoption of this test battery, we used the official Belgian licensing procedure as our outcome measure.
The use of the MMSE in advising cognitively impaired elderly to cease driving is often heard practice. A recent study predicting fitness to drive in Alzheimer's disease patients has found MMSE score to be a significant predictor, when using the official licensing procedure as a benchmark (Piersma et al., Reference Piersma2016). The results of the present study, in line with the recommendation of Bennett (Reference Bennett, Chekaluk and Batchelor2016), plead against this practice, at least for cognitively intact elderly or those experiencing cognitive complaints.
The second goal of this study was to determine whether an additional driving simulator assessment could improve the predictive ability of the office-based screening. The percentage of correctly classified participants increased when specific performance parameters from the driving simulator were included, but not when an observation based assessment was added to the procedure. The observation based driving simulator assessment did show a strong bivariate correlation to the on-road driving evaluation, but did not contribute significantly to the predictive model. A driving simulator assessment based on performance measures on the other hand, improves the predictive accuracy of fitness to drive significantly compared to only using functional ability tests.
Previous studies that used a simulated driving assessment to determine fitness to drive in elderly drivers are limited. Piersma (Reference Piersma2016) reached a correct classification of patients of 95% when using a combination of composite scores of clinical interviews, functional ability tests and a driving simulator assessment in drivers with Alzheimer's disease. A validation study confirmed this percentage of correct classification in MCI patients (Fuermaier et al., Reference Fuermaier2016). Our driving simulator assessment is the first to use specific performance parameters to predict fitness to drive in an at-risk population. Major advantage of this approach is the fact that the driving simulator assessment also identifies strengths and weaknesses in the driving abilities of the individual (instead of only fitness to drive). This newly gained information opens the door for personalized recommendations for rehabilitation or compensatory strategies. This knowledge can guide further exploration into options of elderly driver training for cognitively impaired drivers, such as recently started by Teasdale and colleagues (Teasdale et al., Reference Teasdale2016).
Implications
In Belgium, medical professionals (general practitioner or geriatrician) are the first person's people turn to for advice regarding their driving abilities. In Belgium, the minimal requirements for fitness to drive are listed in the Royal Decree (1998) concerning the driving license. Doctors are required to formulate fitness to drive advice for elderly patients based on this text, or refer patients in to the official fitness to drive licensing agency CARA.
The main problem that arises in this matter is the fact doctors often do not feel confident in assessing their patients (Jones et al., Reference Jones, Rouse-Watson, Beveridge, Sims and Schattner2012), and are ill-informed with respect to minimal requirements for fitness to drive for the aging population. Therefore many doctors are reluctant to advise patients and fear that their patient-professional relationship will be harmed or they do not recognize the presence of diminished driver fitness (Rapoport et al., Reference Rapoport2007). It is of uttermost importance that physicians are able to provide a fitness to drive advice, as the decision to stop driving is often based on advice of their doctor (Adler and Kuskowski, Reference Adler and Kuskowski2003). Our screening procedure can be of help for medical professionals to provide an objective advice to their patients, and take away barriers for screening patients presenting with very little symptoms because this screening procedure is easy to administer (well-known and easy to interpret tests, paper and pencil based) in a short timeframe. In addition; barriers for older drivers to seek advice about their fitness to drive is lowered as screening can take place with their trusted general practitioner.
Although predictive accuracy is improved by making use of a driving simulator assessment, the use of only the office-based screening is perfectly possible, for example if a driving simulator assessment is stressful for the patient, or if the patient suffers from simulator sickness. Further research can focus on identifying more tests, for example other cognitive tests, that can improve predictive accuracy. Adding more tests leads to an increase in time needed to administer the screening, but might be worth the time investment if predictive accuracy is increased significantly. At this point, using the upper limit cut-off score of 0.8 and lower limit cut-off score of 0.4, half of all elderly drivers (49%) do not need to undergo stressful and expensive on-road testing because the screening procedure provides a valid prediction of their on-road fitness to drive.
Limitations
A consideration regarding this study is the validity of the use of a driving simulator. Recent research investigated the validity of a driving simulator assessment relative to on-road driving performance and found the driving simulator to be a valid measure of on-road driving performance in healthy elderly drivers (Aksan et al., Reference Aksan, Hacker, Sager, Dawson, Anderson and Rizzo2016). In an at-risk elderly driver sample, only a small pilot study has compared driving parameters between on-road and simulated driving, reporting positive results. This indicates the driving simulator to be a valid assessment method for driving behavior in at-risk elderly drivers (Freund et al., Reference Freund, Gravenstein, Ferris and Shaheen2002).
Although participants rated as fit to drive differed from those rated as unfit to drive on several visual, physical and cognitive measures, as well as on the observational grid used to assess driving simulator performance, they did not differ on most performance parameters from the driving simulator. This result is in line with the results of Fritelli et al. (Reference Frittelli2009) who found MCI patients to differ only from healthy controls on one specific driving measure. These combined results suggest that changes in driving abilities in (very) early stages of cognitive impairment are subtle. These changes might not be visible during the driving simulator assessment but are picked up during an on-road driving evaluation. The determinants of on-road unfitness to drive in this subgroup of older drivers remain unclear, as an unsafe rating could alternatively be explained by acquired bad habits over the -often very long- period of driving. A helpful tool in this matter could be the on-road assessment method described by Wood (Reference Wood, Horswill, Lacherez and Anstey2013) that classifies drivers not only as fit or unfit to drive, but also provides more information with respect to driving habits that pose a safety risk.
A possible explanation for this finding might be that the driving simulator scenarios were too easy for the participants and therefore did not test the limits of their skills although traffic situations known to be difficult for older drivers were included in the scenario. Additionally, as participants were instructed to drive only straight ahead, many more difficult aspects of the driving task (decision-making, navigation), especially those on the higher levels of the Michon model of driving (Michon, Reference Michon1985) were not assessed.
Conclusions
The elderly rated as fit to drive were found to differ from elderly rated as unfit to drive on visual, physical and cognitive abilities without any significant difference on demographic factors, again confirming previous findings that not age but functional abilities are of higher importance in fitness to drive evaluations in elderly drivers (Ball et al., Reference Ball2006). The Snellen chart of visual acuity, the Functional reach test and Knowledge of Road signs were selected as best predictors of fitness to drive in a cognitive at-risk population. Predictive accuracy of off-road test procedure is significantly increased by adding a performance based driving simulator assessment. This study is the first to focus on the fitness to drive in an at-risk population and shows that subtle changes in driving may be present before the phase of pathological aging. The selected test battery and additional driving simulator assessment saves part of this growing group in society from taking stressful and expensive on-road evaluations. The described screening procedure with additional performance based driving simulator assessment provides personal information with respect to driving abilities, save a large proportion of elderly drivers from stressful and costly on-road assessments and creates opportunities for personalized driver training for elderly drivers.
Conflict of interest
None
Acknowledgments
This study was supported by a grant provided by the Flemish Agency for Innovation by Science and Technology (IWT), under the “Care Living Labs” program.
Description of authors’ roles
Judith H.J. Urlings collected the data, carried out the analysis of the data, and wrote the manuscript.
Ariane Cuenen was involved in driving simulator scenario development, data collection, and revision of the manuscript.
Tom Brijs was involved in the study design and revision of the manuscript.
Mark Lutin was involved in data collection and was as a medical coordinator responsible for the medical screening of all participants.
Ellen M.M. Jongen designed the study, supervised analysis of the data, and writing of the manuscript.