INTRODUCTION
Radiocarbon (14C) enters the ocean through air-sea CO2 gas exchange, and mainly occurs as dissolved inorganic carbonic acid in seawater. Dissolved inorganic 14C (DI14C) in the ocean decreases with the lapsed time from which DI14C enters the ocean because of its radioactive decay. Here, 14C data in ocean science is generally reported as the Δ14C value which was defined in Stuiver and Polach (Reference Stuiver and Polach1977). Over long time periods the Δ14C value of DIC in the water column has the highest value and an approximate steady state in surface layer (e.g. Broecker et al. Reference Broecker, Gerard, Ewing and Heezen1960; Druffel and Linick Reference Druffel and Linick1978; Nozaki et al. Reference Nozaki, Rye, Turekian and Dodge1978). In the 1950s and 1960s, however, the atmospheric testing of nuclear weapons added a large amount of 14C into the atmosphere, approximately doubling the pre-bomb test amount (Nydal and Lovseth Reference Nydal and Lovseth1983). Similarly, Δ14C of the surface water has also increased with the long air-sea 14CO2 equilibration time of ~10 yr (Druffel and Suess Reference Druffel and Suess1983), which reached its maximum value in the 1970s (Druffel Reference Druffel1989) and then has been decreasing in many regions (e.g. Key et al. Reference Key, Quay, Schlosser, McNichol, von Reden, Schneider, Elder, Stuiver and Östlund2002).
Worldwide observation of Δ14C in seawater in the ocean started from the early the 1970s as part of the GEOSECS program (Östlund and Stuiver Reference Östlund and Stuiver1980; Stuiver and Östlund Reference Stuiver and Östlund1980; Stuiver and Östlund Reference Stuiver and Östlund1983) and have been used to calculate the inventory of bomb produced 14C in the ocean (e.g. Broecker et al. Reference Broecker, Peng, Östlund and Stuiver1985; Peng et al. Reference Peng, Key and Östlund1998). The Δ14C in the surface water greatly varies latitudinally (e.g. Key et al. Reference Key, Quay, Schlosser, McNichol, von Reden, Schneider, Elder, Stuiver and Östlund2002) because of being affected by not only air-sea CO2 gas exchange but also mixing with sub-surface and/or deep water. Additionally, the value is also affected by regional surface currents such as the Kuroshio Current and California Current in the North Pacific. Therefore, the distribution of surface Δ14C in the ocean varies not only regionally but also shows seasonal variability, and therefore the Δ14C values obtained by a “snapshot” approach such as GEOSECS and WOCE are not always an accurate estimate of typical values for annual average Δ14C levels (Druffel Reference Druffel1989). Recent studies have reported that surface Δ14C at a site in the central North Pacific, the Sargasso Sea and the Southern Ocean varied up to 30‰ over a period of several weeks (McDuffee and Druffel Reference McDuffee and Druffel2007; Druffel and Griffin Reference Druffel and Griffin2008). This variability may seriously affect estimates of geochemical parameters such as the air-sea CO2 gas exchange rate using radiocarbon (Druffel and Griffin Reference Druffel and Griffin2008).
In the Center for Global Environmental Research of the National Institute for Environmental Studies, Japan (CGER/NIES), observations on the oceanic net CO2 flux in the North Pacific have been conducted since 1995 with the help of commercial shipping companies. A suite of analytical equipment was installed on board a cargo ship (Murphy et al. Reference Murphy, Nojiri, Fujinuma, Wong, Zeng, Kimoto and Kimoto2001), and the ship traveled between Japan and the United States or Canada on approximately the same route at least six times a year performing underway sampling and measurements for the study of seasonal and interannual variability of the air-sea CO2 flux in the North Pacific (e.g. Zeng et al. Reference Zeng, Nojiri, Murphy, Wong and Fujinuma2002). Surface Δ14C in the North Pacific has been monitored using samples collected by these volunteer observation ships (Aramaki et al. Reference Aramaki, Nojiri, Mukai, Kushibashi, Uchida and Shibata2010). Aramaki et al. (Reference Aramaki, Nojiri, Mukai, Kushibashi, Uchida and Shibata2010) reported the variation of surface Δ14C in the North Pacific in the summer season during 2003–2006. In this paper, we report new Δ14C data during 2007–2016 obtained by same methodology and discuss the temporal and spatial variation of surface Δ14C of the North Pacific in the summer season during 2004–2016.
SAMPLING AND METHODS
Seawater sampling for radiocarbon measurements was started in summer 2003 by the third volunteer observation ship (VOS), M/S Pyxis of Toyofuji Shipping Co., Ltd., Japan. The analytical equipment of the ship, however, was removed in spring of 2013, and then the equipment was re-installed on the fourth VOS, M/S New Century II in spring of 2014. Therefore, only limited data are available for 2013. The surface water drawn into the ship’s water intake at about 7 m depth was used for the pCO2 measurements (Murphy et al. Reference Murphy, Nojiri, Fujinuma, Wong, Zeng, Kimoto and Kimoto2001) and samples for radiocarbon measurement of ca. 250 mL were also taken every 12 hr during each cruise. By the sampling interval, we can get a sample from every 5° along longitude direction. There are two cruise routes of VOS: Japan to the U.S. west coast or the U.S. east coast via the Panama Canal. Therefore, VOS to the U.S. west coast travels in the north of around 40°N and VOS to the U.S. east coast travels in the south of around 40°N. Almost of VOS cruises for our sampling have been to the U.S. east coast.
The seawater samples were sterilized with 250 µL of saturated HgCl2 solution on board. The dissolved inorganic carbon in samples was evolved as CO2 gas by adding 4 mL of 100% H3PO4 and collected cryogenically by purging with pure N2 gas in the vacuum system (Aramaki et al. Reference Aramaki, Mizushima, Mizutani, Yamatoto, Togawa, Kabuto, Kuji, Gottdang, Klein and Mous2000). Then the CO2 gas was reduced to graphite with H2 over Fe powder (Kitagawa et al. Reference Kitagawa, Masuzawa, Nakamura and Matsumoto1993). The 14C/12C and 13C/12C ratios of the samples were measured using an accelerator mass spectrometer system at the National Institute for Environmental Studies, Japan (Kume et al. Reference Kume, Shibata, Tanaka, Yoneda, Kumamoto, Uehiro and Morita1997). The 14C activities were determined with respect to the international standard of oxalic acid (SRM-4990C, NIST, USA), and finally are reported as the Δ14C value (Stuiver and Polach Reference Stuiver and Polach1977). The precision of measurements for the Δ14C value was ± 3‰. Although we have been able to observe the seasonal variability of surface Δ14C throughout the year due to the continuous voyages by the ship, as a first step, we report here the interannual variability in the North Pacific during the summer season (from May to September) when the surface ocean is vertically stratified.
RESULTS AND DISCUSSION
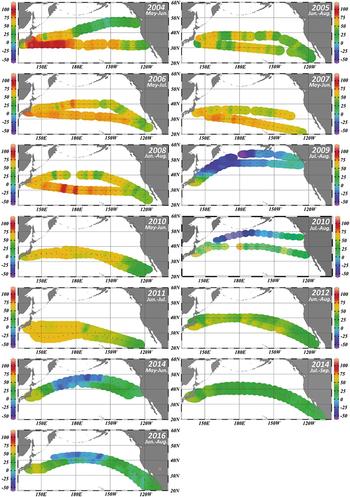
Spatial variations of the North Pacific surface Δ14C during the summer season (2004–2016) are shown in Figure 1. Δ14C data for 2004–2006 are derived from Aramaki et al. (Reference Aramaki, Nojiri, Mukai, Kushibashi, Uchida and Shibata2010) and we combine these data with our new data during 2007–2016 to discuss long-term Δ14C variation in Figure 1. Although Aramaki et al. (Reference Aramaki, Nojiri, Mukai, Kushibashi, Uchida and Shibata2010) also reported Δ14C data of 2003, we omitted the data-set from Figure 1 because the data-set was based on a limited number of samples (only 15) and was spatially less extensive. Because of the two cruise routes of VOS, we were able to obtain surface Δ14C data over a wide latitudinal range (20–50 °N) in the North Pacific and their values ranged from –55‰ to +108‰ during 2004–2016. Incidentally, most of sample were collected around subtropical region (20°N to 40°N), because most of the VOS cruises have been from Japan to the U.S. east coast. The surface Δ14C values in high latitudes, north of 40°N are significantly lower than more southerly latitudes. This reflects the strong vertical mixing in the region north of 40°N and the trend is similarly to previous worldwide observations such as GEOSECS (Östlund and Stuiver Reference Östlund and Stuiver1980) and WOCE (Key et al. Reference Key, Quay, Schlosser, McNichol, von Reden, Schneider, Elder, Stuiver and Östlund2002).
Spatial distribution of surface Δ14C (‰) in the North Pacific during summer, 2004–2016. Color bar scale in each figure is the same. Δ14C data during 2004–2006 are derived from Aramaki et al. (Reference Aramaki, Nojiri, Mukai, Kushibashi, Uchida and Shibata2010).

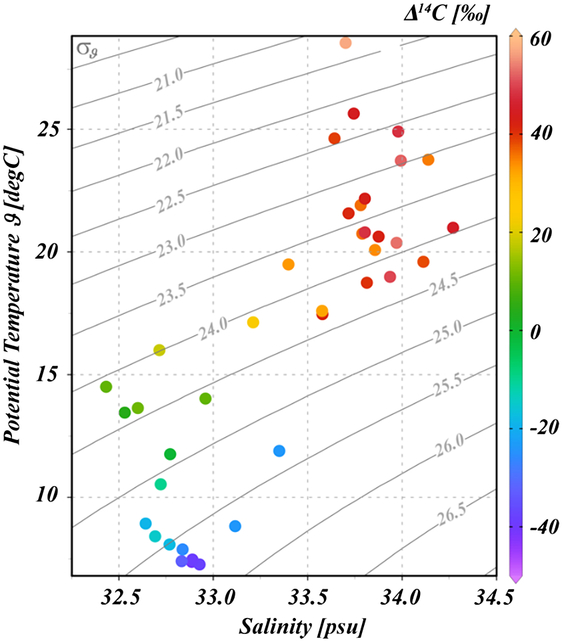
The relationship between surface Δ14C and temperature and salinity in July-August 2010 is shown in Figure 2. Because the voyage in July–August 2010 was from Japan to the U.S. west coast, VOS traveled over a wide latitudinal range (33°N to 50°N, see Figure 1) and the surface Δ14C widely ranged from –40‰ to +60‰. Therefore, it is assumed that the samples in July–August 2010 were collected in not only the subtropical region but also the subarctic region. Here, we divide the area that the samples were collected area into 6 groups. According to Figure 2, higher Δ14C values are associated with high-temperature and high-salinity, which are the properties that usually indicate a subtropical water mass such as the Kuroshio Current water of the North Pacific. Conversely, lower Δ14C are associated with low-temperature and low-salinity i.e. properties that indicate a subarctic water mass such as the Oyashio Current water.
Relationship between the surface Δ14C (‰), potential temperature (°C) and salinity in the North Pacific in July–August 2010. Gray curved lines in the graph are isopycnic lines for potential density (σθ).

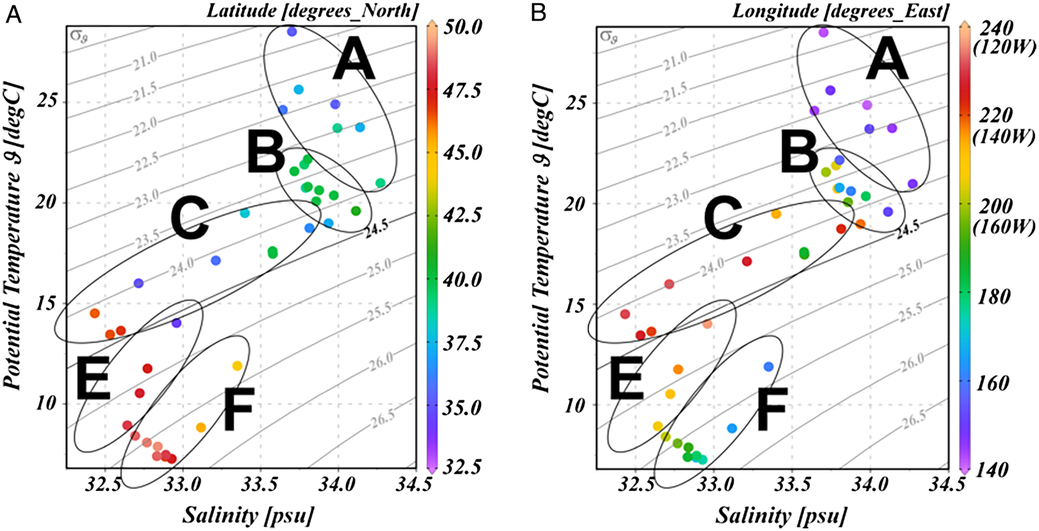
The relationship between temperature and salinity, and the latitude at which these samples were collected are shown in Figure 3a. Because the samples at lower latitude (< around 40°N) have low potential density, we define the water mass with potential density < around 24.5σθ as subtropical region water. In the subtropical region of the North Pacific, there is a clockwise subtropical circulation and the name of this circulation current changes with area: that is the Kuroshio, Kuroshio Extension, North Pacific, and California currents. Relationship between temperature and salinity, and longitude are shown in Figure 3b. The samples with density < 24.5σθ on the east side of around 215°E (145°W) have clearly low salinity. Therefore, we define the samples as group C, which were collected in the California Current area, because the current is a cold current and its salinity and temperature are lower than other subtropical current waters. Then, we separate group A: the Kuroshio and Kuroshio Extension Current area from group B: the North Pacific Current area around 165°E, because the samples on the west side of 165°E have slightly high temperature.
Relationship between the potential temperature (°C), salinity and latitude (°N) (a) and longitude (°E) (b) for samples collected in the North Pacific in July–August 2010. Gray curved lines in the graph are isopycnic lines for potential density (σθ). A, B, C, E, and F in the graph indicate the sample collection areas: the Kuroshio and Kuroshio Extension Current, North Pacific Current, California Current, Subarctic Current, and Alaska Current areas, respectively.

On the other hand, the lower Δ14C samples were collected at higher latitude (> 45°N) and we define these water mass as subarctic region water (see Figures 2 and 3a). There is an anticlockwise circulation in the subarctic region of the North Pacific and the name of this circulation current changes with the area: the Oyashio, East Kamchatka, Aleutian, and Alaska currents. The Alaska Current is a warm current and the temperature is higher than the other subarctic circulation currents. According to Figure 3b, the samples in the subarctic region on the east side of 200°E (160°W) clearly have higher temperatures. Therefore, we separate group F (the Alaska Current area) from group E (the Subarctic Current area) around 200°E (160°W). The subarctic current area includes the Oyashio, East Kamchatka, and Aleutian currents. Moreover, the samples which do not belong to the above groups and collected around 40°N are regarded as the samples collected in the mixed water region between subtropical and subarctic waters, and these samples are called group D. Although there is no data for group D in Figures 2 and 3, a number of samples were collected in the mixed water region (group D) during 2004–2016 because the two cruise routes of VOS travel around 40°N (see Figure 1).
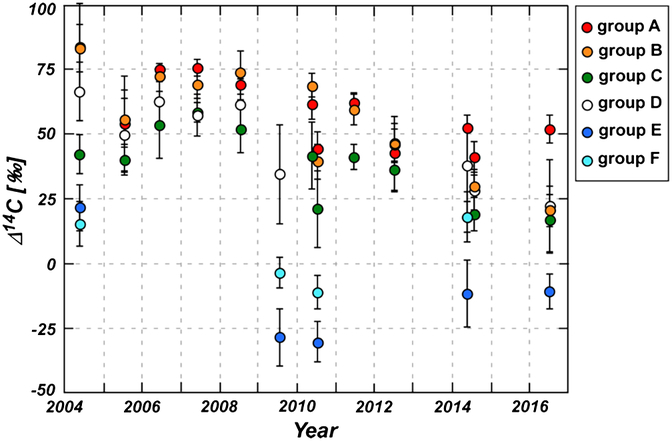
Variations of surface Δ14C averaged for each of the 6 groups (group A, B, C, D, E, and F) during 2004–2016 are shown in Figure 4. Although the Δ14C of group D is also shown in this figure, we do not discuss with temporal variation of group D in detail because the statistical error of averaged value is very large due to mixing of subtropical water (high Δ14C) with subarctic water (low Δ14C). Surface Δ14C in the subtropical groups show the following tend; A ≧ B ≫ C and have shown the same decreasing tendency during the last decade, though the Δ14C in all regions of 2005 were relatively lower than values of other years. Atmospheric Δ14C has been rapidly decreasing after the conclusion of the Partial Test Ban Treaty in 1963 (e.g. Levin and Kromer Reference Levin and Kromer2004). Subsequently surface Δ14C in the subtropical region of the North Pacific has been decreasing after the late 1970s with a time lag dependent on the oceanographic properties of each water mass (e.g. Druffel Reference Druffel1987). Our results indicate that the decreasing tendency has continued to the present.
Temporal variations of surface Δ14C in the North Pacific during 2004–2016. Red (group A), orange (group B), green (group C), white (group D), blue (group E), and light-blue (group F) circles show averaged surface Δ14C for each of the following areas; the Kuroshio and Kuroshio Extension Current, North Pacific Current, California Current, mixed water region between subtropical and subarctic waters, Subarctic Current and Alaska Current areas, respectively. Tick marks on the x-axis indicate 1 January.

The rate of decrease of groups A, B, and C during 2004–2016 was calculated to be –3.3, –5.2, and –3.3‰/yr, respectively. Morimoto et al. (Reference Morimoto, Kitagawa, Shibata and Kayanne2004) reported that the rate of decrease of surface Δ14C in the Kuroshio Current (group A) was –3‰/yr during the 1990s using banded coral, and their finding are consistent with our results. On the other hand, the rate based on GEOSECS in 1973 (Östlund and Stuiver Reference Östlund and Stuiver1980) and WOCE in 1991 (Key et al. Reference Key, Quay, Schlosser, McNichol, von Reden, Schneider, Elder, Stuiver and Östlund2002) for groups A, B, and C are calculated –2.2, –3.3, and –5.8 ‰/yr, respectively. Comparing the both, the rates during the last decade in group A and B they have speeded up and the rate in group C has slowed down. Surface Δ14C of group A, B, and C in 1973 were about 150, 150, and 200‰, respectively (Östlund and Stuiver Reference Östlund and Stuiver1980) which is the opposite of the present trend. Surface water in the eastern North Pacific is mixed with lower layer water, because the surface layer in the area is influenced by an upwelling flow. Thus, surface Δ14C in group C might have rapidly decreased after the late 1970s compared to values in group A and B. In addition, it seems that Δ14C of group A after 2012 has shown an approximately constant value of around 50‰. According to the atmospheric Δ14CO2 monitoring at the Jungfraujoch, Switzerland, the mean rate of decrease of Δ14CO2 after the early 2000s has slowed down and atmospheric Δ14CO2 of 2007 was ca. 50‰ (Levin et al. Reference Levin, Hammer, Kromer and Meinhardt2008). Thus, the stagnation of the decreasing trend of surface Δ14C after 2012 may be due to a slow decline of atmospheric Δ14CO2 and having reached an equilibrium between atmospheric Δ14CO2 and subtropical surface Δ14C in the western North Pacific (group A).
For the low Δ14C of 2005, Aramaki et al. (Reference Aramaki, Nojiri, Mukai, Kushibashi, Uchida and Shibata2010) reported that they could not find a cogent reason because there were no clear changes in the sample water properties such as temperature and salinity or pCO2 data of this cruise. Because the VOS cruise of June–August 2005 was a route from Japan to the U.S. east coast via the Panama Canal, water samples for Δ14C analysis were only obtained from an area south of 40°N (see Figure 1). Thus, all Δ14C data of 2005 were categorized into group A, B, C, and D of near the tropical region in the North Pacific (see Figure 4). According to the operational sea surface temperature (SST) anomaly charts of the National Oceanic and Atmospheric Administration (NOAA 2019), we can find a strong negative SST anomaly in the areas of around 40°N of the western North Pacific and along the California Peninsula in July 2005 where the VOS cruise of 2005 had traveled. Therefore, the surface water of 2005 in the tropical North Pacific was more heavily influenced by surface vertical mixing than other years during that period. It is for this reason, all Δ14C data of 2005 might be low due to mixing with lower layer water having low Δ14C. Similarly, averaged Δ14C values of July–August 2010 in the tropical North Pacific (Group A, B, and C) were lower than other years during that period (see Figure 4). Because of the La Niña event which occurred from summer of 2010 to spring of 2011, we can find in above web-site (NOAA 2019) that there was also extremely strong negative SST anomaly in the tropical region of the eastern North Pacific in summer of 2010.
Surface Δ14C in the subarctic region (groups E and F) was markedly lower than that in the subtropical region because of being affected by not only air-sea CO2 gas exchange but also mixing with the sub-surface layer water with low Δ14C by deep convection due to severe cooling every winter. Surface Δ14C in group F (the Alaska Current area) is almost always higher than that in group E (the Subarctic Current area) during 2004–2016, because the Alaska Current area is a warm current moving toward the north and associates with the California Current of the subtropical region. In these regions, it seems that the decreasing tend of surface Δ14C has turned to an increasing tend after 2010 (see Figure 4), although the number of Δ14C data and observations are limited. The result indicates that bomb-14C, which had accumulated under the mixed layer in the past few decades, may have resurfaced due to upwelling by deep convection after 2010.
ACKNOWLEDGMENTS
We thank the officers and crew of the M/S Pyxis and M/S New Century II, Toyofuji Shipping Co., Ltd. and Kagoshima Senpaku Kaisha Co., Ltd. for their kind cooperation during the oceanic observations. We also wish to thank to Prof. Y. Nojiri of Hirosaki University and Mr. S. Kariya and Mr. T. Yamada of Global Environmental Forum Foundation, Japan, for water sampling. We also wish to thank to the staff of AMS facility of the National Institute of Environmental Studies, Japan, for the measurement of our samples. This work has been financially supported by the Ministry of the Environment through the Global Environment Research Account for National Institutes (E0955 and E1451).
SUPPLEMENTARY MATERIAL
To view supplementary material for this article, please visit https://doi.org/10.1017/RDC.2019.32.