I. INTRODUCTION
Ultra-wideband (UWB) radar technology is being rapidly developed towards 3-D imaging radars that possess high down- and cross-range resolution. While the former comes from an UWB spectrum, the latter can be achieved by using either the synthetic aperture radar (SAR) or an antenna array, or their combination.
The SAR approach employs 2-D mechanical scanning usually with one transmit (Tx) and one receive (Rx) antenna. The scattered electromagnetic field is being spatially sampled on a dense regular grid, which makes data acquisition too long. UWB SAR has been widely used in landmine detection by ground penetrating radar (GPR) [Reference Daniels1].
The use of antenna array significantly speeds up the data acquisition even in cases when the array consists of independent Tx–Rx pairs working sequentially. Such arrays have been developed for landmine detection and medical imaging [Reference Craddock, Klemm, Preece and Leendertz2]. A more advanced GPR system combines SAR in on-track direction with a cross-track linear array that receives the scattered field simultaneously with all antennas [Reference Yarovoy, Savelyev, Aubry, Lys and Ligthart3].
A planar or conformal UWB array with the simultaneous signal reception would be the best solution in many applications. However its design encounters a serious contradiction between the antenna size, spacing in the array, and the level of sidelobes of the focused array, especially when high frequencies are used to achieve a high resolution. A sparse array with multiple Tx and multiple Rx antennas (i.e. multiple input multiple output (MIMO)) can be the optimal solution regarding the above factors plus complexity of the electronics. IRCTR investigated this direction for an application of concealed weapon detection and compared the quality of radar imaging by SAR and MIMO-based systems in the 3.1–10.6 GHz band [Reference Savelyev, Zhuge, Yarovoy, Ligthart and Levitas4]. A planar array with 4 Tx and 16 Rx antennas has been designed and evaluated. The array aperture was about 50 cm × 50 cm. In spite of quasi-real-time data acquisition and imaging, the performance of the array has been found insufficiently high due to a high level of artifacts in the imagery. Point spread function (PSF) of the array revealed a level of sidelobes of −6 dB versus −30 dB for SAR, which is acceptable for small free space targets but not for such extended targets as human body. One possible solution to decrease the sidelobe level deals with enlarging the array aperture while simultaneously increasing the number of antennas in the array. This way makes the entire system including the electronics much more complex and increases the costs significantly.
In this work we selected another solution that has been already tested successfully in the array-based GPR for landmine detection [Reference Yarovoy, Savelyev, Aubry, Lys and Ligthart3]. Combination of MIMO array focusing in the horizontal plane with SAR in the vertical plane represents a reasonable trade-off between the measurement speed and image quality. Therefore, we developed a specific array topology with 4 Tx and 16 Rx antennas that was installed on a mechanical scanner. Furthermore, the operational frequency range was chosen to be 10–18 GHz for the sake of array compactness and better PSF. Performance of the MIMO-SAR system has been compared with that of SAR for the same antennas and electronics.
The conducted research is intended for concealed weapon detection at microwaves. Despite the fact that security service already uses commercially available mm-wave imaging systems, a microwave radar system can be significantly less expensive and, in the meantime, it respects ethical issues of imaging a person without revealing too many personal details [Reference Sheen, McMakin and Hall5].
The paper is organized as follows. Section II describes the hardware of the two systems, Section III introduces a data processing and imaging technique, Section IV presents radar images and compares the performance of SAR and MIMO-SAR. Conclusions are summarized in Section V.
II. SAR and MIMO-SAR PROTOTYPES
A) System demands
The development of a cost-effective imaging radar requires optimization with respect to system bandwidth, dimensions of antenna array and number of antenna elements, multi-channel electronics, and available components such as switches, cables, and connectors. The latter limits the upper frequency to 18 GHz. The maximal number of receiving channels available was limited to 16. Meanwhile, a length of antenna array of about 50 cm (the width of the human body) along with 16 Rx antennas leads to 3 cm as the maximal width of antenna element that gives 10 GHz as the lower frequency. Therefore the antenna bandwidth has been defined as 10–18 GHz.
This system bandwidth can be implemented by using different UWB technologies. Here we considered the speed of data acquisition and the price of available solutions as the main factors. As a result, the video impulse technology with sequential sampling has been selected for realization of the electronics consisting of a pulse generator and a multi-channel receiver.
B) Antenna element and MIMO array
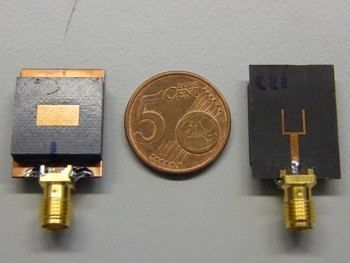
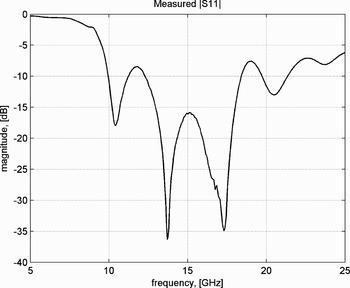
A stacked patch antenna, shown in Fig. 1, was developed as an antenna element for the array [Reference Yang, Yarovoy and Ligthart6]. Such an antenna is reasonably simple and has planar geometry, it radiates only in one hemisphere with a sufficiently large beamwidth, more specifically 120° at −10 dB level in both E- and H-plane. Return loss of the developed antenna determined by the measurement provides a −10 dB bandwidth from 10 to 18 GHz that satisfies the system requirements (Fig. 2). Gain measured at the electrical boresight varies from 5 to 10 dBi in the specified frequency band. The antenna measurements were conducted in an anechoic chamber of IRCTR by means of a vector network analyzer.
Antenna element (front side, coin for comparison, back side).

Antenna return loss.

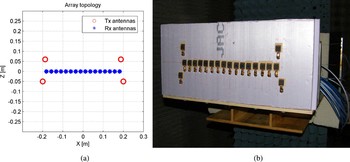
The MIMO array represents a specific topology, shown in Fig. 3(a), which was optimized by electromagnetic simulation with respect to the minimal focused beamwidth and sidelobe level of PSF. It consists of 4 Tx and 16 Rx antennas with vertical polarization. The separation between the feeding points of the Rx antennas is 2.5 cm, which is less than the minimal operational wavelength of 3 cm. The array itself provides focusing only in the horizontal plane, for 3-D imaging the mechanical scanning in the vertical plane is used with a selected step of data acquisition. Both the antenna separation and the step of data acquisition influence the sidelobe level of PSF. Figure 3(b) presents a photo of the array installed on a high-precision scanner, which constitutes the MIMO-SAR system.
MIMO array: (a) topology and (b) photo of MIMO-SAR.

The SAR system includes a Tx/Rx antenna pair with the same polarization and the separation of 2.5 cm. The antennas were installed on the same scanner for 2-D scanning with a selected step.
C) Electronics
The electronics have been built on a video impulse technology with sequential (stroboscopic) sampling by Geozondas Ltd. The electronics consist of a transmitter, a receiver (sampling converter) and a computer with dedicated signal processing and visualization software. The transmitter is a pulse generator that fires a mono-pulse with 30 ps duration while TTL triggering, power, and signal time delay are provided by the sampling converter. The latter represents an instrument with eight parallel channels.
In the MIMO-SAR case, the four Tx antennas are commuted to the pulse generator via a switch. Thus one array data acquisition includes four transmission cycles and in each of them the 16 Rx antennas receive simultaneously. Each fed-trough receiving channel of the sampling converter has two inputs, which allows for connection of two Rx antennas to one port. The data acquisition from the two Rx antennas is performed in the same time window but the signals from the even antennas are delayed without overlap with the signals from the odd antennas. A delay line was realized by means of a longer RF cable, i.e. eight Rx antennas were connected with shorter cables and the other eight with longer cables while the respective acquired signals were separated by data processing later on.
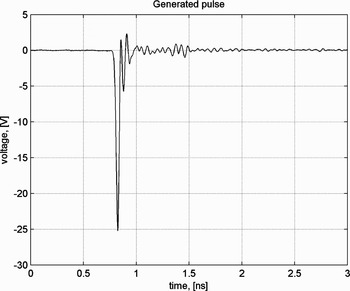
Figure 4 shows a generated pulse which was measured by connecting the pulse generator with one of the receiving ports via a short cable and attenuator. The pulse duration at −6 dB level is 30 ps, yet the acquired signal includes a noticeable ringing that indicates non-ideality of the electronics and eventually brings artifacts to the imagery. The influence of ringing is eliminated by deconvolution in data processing. The peak voltage of the pulse is −25 V, which corresponds to 41 dBm peak power.
Generated pulse.

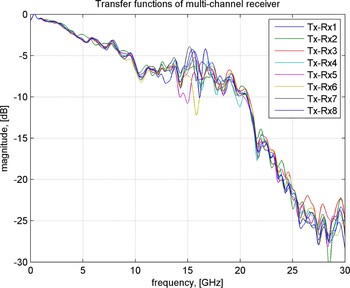
Normalized spectra of the pulses acquired sequentially by all the receiving channels are shown in Fig. 5, and they can be treated as transfer functions of the electronics. One can see that the difference between the channels becomes 7 dB in the 10–18 GHz band which also deteriorates the imagery. However, we correct for this by deconvolution in data processing.
Transfer functions of the eight receiving channels.

A quite important specification of the electronics is pulse repetition frequency (PRF) that defines the speed of data acquisition, and currently it is 500 kHz. The time window of the measurement can be set up to 20 ns while the maximal adjustable time delay is 100 ns, which allows for the measured range of 3 m at the maximal distance of 15 m. Stability of the electronics is characterized with a 2 ps jitter and a 15 ps/h system time drift. The resolution of analog-to-digital conversion is 12 bits. The dynamic range of the receiver was found to be 56 dB that can be increased by averaging of the acquired signal up to 86 dB. The maximal number of samples in a selected time window is 4096 and the maximal number of averages is 1024. Isolation between the channels, measured at 1 GHz, is 60 dB.
III. IMAGING ALGORITHM
A) Data pre-processing
Data pre-processing needs to be done before the focusing procedure (imaging) in order to suppress uncorrelated noise and to remove such non-informative components as DC, antenna coupling, and unwanted reflections. It also includes deconvolution of the system impulse response out of the pre-processed data in order to compress the received pulse that improves down-range resolution and, finally, the sharpness of the focused image.
For suppression of noise, a digital band-pass filtering is performed by means of a finite impulse response filter that possesses a linear phase characteristic. The operational bandwidth of antenna is 10–18 GHz which defines the pass-band of our filter. We implemented a band-pass filter by means of MATLAB Signal Processing Toolbox. The filtering is the first step in pre-processing.
The antenna coupling represents a direct signal between the Tx and Rx antennas that might be the strongest signal in the acquired data, which depends on the antenna configuration. The antenna coupling is acquired before the target measurement and subtracted from all the data afterwards. The unwanted reflections represent possible reflections from everything except the target. In the stationary environment, we do a measurement of background which we further subtract from the measurement with the installed target. This removes or drastically reduces both antenna coupling and unwanted reflections. However, in practice the background measurement is not always possible so in such a case, we subtract the antenna coupling and apply time gating to reject unwanted reflections.
Deconvolution is done after the filtering and background subtraction by means of a Wiener inverse filter:
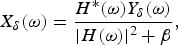
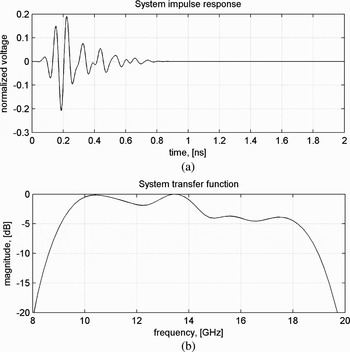
where Y δ(ω) is the Fourier transform of the acquired target signal, X δ(ω) is the spectrum of the original target signal, H(ω) is the system transfer function, and δ indicates here the presence of noise. The parameter β −1 expresses original signal-to-noise ratio and can be treated as a regularization parameter in the frequency domain. We estimate the system impulse response for each Tx/Rx channel, which includes convolved responses of the antennas and the electronics, from a reflection from a large metal plate (Fig. 6). The detailed description of the algorithm can be found in [Reference Savelyev and Sato7].
System impulse response and transfer function for one of Tx/Rx channels.

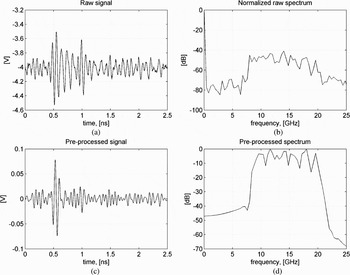
Figure 7 illustrates efficiency of the pre-processing for a weak reflection from a small metal sphere (3 cm diameter). The band-pass filtering, antenna coupling subtraction, and deconvolution have been applied to the acquired data. The target signal in this time window occurs at 0.5 ns time delay.
Efficiency of data pre-processing: (a, b) raw signal and spectrum and (c, d) pre-processed signal and spectrum.

Actually the target reflection, shown in Fig. 7, should arrive at 3.33 ns time delay because the sphere was placed at 0.5 m distance from the antennas. Therefore, a calibration procedure is needed to make the time scale of the acquired signal correspond to its actual travel time to the target and back. For this purpose we measure a small metal sphere placed at a given position every time after turning on and warming up of the radar. The time shift between the actual and measured travel times, estimated for every Tx/Rx channel, is applied to all the data measured afterwards.
B) Focusing procedure
Data focusing is based on Kirchhoff migration that has been widely used in seismology and recently applied to UWB radar imaging [Reference Zhuge, Savelyev, Yarovoy, Ligthart, Matuzas and Levitas8, Reference Zhuge, Savelyev, Yarovoy and Ligthart9]. It accounts for the wave front of the scattered electromagnetic field, which results in a more accurate target reconstruction than ray approximation. We selected this method based on the thorough comparison of different migration techniques for UWB SAR, which has been published in [Reference Zhuge, Savelyev, Yarovoy, Ligthart and Levitas10].
For multi-static radar configuration Kirchhoff migration can be expressed as follows:
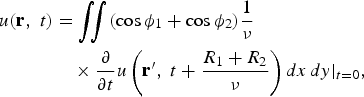
where u(r, t) represents the electromagnetic field back-propagated to a point with coordinate vector r at time instant t; u(r′, t) is the field measured in a point r′; R 1 and R 2 express the distances between the point r and Tx and Rx, respectively; ϕ 1 and ϕ 2 indicate the respective aspect angles; and ν stands for the propagation velocity. Note that differentiation of the signal in time increases noise but this effect is normally compensated by the spatial integration. The cosines in the formula suppress signals from other aspect angles which reduces the sidelobes. Due to its linear formulation, Kirchhoff migration can be calculated efficiently and implemented reasonably fast in practical applications.
IV. EXPERIMENTAL RESULTS
We performed a series of measurements with the SAR and MIMO-SAR prototypes in order to investigate their capability to image a weapon hidden on human body. Since a mannequin was wrapped in aluminum foil its reflectivity exceeds significantly that of a human body. The conducted experiments included measurements of PSF, cross-range capability, imaging of a gun in free space, on a mannequin and on a human body.
A distance between the antennas and a target was chosen to be 50 cm. The data were acquired within a 13 ns time window with 4096 points and 505 averages, and these settings resulted in 6 s per acquisition of the time window. For SAR, the maximal 2-D scanning was 50 × 100 cm with a step of 1 cm in both planes, which took about 8.3 h per scan. For MIMO-SAR, the maximal scanning height was 170 cm with a step of 0.5 cm, which took about 2.3 h. All the images were obtained by Kirchhoff migration for a 3-D grid with 0.5 × 0.5 × 0.5 cm voxel.
A) PSF and resolution capability
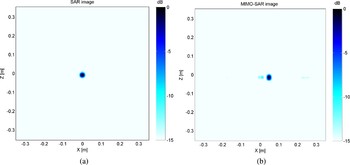
PSFs of the two prototypes were measured from a small metal sphere of 3 cm diameter and they are shown in Fig. 8 as 2-D images obtained by energy projection of 3-D images along the range direction to the vertical plane. One can see that the MIMO-SAR PSF presents small artifacts starting from −10 dB level. The diameter of the sphere's image corresponds to the actual 3 cm at −15 dB, which already indicates cross-range resolution of the imaging radar.
Images of a metal sphere of 3 cm diameter: (a) SAR and (b) MIMO-SAR.

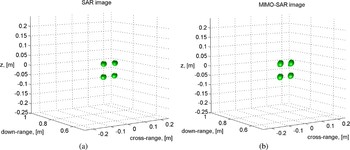
We also estimated the cross-range resolution capability by imaging four spheres separated in the vertical plane by 3 cm between the edges. Figure 9 shows the successfully resolved spheres for both SAR and MIMO-SAR. The 3-D images are given in 6 dB dynamic range for the best visualization.
Images of four metal spheres separated by 3 cm: (a) SAR and (b) MIMO-SAR.

B) Weapon imaging
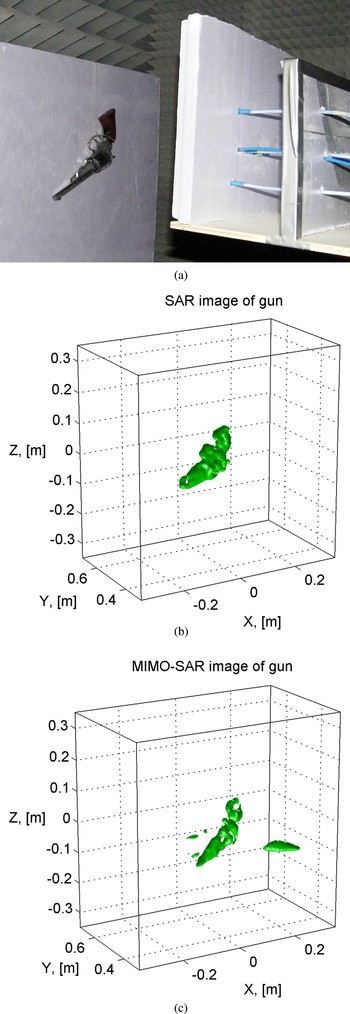
At first we measured a metal gun (with a wooden handle) in free space (Fig. 10(a)). The 3-D images obtained by SAR and MIMO-SAR are shown in Figs 10(b) and 10(c) respectively. The SAR imaging reconstructs the gun more accurately without artifacts at 15 dB dynamic range, while the MIMO-SAR imaging presents artifacts at −10 dB level. Note that the step of mechanical scanning is finer for MIMO-SAR, more specifically 0.5 cm versus 1 cm for SAR, which indicates that the reason for artifacts is the array topology.
Images of a gun in free space: (a) photo, (b) SAR image for 15 dB dynamic range, and (c) MIMO-SAR image for 10 dB dynamic range.

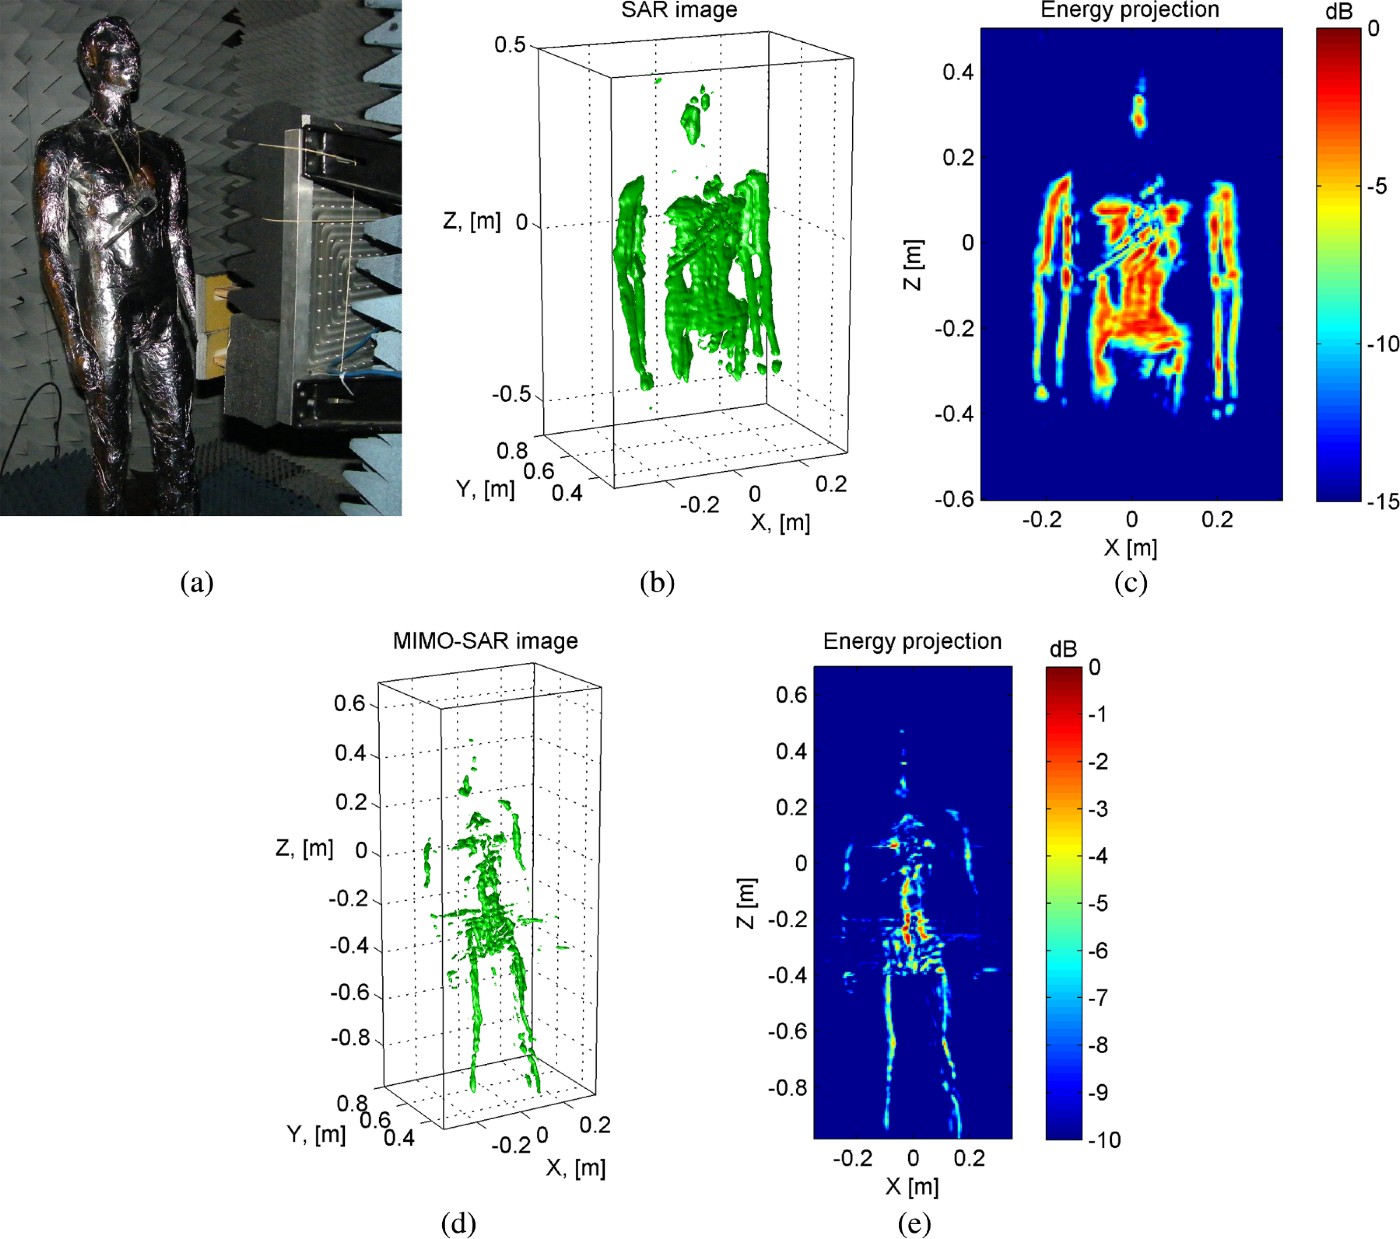
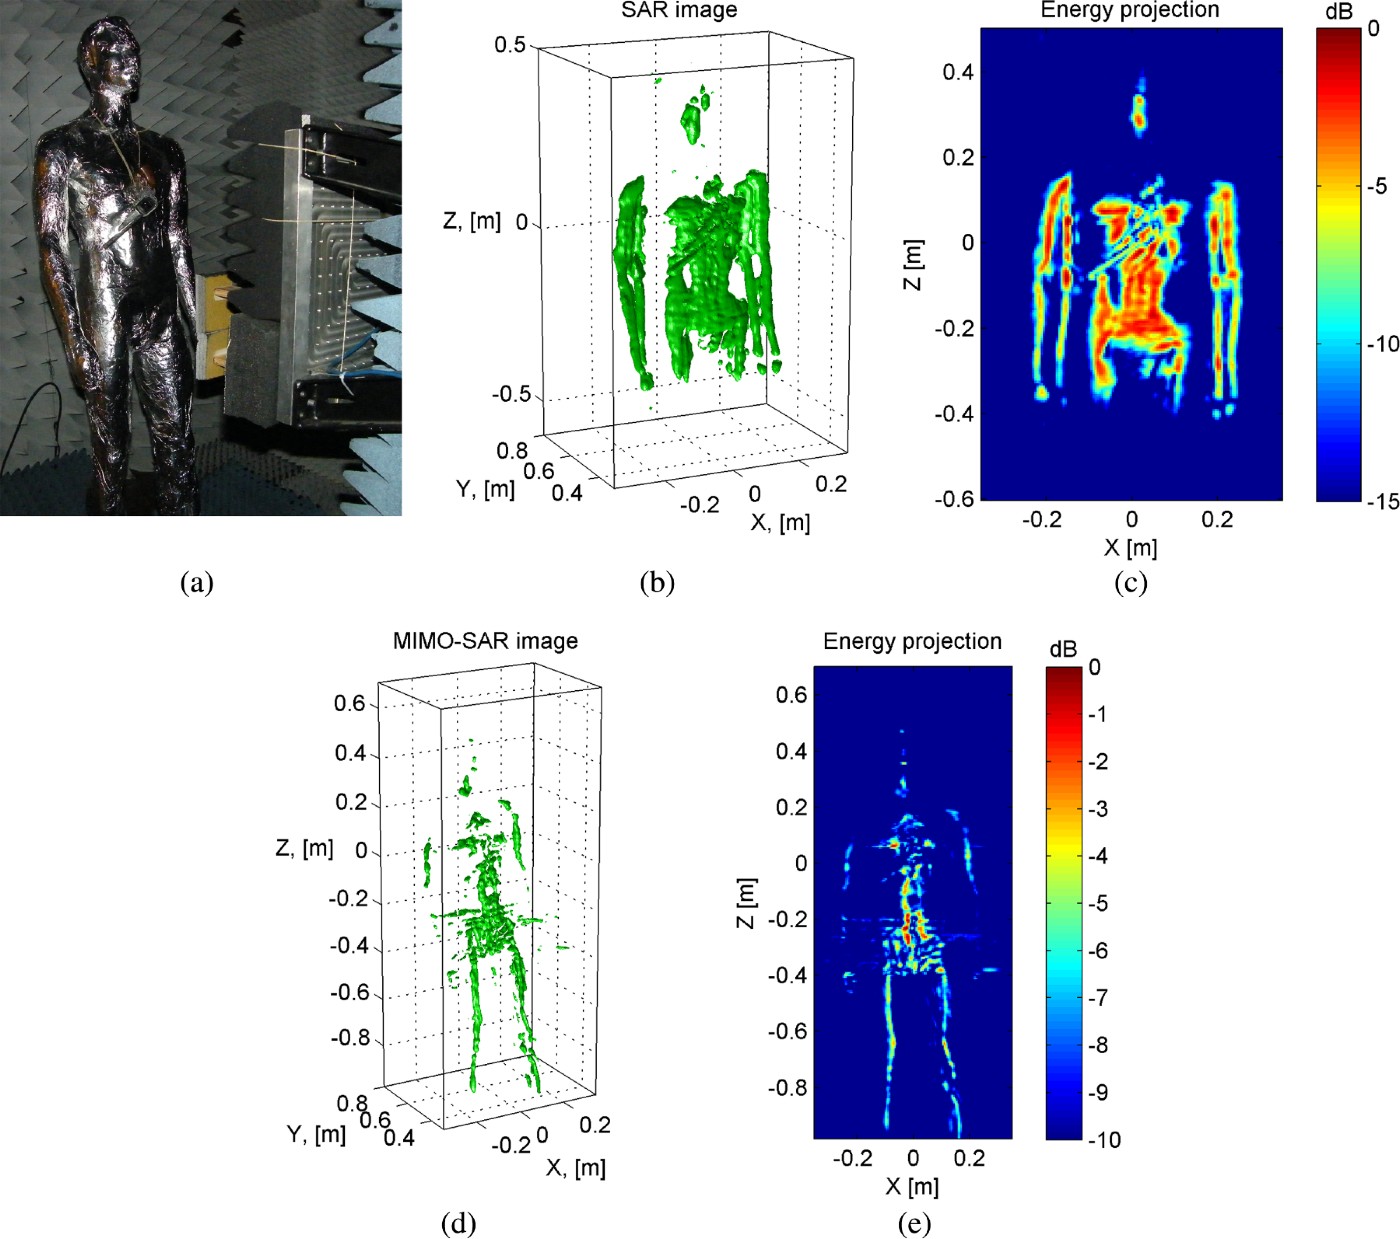
The same gun was measured on a mannequin wrapped in aluminum foil as shown in Fig. 11(a). The SAR imaging reconstructs the shape of the mannequin and makes the gun, or more specifically its barrel, visible on it clearly at 15 dB dynamic range (Figs 11(b) and 11(c)). The MIMO-SAR imaging in this experiment can only reconstruct the shape of the mannequin at 10 dB dynamic range (Figs 11(d) and 11(e)).
Images of a gun on a mannequin: (a) photo, (b, c) SAR 3-D and 2-D images for 15 dB dynamic range, and (d, e) MIMO-SAR 3-D and 2-D images for 10 dB dynamic range.
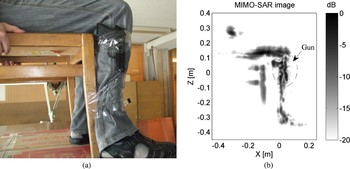
Since the aluminum foil has a much higher reflectivity than the human body we carried out an experiment with a gun on a person. The scan of MIMO-SAR was 40 cm with the same 0.5 cm step and the data acquisition took 32 min. Meanwhile a gun was fixed on a leg of a sitting still person, which prevented minor movements (also due to breathing) and, consequently, blurring of the image. The result is shown in Fig. 12, where the gun can be clearly seen at 20 dB dynamic range. This means that a human body produces a significantly lower level of artifacts than the mannequin in foil on one hand, and on the other hand the MIMO-SAR approach has a serious potential for imaging of concealed weapons.
MIMO-SAR image of a gun on the human body: (a) photo and (b) 2-D image for 20 dB dynamic range.

C) Imaging speed
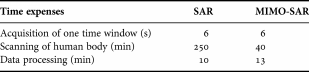
For real-time application, the demonstrated imaging potential should be evaluated in terms of the measurement and processing speed. Therefore, we summarize the current data acquisition time, the scanning time, and the processing time, which are required to image a volume of 50 × 50 × 10 cm with high resolution, in Table 1. Although the MIMO-SAR approach is much faster still the imaging speed is not appropriate for realistic scenarios when the complete imaging should be done within a minute.
Current imaging speed for 50 × 50 cm scanned area.
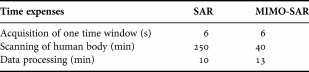
However, we can significantly reduce the data acquisition time and the scanning time, respectively, by increasing PRF in the electronics. The current demonstrator works with a PRF of 500 kHz while its developers declare 10 MHz for future products. This already reduces the acquisition time by factor 20. Next to that, the currently used 4096 points and 505 averages to acquire one time window will be optimized, which will give another factor of 20 at least. The use of better low-noise amplifiers in the receiver will improve its dynamic range and minimize the averaging. Thus, we can achieve a scanning time of a few seconds for MIMO-SAR with the selected video-impulse UWB technology.
The next challenge is to reduce the data processing time to below 1 min, which does not look unrealistic either. Our data processing has been implemented in MATLAB on an average computer with 3 GHz processor and 4 GB memory, under Windows XP 64-bit. Development of dedicated software under real-time operational system should increase the computation speed drastically. Another possibility lies in the optimization of the imaging algorithm and minimization of the imaged volume.
Speaking of the imagery itself, the further progress should be done towards a larger antenna bandwidth and an optimized array topology. The former will improve the separation between the reflections from a weapon and from the human body while the latter will decrease the PSF artifacts.
V. CONCLUSION
Imaging capability of two approaches has been investigated by an experiment for concealed weapon detection in a frequency band of 10–18 GHz. Two radar prototypes have been built on the same hardware and antennas, namely SAR and MIMO-SAR. The SAR uses two antennas and requires 2-D mechanical scanning. For the MIMO-SAR, a specific MIMO array with 4 Tx and 16 Rx antennas has been developed. The MIMO-SAR combines focusing of the array aperture in the horizontal plane with focusing of synthetic aperture in the vertical plane so it requires mechanical scanning in one plane only and, as such, acquires the data much faster than SAR.
The basic characteristics of imaging radar, namely PSF and cross-range resolution, have been measured. Both SAR and MIMO-SAR give the same resolution of 3 cm and the same main lobe of PSF but a significant difference in the level of artifacts. For the MIMO-SAR it is of about −10 dB while for the SAR this level is below −15 dB.
Experiments with a gun on a mannequin, which was wrapped in aluminum foil, have shown that the SAR reconstructs the shape of the mannequin and images the gun on it clearly while the MIMO-SAR can reconstruct only the mannequin. This is due to the fact that the mannequin represents an extended metallic target from which reflections significantly contribute to the focused image of the gun through the sidelobes of PSF. An experiment with a person for the MIMO-SAR resulted in a clear image of the gun on the body. Therefore the obtained results demonstrate a high potential of the MIMO-SAR technology for concealed weapon detection at microwaves.
 Timofey Savelyev was born in Frunze, Soviet Union in 1974. He received a Dipl.-Eng. degree (cum laude) in radio electronics from the Baltic State Technical University, St. Petersburg, Russia in 1997. A Ph.D. degree in electrical engineering was granted to him by the State University of Aerospace Instrumentation, St. Petersburg, Russia in 2000 for his research in adaptive array radar. Since then he worked in the field of GPR landmine detection as a visiting scientist at the Vrije Universiteit Brussel, Brussels, Belgium in 2002, as a research associate at the Centre for Northeast Asian Studies, Tohoku University, Sendai, Japan in 2003–2005. At present he is a senior researcher with the International Research Centre for Telecommunications and Radar, Delft University of Technology, The Netherlands. His current research interests include GPR landmine detection, ultra-wideband array radars, ultra-wideband signal processing and analysis and radar imaging.
 Xiaodong Zhuge received a B.Sc. degree from the Beijing University of Posts and Telecommunications, Beijing, China in 2004, and a M.Sc. degree (cum laude) from the Delft University of Technology (TUDelft), The Netherlands in 2006. Since then he has been working on his Ph.D. research in the International Research Centre for Telecommunications and Radar, TUDelft. His main research interests include UWB radar imaging, signal processing, and antenna array design. He was the recipient of the 2007 European Radar Conference Young Engineers Prize for the paper that best advanced the state-of-the-art in radar at the 10th European Microwave Week, Munich, Germany.
 Bill Yang was born in Taipei, Taiwan, on April 2, 1980. He received a B.Sc. degree in Communication Engineering from the Chiao Tung University, Hsin Chu, in 2002, and a M.Sc. degree in the Delft University of Technology (TUDelft), The Netherlands in 2006. Since 2006 he has been working on his Ph.D. degree in the International Research Centre for Telecommunications and Radar (IRCTR) of TUDelft. His research interests include UWB antenna array design and signal processing for near-field imaging.
 Pascal Aubry was born in Fontenay-aux-Roses, France, on March 8, 1969. He received a D.E.S.S. in Electronics and Automatics from Université Pierre et Marie Curie (Paris 6), Paris, in 1993. After his military service in the Air Force in 1994, he was a Young Graduate Trainee at the European Space Research and Technology Centre (ESTEC) in 1996, working on antenna measurements. Since 1997 he has been working with the International Research Centre for Telecommunications and Radar (IRCTR) of Delft University of Technology, The Netherlands. His interests include antenna measurement techniques in frequency and time domain, and GPR system testing.
 Alexander Yarovoy graduated from the Kharkov State University, Ukraine, in 1984 with a Diploma with honor in radiophysics and electronics. He received the Cand. Phys. & Math. Sci. and Dr. Phys. & Math. Sci. degrees in radiophysics in 1987 and 1994, respectively. In 1987 he joined the Department of Radiophysics at the Kharkov State University as a Researcher and became a Professor there in 1997. From September 1994 through 1996 he was with Technical University of Ilmenau, Germany as a Visiting Researcher. Since 1999 he is with the International Research Centre for Telecommunications-Transmission and Radar (IRCTR) at the Delft University of Technology, The Netherlands. Since 2009 he leads there a chair of Microwave Technology and Systems for Radar. Prof. Yarovoy is the recipient of a 1996 International Union of Radio Science (URSI) “Young Scientists Award” and the European Microwave Week Radar Award in 2001 for the paper that best advances the state-of-the-art in radar technology (together with L.P. Ligthart and P. van Genderen). Prof. Yarovoy served as the Chair and TPC chair of the 5th European Radar Conference (EuRAD'08), Amsterdam, The Netherlands, Delft, as well as the Secretary of the 1st European Radar Conference (EuRAD'04), Amsterdam, The Netherlands.
 Leo Ligthart (M'94-SM'95-F'02) was born in Rotterdam, The Netherlands, on September 15, 1946. He received an Engineer's degree (cum laude) and a Doctor of Technology degree from the Delft University of Technology in 1969 and 1985, respectively. He received Doctorates (honoris causa) at the Moscow State Technical University of Civil Aviation in 1999 and Tomsk State University of Control Systems and Radioelectronics in 2001. Since 1992, he has held the chair of Microwave Transmission, Radar and Remote Sensing in the Department of Information Technology and Systems, Delft University of Technology. In 1994, he became director of the International Research Centre for Telecommunications and Radar. Prof. Ligthart's principal areas of specialization include antennas and propagation, radar and remote sensing, but he has also been active in satellite, mobile, and radio communications.
 Boris Levitas was born in Vilnius, Lithuania, on March 29, 1947. He graduated from the Vilnius State University in 1970 with a Diploma in theoretical physics and he received a Ph.D. degree from the Kaunas Polytechnic Institute in radio measurement devices in 1981. From 1969 till 1971 he was in the Soviet Army as Lieutenant, Telecommunication and radio monitoring platoon leader Commander. From 1971 till 1990 he worked in the Vilnius Research and Development Institute of Radio-measuring instruments, holding position from engineer to senior research officer in Sampling Oscilloscopes and UWB units design. From 1988 till 1995 he was an organizer, technical director, and director of research-and-production company Zondas. From 1995 he is the President and CEO of research-and-production company Geozondas, Head of the projects on UWB sampling oscilloscopes, ground penetrating radars, time domain measurement systems, antenna measurement systems, RCS measurements, ISAR & SAR imaging, From October 2004 till January 2005 he worked as a Guest Professor in the Delft Technical University, The Netherlands. Dr. Levitas's principal areas of specialization are UWB time domain equipment and systems design, antenna measurements, radar imaging, and digital signal processing.