


Introduction
Low birth weight is associated with an increased predisposition to a number of adult diseases, including hypertension and impaired glucose tolerance.Reference Barker, Osmond, Golding, Kuh and Wadsworth 1 , Reference Eriksson, Forsen, Tuomilehto, Osmond and Barker 2 In most developed countries, being born small occurs as a result of the reduction in the delivery of nutrients and/or oxygen to the fetus due to placental insufficiency, which leads to a reduction in fetal growth. We and others have used a rat model that mimics uteroplacental insufficiency, whereby the uterine vessels are bilaterally ligated during late gestation, resulting in offspring born 10–15% lighter than those exposed to sham surgery.Reference Wlodek, Westcott, Siebel, Owens and Moritz 3 – Reference Black, Siebel, Gezmish, Moritz and Wlodek 6 In this model, male offspring are more likely to present with a more severe phenotype, which includes cardiovascular dysfunction which leads to hypertension.Reference Black, Siebel, Gezmish, Moritz and Wlodek 6 – Reference Wadley, Wlodek and Ng 8
During the development of the fetal heart, proliferation and apoptosis of cardiomyocytes control the myocardial growth.Reference Rudolph 9 In humans, during late gestation, the proliferative capacity of cardiomyocytes decreases, which leads to maturation and differentiation of the cells.Reference Rudolph 9 In rats, proliferation of the heart continues until the early neonatal period, with maturation continuing until postnatal day (PN) 3–4.Reference Li, Wang, Capasso and Gerdes 10 Given the limited proliferative potential of the cardiomyocytes after birth, in both humans and rats, a reduced complement of cardiomyocytes is likely to impact the functional capabilities of the adult heart, which is of great significance if the organ is exposed to challenges such as hypertrophy or ischemia. Consequently, programming for cardiac vulnerability later in life can occur during this critical late gestational/early postnatal period.
In animal models, placental insufficiency during late gestation adversely affects fetal growth, resulting in symmetrical growth restriction and abnormal cardiac development.Reference Xue, Dasgupta, Chen and Zhang 11 In sheep, there is a reduction in cell cycle activityReference Louey, Jonker, Giraud and Thornburg 12 and altered cardiomyocyte maturation in growth restricted animals.Reference Bubb, Cock and Black 13 In rats, two models of growth restriction are extensively used. In a maternal undernutrition model, restricted offspring present with a reduction in cardiomyocytes at birth,Reference Corstius, Zimanyi and Maka 14 leading to an accelerated cardiac growth in the lactational period.Reference Lim, Zimanyi and Black 15 Further, we have demonstrated that in our model of growth restriction which is the result of uteroplacental insufficiency, there is a significant reduction in cardiomyocyte number in males at PN7, which is associated with a significant increase in blood pressure at 6 months of age.Reference Black, Siebel, Gezmish, Moritz and Wlodek 6
In the heart, the janus activated kinase (JAK)/signal transducer and activator of transcription (STAT) pathway has been implicated in the control of cardiomyocyte differentiation, proliferation and apoptosis and cellular hypertrophy.Reference Barouch, Berkowitz, Harrison, O’Donnell and Hare 16 – Reference Shiojima and Walsh 18 Activation of the JAK/STAT pathway initially requires the binding of a specific ligand to its receptor, which leads to the activation of JAK tyrosine kinases. Activated JAKs then phosphorylate the receptor of interest, creating docking sites for signalling proteins such as STATs. Once phosphorylated by JAKs, STATs then dimerize and translocate to the nucleus where they activate gene transcription. A number of targets are activated by the JAK/STAT pathway that specifically started cardiomyocyte proliferation and apoptosis. In the heart, JAK2 phosphorylation can activate the insulin receptor substrate to initiate phosphatidylinositol 3 kinase (PI3K) activation.Reference Giani, Gironacci and Munoz 19 PI3K in the heart is responsible for apoptosis, with activation reducing apoptosis.Reference Trivedi, Yang and Barouch 20 JAK/STAT pathway can be negatively regulated by the suppressor of cytokine signalling (SOCS) family of proteins. Thus SOCS regulates the duration and intensity of the JAK/STAT signalling cascade.Reference Yasukawa, Nagata, Oba and Imaizumi 21 Surprisingly, no study of growth restriction has investigated the impact of being born small on the JAK/STAT signalling pathway in the heart.
An altered cardiac phenotype is observed in rats born small due to uteroplacental insufficiency, with males more affected. The mechanism in part responsible for this phenotype is the reduction in cardiomyocyte number. We hypothesised, based on the role the JAK/STAT signalling cascade in the regulation of cardiomyocyte apoptosis and proliferation, that there will be an altered JAK/STAT signalling pathway in rats born small, and that the deficit will be more severe in male Restricted offspring compared to female Restricted offspring.
Methods
Animals
As described previously,Reference Wadley, McConell and Goodman 7 all experiments were approved by The University of Melbourne Animal Experimentation Sub-Committee. Wistar Kyoto rats (9–13 weeks of age) were obtained from the Australian Resource Centre (Murdoch, Western Australia, Australia) before mating. On day 18 of gestation, pregnant rats underwent bilateral uterine vessel (artery and vein) ligation to induce growth restriction, as previously described,Reference O’Dowd, Kent, Moseley and Wlodek 4 , Reference Wlodek, Mibus and Tan 5 , Reference Wlodek, Westcott and O’Dowd 22 or sham surgery, which was identical except the uterine vessels were not ligated. We have previously reported that pups from uteroplacentally restricted mothers are prenatally and postnatally growth restricted (Restricted) compared with pups from sham-operated mothers (Controls).Reference Wlodek, Westcott, Siebel, Owens and Moritz 3 , Reference Wlodek, Westcott and O’Dowd 22 , Reference Wadley, Siebel and Cooney 23
Developmental timeline
At day 20 of gestation (E20) mothers that underwent either bilateral uterine vessel ligation or sham surgery were anesthetized by intraperitoneal injection of Ketamine (50 mg/kg) and Ilium Xylazil-20 (10 mg/kg) and the uterus was exposed. Fetuses were weighed, separated by sex, killed by decapitation and whole hearts were removed and pooled within litters. Similarly at PN1 and PN7 after birth, offspring were weighed, separated by sex, killed by decapitation and individual whole hearts were collected. At PN35 individual male and female offspring were anesthetized by intraperitoneal injection of Ketamine (50 mg/kg) and Xylazil-20 (10 mg/kg), the chest cavity was opened, and individual whole hearts were collected and weighed. At the time of postmortem all samples collected were frozen in liquid nitrogen and stored at −80°C. For tissue extraction, due to the small mass of the E20 hearts, two whole hearts per sex were pooled from one litter to represent one sample (i.e. n=1). For PN1, PN7 and PN35 each sample (i.e. n=1) represents a single whole heart, each from a separate litter. Hearts were crushed into a powder in liquid nitrogen, and then 20–30 mg was extracted for RNA.
Gene expression
Total RNA was extracted from frozen heart with TRIzol and DNase on-column digestion (Invitrogen, Melbourne, Victoria, Australia) and reverse transcribed as previously described.Reference Wadley and McConell 24 mRNA of each gene was normalized to the absolute cDNA content in each sample that was determined using an OliGreen assay with an oligonucleotide standard (Invitrogen) as previously described.Reference Wadley and McConell 24 Real-time polymerase chain reaction using SYBR Green chemistry was performed as previously described (Rotor-Gene v6, Corbett Research, Sydney, New South Wales, Australia).Reference Wadley, Siebel and Cooney 23 Primer sequences for JAK2,Reference Sun, Li, Yang, Qiu and Rui 25 STAT3,Reference Song, Li, Sun, Yu and Shen 26 STAT5,Reference Sun, Li, Yang, Qiu and Rui 25 SOCS3Reference Song, Li, Sun, Yu and Shen 26 and PI3KReference Song, Li, Sun, Yu and Shen 26 are in Table 1.
Real time PCR primer sequences

PCR, polymerase chain reaction.
Statistical analyses
Results were initially analyzed by a three-way analysis of variance (ANOVA; treatment, sex, and time). Where an interaction existed involving Sex a two-way ANOVA was conducted to determine effects of Treatment and Time within sexes. If no interaction was present, the two-way ANOVA provided the main effect for statistical differences for either Treatment or Time, where a Tukey post-hoc test determined significant differences over time points. If an interaction was present in the two-way ANOVA, the data was split to determine where the difference existed. A Student’s t-test was used to determine the difference between Control and Restricted. A one-way ANOVA with Tukey post-hoc test used to determine significant differences across the time points, E20, PN1, PN7 and PN35. All gene expression data are presented as means±s.e.m. and expressed as arbitrary units. The level of significance was set at P< 0.05.
Results
Expression of JAK2
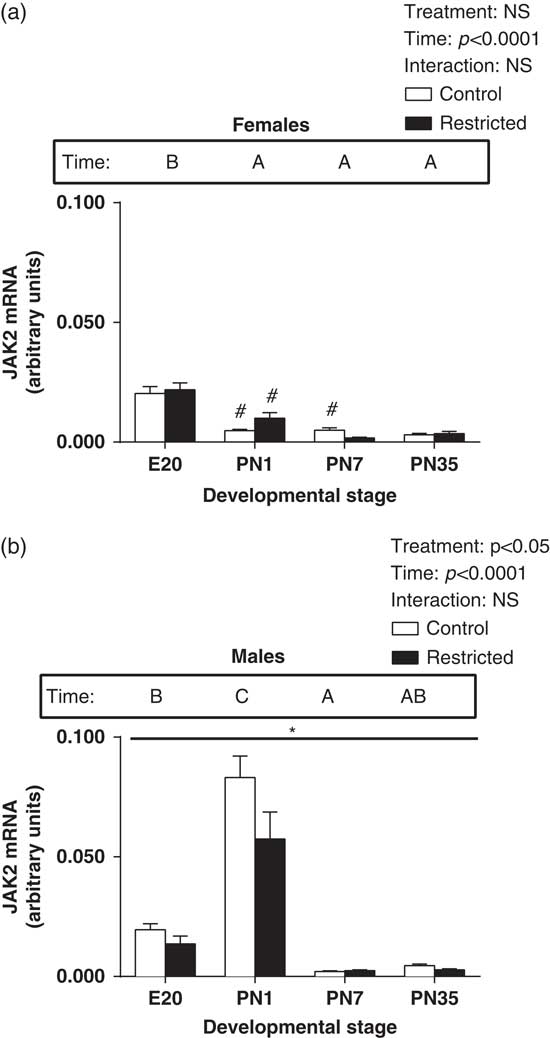
In female hearts, JAK2 expression was significantly increased at E20, with a reduction in levels postnatally (Fig. 1a, main effect for time, P<0.05). JAK2 expression in male hearts was significantly increased at PN1 and a subsequent reduction in expression postnatally (Fig. 1b, effect for time, P<0.05). Growth restriction also had a sex-specific effect in the expression pattern of JAK2 in the heart. In male hearts, JAK2 was significantly reduced in Restricted offspring at all ages (Fig. 1b, effect for treatment, P<0.05). However, in female hearts, there was no effect of restriction on JAK2 expression at any age (Fig. 1a). Also, when comparing males and females, JAK2 levels were lower in Control females than males at PN1 and PN7 and Restricted females at PN1 compared with the comparable males at those time points (Fig. 1a, P<0.05).
Effect of uteroplacental insufficiency during cardiac development on JAK2 gene expression in males and females. Cardiac JAK2 mRNA expression in female (a) and male offspring (b). Data presented as mean±s.e.m., n=5–10 per group. Significant differences (P<0.05, two-way ANOVA) between treatment groups over the developmental stages are indicated by an underlined asterisk (*). Significant differences (P<0.05, two-way ANOVA) between time points are indicated by capital letters that differ (A, B, C, D) in the box labelled time; for example ‘A’ is different from ‘B’, but not different from ‘AB’. *P<0.05 v. Control (Student’s t-test). #P<0.05 compared with male offspring (Student’s t-test). Control offspring denoted by white open bars; Restricted offspring denoted by black closed bars. E, embryonic day; PN, postnatal day.
Expression of STAT3
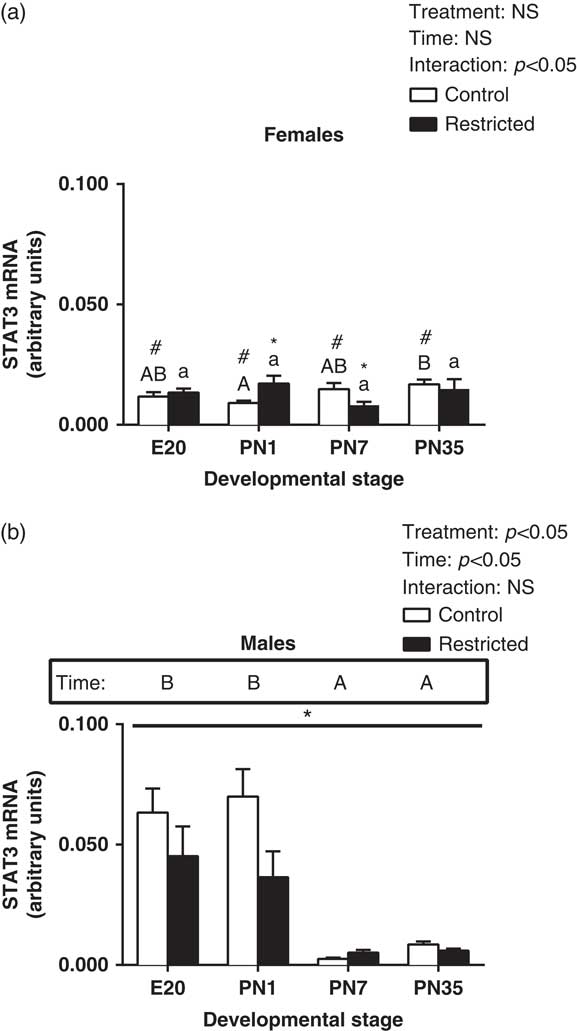
In female hearts, there was a significant interaction, so that at PN1, there was a significant increase in STAT3 expression and at PN7 there was a significant decrease in expression of STAT3 (Fig. 2a, effect for interaction, P<0.05). There was no significant effect for time or restriction in female hearts for STAT3. In male hearts, there was a significant increase in expression of STAT3 at E20 and PN1, followed by a subsequent reduction in expression postnatally (Fig. 2b, effect for time, P<0.05). Further, growth restriction also had a sex-specific effect in the expression pattern of STAT3 in the heart. In male hearts, STAT3 was significantly reduced in Restricted offspring (Fig. 2b, effect for treatment, P<0.05). Further, when comparing males and females, there was a significant reduction in STAT3 levels in Control females at E20, PN1, PN7 and PN35 compared with Control males (Fig. 2a, P<0.05).
Effect of uteroplacental insufficiency during cardiac development on STAT3 gene expression in males and females. Cardiac STAT3 mRNA expression in female (a) and male offspring (b). Data presented as mean±s.e.m., n=5–10 per group. Significant differences (P<0.05, two-way ANOVA) between treatment groups over the developmental stages are indicated by an underlined asterisk (*). Significant differences (P<0.05, two-way ANOVA) between time points are indicated by capital letters that differ (A, B, C, D) in the box labelled time; for example ‘A’ is different from ‘B’, but not different from ‘AB’. Restricted offspring at different time points are indicated by lower case letters (a, b, c, d); for example ‘a’ is different from ‘b’, but not different from ‘ab’. *P<0.05 v. Control (Student’s t-test). #P<0.05 compared with male offspring (Student’s t-test). Control offspring denoted by white open bars; restricted offspring denoted by black closed bars. E, embryonic day; PN, postnatal day.
Expression of STAT5
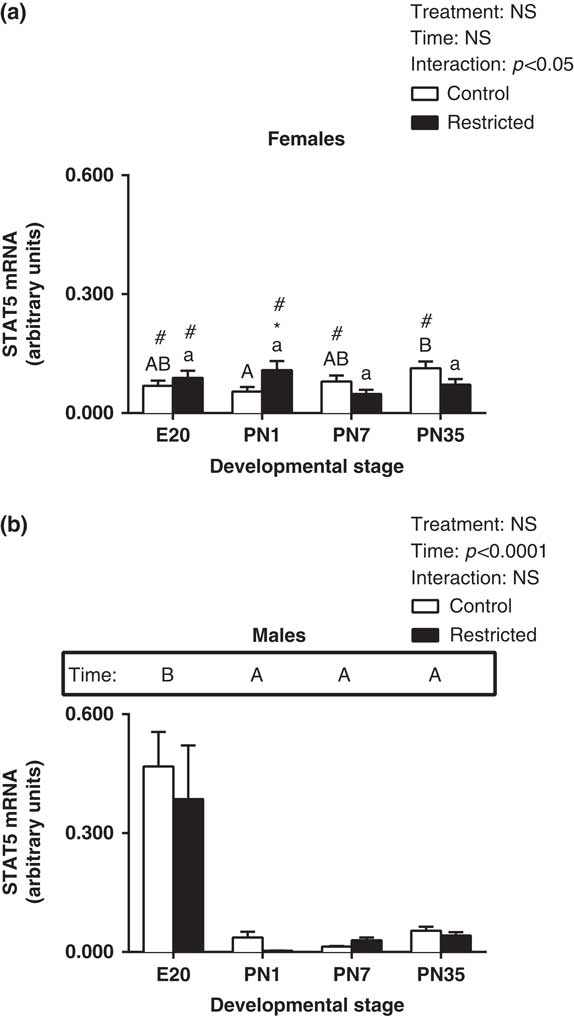
In female hearts, there was a significant interaction, so that at PN1, there was a significant increase in STAT5 expression (Fig. 3a, effect for interaction, P<0.05). There was no significant effect for time or treatment in female hearts for STAT5. In male hearts, STAT5 expression significantly increased at E20, with a subsequent reduction in expression postnatally (Fig. 3b, effect for time, P<0.05). However, growth restriction did not affect expression of STAT5 in male and female hearts (Fig. 3a and 3b). However, when comparing males and females, STAT5 levels in Control females at E20 was significantly lower compared to Control males, however at PN7 and PN35 STAT5 levels were increased in females (Fig. 3a, P<0.05). There was also significantly less STAT5 levels in Restricted females at E20 and an increase in STAT5 at PN1 compared with Restricted males (Fig. 3a, P<0.05).
Effect of uteroplacental insufficiency during cardiac development on STAT5 gene expression in males and females. Cardiac STAT5 mRNA expression in female (a) and male offspring (b). Data presented as mean±s.e.m., n=5–10 per group. Significant differences (P<0.05, two-way ANOVA) between treatment groups over the developmental stages are indicated by an underlined asterisk (*). Significant differences (P<0.05, two-way ANOVA) between time points are indicated by capital letters that differ (A, B, C, D) in the box labelled time; for example ‘A’ is different from ‘B’, but not different from ‘AB’. Restricted offspring at different time points are indicated by lower case letters (a, b, c, d); for example ‘a’ is different from ‘b’, but not different from ‘ab’. *P<0.05 v. Control (Student’s t-test). #P<0.05 compared with male offspring (Student’s t-test). Control offspring denoted by white open bars; restricted offspring denoted by black closed bars. E, embryonic day; PN, postnatal day.
Expression of SOCS3
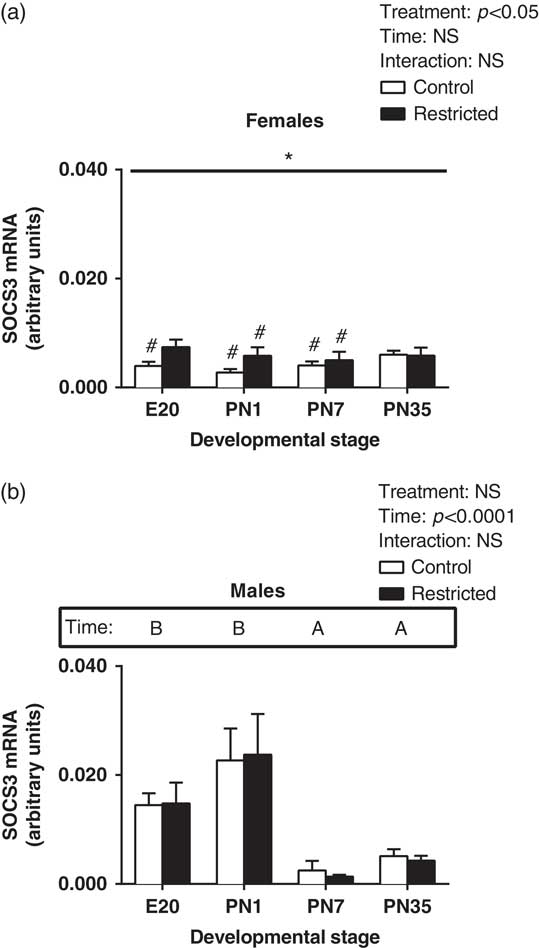
There was a significant increase in SOCS3 expression in Restricted female hearts (Fig. 4a, effect for treatment, P<0.05). There was no significant effect for time in female hearts for SOCS3. In male hearts, there was a significant increase in SOCS3 at E20 and PN1 and a subsequent reduction in expression postnatally (Fig. 4b, effect for time, P<0.05). Further, growth restriction had no effect in the expression pattern of SOCS3 in the male heart (Fig. 4b, effect for time, P<0.05). Further, when comparing males and females, SOCS3 levels in Control females at E20 and PN1 were significantly lower compared to Control males, while at PN7 SOCS3 levels were significantly higher (Fig. 4a, P<0.05). Also there was significantly lower SOCS3 levels in Restricted females at PN1 but an increase in SOCS3 at PN7 compared to Restricted males (Fig. 4a, P<0.05).
Effect of uteroplacental insufficiency during cardiac development on SOCS3 gene expression in males and females. Cardiac SOCS3 mRNA expression in female (a) and male offspring (b). Data presented as mean±s.e.m., n=5–10 per group. Significant differences (P<0.05, two-way ANOVA) between treatment groups over the developmental stages are indicated by an underlined asterisk (*). Significant differences (P<0.05, two-way ANOVA) between time points are indicated by capital letters that differ (A, B, C, D) in the box labelled time; for example ‘A’ is different from ‘B’, but not different from ‘AB’. *P<0.05 v. Control (Student’s t-test). #P<0.05 compared with male offspring (Student’s t-test). Control offspring denoted by white open bars; Restricted offspring denoted by black closed bars. E, embryonic day; PN, postnatal day.
Expression of PI3K
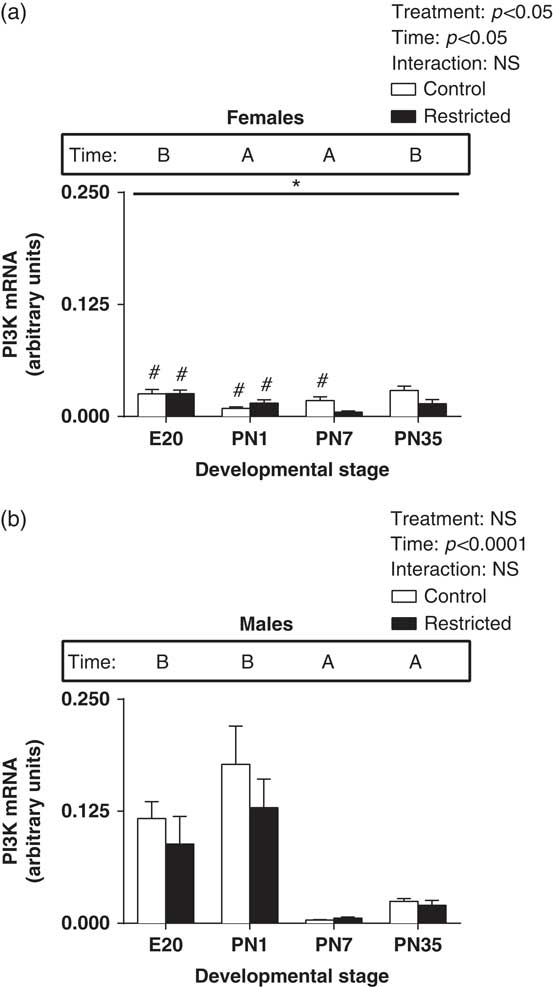
There was a significant decrease in PI3K expression in Restricted female hearts (Fig. 5a, effect for treatment, P<0.05) and a significant effect for time so that expression at E20 and PN35 was higher than PN1 and PN7 (Fig. 5a, effect for time, P<0.05). In male hearts, there was a significant increase in PI3K at E20 and PN1 and a subsequent reduction in expression postnatally (Fig. 5b, effect for time, P<0.05). Further, growth restriction had no effect in the expression pattern of PI3K in the male heart (Fig. 5b). Further, when comparing males and females, PI3K levels in Control females at E20 and PN1 were significantly lower compared with Control males, while at PN7 PI3K levels were higher (Fig. 5a, P<0.05). Also there was significantly lower PI3K levels in Restricted females at E20 and PN1 compared with Restricted males (Fig. 5a, P<0.05).
Effect of uteroplacental insufficiency during cardiac development on PI3K gene expression in males and females. Cardiac PI3K mRNA expression in female (a) and male offspring (b). Data presented as mean±s.e.m., n=5–10 per group. Significant differences (P<0.05, two-way ANOVA) between treatment groups over the developmental stages are indicated by an underlined asterisk (*). Significant differences (P<0.05, two-way ANOVA) between time points are indicated by capital letters that differ (A, B, C, D) in the box labelled time; for example ‘A’ is different from ‘B’, but not different from ‘AB’. *P<0.05 v. Control (Student’s t-test). #P<0.05 compared with male offspring (Student’s t-test). Control offspring denoted by white open bars; restricted offspring denoted by black closed bars. E, embryonic day; PN, postnatal day.
Discussion
The novelty of the current study is that it identifies the impact of uteroplacental insufficiency in the cardiac expression of genes in the JAK/STAT signalling cascade. Previously we have demonstrated an increase in heart mass in the Restricted offspring at PN7,Reference Wadley, McConell and Goodman 7 demonstrating that in the early postnatal period there are alterations in the heart of born small offspring. Here we have extended these findings to demonstrate changes in the JAK/STAT signalling pathway in offspring born small. A major finding of this present study is that in normal rats, the cardiac JAK/STAT gene expression profile in male and female rats is significantly different, so that in general male rats have a peak of expression at E20 and/or PN1, while females for most genes (except JAK2 and PI3K) there are no differences in expression over time. Importantly as well, in growth restricted males, JAK2 and STAT3 were significantly reduced, while in females, SOCS3 was significantly increased and PI3K significantly reduced. This suggests that in part, the altered cardiovascular function in Restricted males may be due to a reduction in gene expression in the JAK/STAT signalling pathway during perinatal life.
Previous research has clearly established the role of JAK2 and STAT3 in the developing heart. In JAK2 knock-out mice, there is a significant delay in cardiomorphogenesis which coincides with embryonic lethality,Reference Parganas, Wang and Stravopodis 27 with analysis of embryonic stem cells demonstrating that JAK2 is essential for cardiomyocyte differentiation.Reference Foshay, Rodriguez, Hoel, Narayan and Gallicano 28 Further, STAT3 is a key activator of transcription of anti-apoptotic genes in the heart,Reference Boengler, Hilfiker-Kleiner, Drexler and Heusch 29 through the reduction of cardiomyocyte hypertrophy.Reference Hilfiker-Kleiner, Hilfiker and Drexler 30 In cardiomyocyte specific STAT3 knockout mice, there is increased interstitial fibrosis, impaired cardiac perfusion and metabolism during stress and increased cardiac apoptosis during exposure to bacterial endotoxin lipopolysaccharide.Reference Hilfiker-Kleiner, Hilfiker and Drexler 30 Thus the reduction in JAK2 and STAT3 is likely to reduce differentiation of cardiomyocytes and increase apoptosis in the heart. Collectively the alterations observed in the males born small suggest that a reduction in JAK2 and STAT3 would potentially be associated with the cardiac deficits associated with the hypertensive phenotype in Restricted males.
In females, an overall increase in SOCS3 mRNA expression was identified in the Restricted offspring. SOCS3 is transcribed due to STAT3 translocating to the nucleus, and is an important feedback inhibitor of the JAK2/STATs pathway.Reference Boengler, Hilfiker-Kleiner, Drexler and Heusch 29 Interestingly, as mRNA expression of STAT3 did not correlate to the change observed in SOCS3 mRNA expression, this indicates that other mechanisms may be mediating these changes in SOCS3. Further the elevated levels of SOCS3 at the age of PN1, indicates that SOCS3 may be attempting to modulate the elevated STAT3 and STAT5 levels. Despite this, the elevated STAT3 and STAT5 in the heart is likely to reduce apoptosis in the heart, which may account for the increase in heart size observed in the restricted females at PN7.Reference Wadley, McConell and Goodman 7 This pathway is likely not to be modulating organ size in the males, as this pattern of gene expression did not occur.
Oestrogen can influence SOCS3 and PI3K expression.Reference Hamilton, Lin, Wang and Knowlton 31 , Reference Knowlton and Lee 32 Specifically SOCS3 mRNA expression is increased in a reduced oestrogen environmentReference Hamilton, Lin, Wang and Knowlton 31 and PI3K mRNA expression is increased due to increased oestrogen.Reference Knowlton and Lee 32 In our model of uteroplacental insufficiency in Restricted females, there is a significantly lower plasma oestrogen concentration compared with Control females at 6 months of age (Wlodek et al. unpublished). Thus if the oestrogen levels at the different developmental time points were lower in the Restricted females, this may modulate the expression of SOCS3 in those animals.
Both STAT3 and STAT5 in females demonstrated an interesting interaction. Basically, at E20 and PN1 there is a decrease in the Restricteds, while there is an increase in the Restricteds at PN7 and PN35. A number of stimuli could be driving this change. Of interest, leptin which can regulate the JAK/STAT pathway peaks at ~PN10.Reference Smith and Waddell 33 Future studies should investigate this link in the uteroplacental insufficiency born small model.
PI3K is an important anti-apoptotic signal through its downstream target, protein kinase B, in the heart. Specifically, JAK2 activates PI3K in the heart, via a number of receptors including the leptin receptor, IGF-1 receptor and insulin receptor.Reference Giani, Gironacci and Munoz 19 Dependant on the specific downstream pathway activated, PI3K can also regulate cell cycle progression, translation as well as transcription regulation, and cell motility.Reference Eisenreich and Rauch 34 In our study, there was an effect of Restriction so that PI3K was reduced in the born small females. However this was not observed in the males, suggesting that in the females, PI3K was acting to protect the heart from altered proliferation or apoptosis. Thus, the specific downstream pathway activated by PI3K in born small offspring warrants further investigation.
The temporal change in mRNA expression of the JAK/STAT genes that control cardiac hypertrophy, proliferation and apoptosis in males is of interest, especially considering the altered differences in the male and female cardiac phenotype in the born small offspring. The highest gene expression in males for all genes investigated (JAK2, STAT3, STAT5 and SOCS3) was during the perinatal period (E20-PN1) compared with the postnatal period (PN7-PN35), and conversely females did not display this variation in mRNA expression. This is a novel finding, with little research on this temporal difference in mRNA expression of the JAK/STAT signalling genes during development. The sexually dimorphic temporal phenotype during the perinatal period (E20-PN1) may be the consequence of gender specific environment in utero,Reference Clifton 35 as evidence suggests that the placenta functions in a sex specific manner.Reference Clifton 35
The JAK2/STATs pathway is activated by many cytokines and growth factors including interleukin-(IL)-3, IL-4, IL-6, prolactin, growth hormone and leptin.Reference Kodama, Fukuda and Pan 36 Growth hormone activated JAK/STAT signalling has been identified as a potential link between growth restriction and short stature in offspring born smallReference Huang, Du, Zhuang, Shen and Li 37 due to growth hormone resistance.Reference de Zegher, Maes and Gargosky 38 , Reference Woodall, Bassett, Gluckman and Breier 39 Growth hormone can activate and stimulate JAK2 in the heartReference Thirone, Carvalho and Saad 40 where it modulates myocardial growth and functionReference Saccà, Cittadini and Fazio 41 via an increase in cardiac myocyte proliferation.Reference Brüela, Christoffersen and Nyengaard 42 In the Restricted rat at PN7 there is an increase in size relative to body mass in both sexes.Reference Wadley, McConell and Goodman 7 Therefore, it is unlikely that growth hormone is regulating the cardiac JAK/STAT pathway in our model as JAK2 in the female heart is unaltered at PN7, despite an increase in the organ size. Thus alternative upstream targets should be identified and investigated.
Interestingly, there are differences in born small humans so that there is an increased risk of left ventricular hypertrophy.Reference Lewandowski, Augustine and Lamata 43 To fully investigate if this also occurs in our rat model, further studies on the older hearts should characterise the levels of JAK/STAT proteins in the different regions of the heart. Further, we acknowledge that future and subsequent analyses using newly generated animals should investigate the protein concentrations of the targets identified by this study, however this is beyond the scope of this current manuscript.
In summary, the expression of genes involved with the JAK/STAT signalling pathway demonstrates a sex-specific pattern of expression. Interestingly, growth restriction results in a reduction in JAK2 and STAT3 genes in males and an increase in SOCS3 in female Restricted offspring. The reduction in JAK2/STAT3 during postnatal cardiac development may be associated with the cardiovascular phenotype (hypertension) observed in growth restricted males. Thus, growth restriction following uteroplacental insufficiency may programme cardiac gene expression of signalling targets essential in the proliferation and apoptosis of cardiomyocytes. These findings may have implications for the risk of cardiovascular disease for offspring born small.
Acknowledgement
This work was supported by a grant from the Heart Foundation of Australia (G06M 2597). The authors thank Ms Jessica Briffa for her careful review of the manuscript.



