


Does newspaper slant simply reflect what readers want to hear? If newspapers are profit-driven, this should be the case: since consumers prefer reading like-minded news, successful newspapers should aim to match political views of readers, rather than the views of owners. Leading research corroborates this view: Gentzkow and Shapiro (Reference Gentzkow and Shapiro2010) find that readers explain far more of the variation in slant across U.S. newspapers than owners, and Gentzkow, Shapiro, and Sinkinson (Reference Gentzkow, Shapiro and Sinkinson2011a) find that explicitly partisan newspapers have little to no effect on voting outcomes. But what if owners are not only ideologically driven, but also possess extreme beliefs? As the largest case study in American history, William Randolph Hearst’s media empire may be the prime example of the importance of both newspaper ownership and ideology in shaping American political discourse, with ramifications for the present day.
Following the 1917 Bolshevik Revolution in the Soviet Union, the subsequent witch-hunt against anyone with suspected communist sympathies in the United States marked a period known as the “Red Scare.” In historical memory, the face of the Red Scare was Senator Joseph McCarthy, who crusaded to rid the U.S. government of “communist infiltrators” in the 1950s. However, 20 years prior to McCarthy’s rise, media mogul William Randolph Hearst may have been the main progenitor of anti-communist discourse. In the 1920s and 30s, Hearst owned the largest media conglomerate in the world, inheriting the San Francisco Examiner from his father and buying an additional 28 newspapers across the United States. A staunch anti-communist who often promoted his own political views with sensationalized headlines, Hearst reached the height of his influence in the mid-1930s, with his newspapers obtaining a circulation of 20 million. As journalist Jim Tuck states, “If Senator Joe McCarthy was the best-known individual representative of the post–World War II heresy hunt, its leading media representative was the Hearst publishing empire” (Tuck Reference Tuck1995, p. i).
Americans’ distaste for socialism, ostensibly due to its link with autocratic regimes historically, has propagated in political debates from the Red Scare era to the present day. Policy proposals advocating for increased public funding for social institutions are often met with strong pushback—from Medicare in the 1960s to the Affordable Care Act in the early 2000s. The United States remains an outlier among wealthy nations with regard to both inequality and policies toward redistribution. While many Western European countries have both universal healthcare and education, public opinion surrounding similar policies in the United States continues to be divisive. No prior research, however, has sought to relate public debate surrounding redistribution to Red Scare politics.
This paper seeks to connect Red Scare propaganda campaigns, specifically anti-communist rhetoric espoused by William Hearst, with both short- and long-run political attitudes toward redistribution. My main results examine the effect of Hearst’s reporting on political support for Franklin Delano Roosevelt (FDR) across presidential elections. In the 1930s, FDR launched the New Deal, the widest-scale federal spending program in U.S. history. The New Deal aimed to facilitate recovery from the Great Depression via financial reforms and regulation, as well as the introduction of social programs to help the unemployed, farmers, children, and the elderly. Notably, FDR created the Social Security Administration in 1935, the large-scale social program that provides retirement benefits to the elderly. With the rise of the Red Scare, FDR was increasingly labeled a socialist by right-wing critics (Schrecker Reference Schrecker2021; Roosevelt Reference Roosevelt, Buhite, Levy and New York1993, p. 51).
As Hearst was known for promoting his own staunch anti-communist views, the political slant of his papers was plausibly exogenous to the populations they served. Moreover, Hearst began his career as a Democrat and only split from the party in the mid-1930s, after he had already acquired all of his newspapers. Consequently, it is unlikely that the locations where he chose to purchase papers had any correlation with prior anti-communist or anti-redistributive political sentiments. Notably, Hearst actually supported FDR in the 1932 presidential election, only becoming vehemently anti-communist and anti-FDR in the mid-1930s. Therefore, I consider FDR vote share in the 1932 election to be prior to treatment, allowing me to examine the change in vote shares across elections.
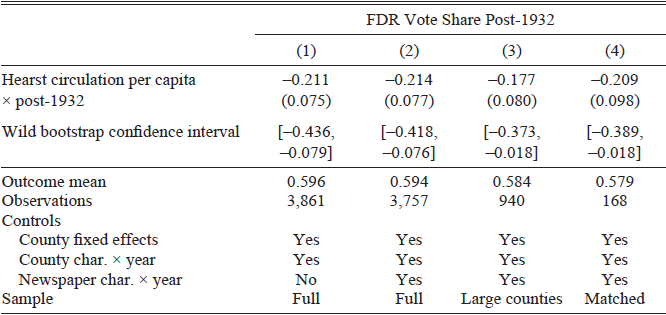
Exploiting Hearst’s sharp change in political attitudes in the mid-1930s in a difference-in-difference design, I find that an increase of 10 percentage points in Hearst circulation per capita decreased support for FDR by 2.14 percentage points (s.e.=0.77), a 3.6 percent decrease. Since Hearst’s papers were primarily located in large cities, across various specifications, I exclude areas without local papers and rural areas from the control group, as well as control for detailed county characteristics interacted with the year. I show that results are robust to controlling for non-Hearst newspaper readership, as well as the presence of other politically affiliated newspapers in a county. Moreover, I show that the results hold under various alternative specifications. This includes using a propensity-score matched control group, matching on detailed county characteristics, as well as employing the approach proposed by Callaway and Sant’Anna (Reference Callaway and Sant’Anna2021), which avoids potential issues with negative weights in standard difference-in-differences analyses (Borusyak, Jaravel, and Spiess Reference Borusyak, Jaravel and Spiess2024; Chaisemartin and D’Haultfoeuille Reference Chaisemartin and D’Haultfoeuille2020).
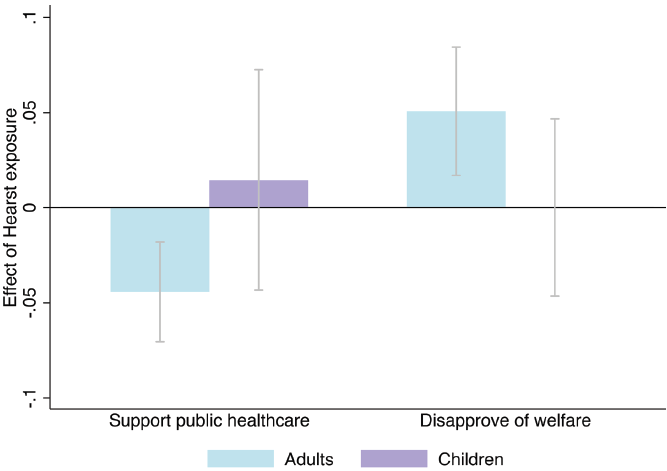
Beyond historical election results, I also examine the persistence of anti-socialist views through the end of the twentieth century using data on public opinion from the American National Election Studies (ANES) (2020). Tracking Hearst newspaper entry and exit, I compare respondents in the same county who were directly exposed to Hearst’s reporting as adults, those who were children but grew up in a Hearst county, and those who were unexposed to Hearst. Aggregating survey responses between 1970 and 1994, I find that those directly exposed to Hearst as adults continue to harbor more anti-redistributive beliefs: they are more opposed to a public healthcare system and feel more negatively about welfare programs. These results are robust to controlling for a wide array of respondent characteristics, including flexible age and cohort controls, as well as limiting the sample to those old enough to be exposed to Hearst. However, children who grew up in a Hearst county do not share these beliefs, suggesting that anti-redistributive attitudes were not passed down from parents to children.
This study contributes to several strands of literature. First, this paper is not the first to study the effect of Hearst’s reporting; Listokin and Snyder (Reference Listokin and Snyder2010) also study the effects of the Hearst media empire on voting outcomes. However, they study an earlier period, 1880–1938, the majority of which Hearst identified as a Democrat. Exploiting the entry of a Hearst newspaper into a given county, the authors find a clear null effect on overall voting behavior, results that are consistent with Hearst’s fraught relationship with the Democratic Party throughout this period. Though Hearst nominally remained a Democrat until the mid-1930s, he increasingly found himself at odds with the Democratic establishment and eventually sharply diverged to the right (Nasaw Reference Nasaw2000). In contrast, I study the effects of the Hearst media empire from the 1930s onward, when Hearst became increasingly radicalized, right-wing, and consistent in his opposition to the Democratic Party.
Second, this study contributes to an emerging literature on the effect of media persuasion on public opinion (Adena et al. Reference Adena, Enikolopov, Petrova, Santarosa and Zhuravskaya2015; DellaVigna and Kaplan Reference DellaVigna and Kaplan2007; Enikolopov, Petrova, and Zhuravskaya Reference Enikolopov, Petrova and Zhuravskaya2011). Prior studies have shown that media personalities espousing strong political views can influence voting behavior (Wang Reference Wang2021), and that even subtle changes in language used in newspaper reporting havepolitical ramifications (Djourelova Reference Djourelova2023).
Moreover, this study weighs in on how ownership may shape media slant. Gentzkow and Shapiro (2011a) conceive of newspapers as a market in which both preferences of readers and owners may influence political bias in newspaper reporting. Using a model of newspaper demand, they argue that slant is actually primarily driven by consumers, who prefer like-minded news. Hearst’s newspapers actually offer a counterexample to this framework: historians assert that Hearst’s papers printed his own, often controversial political views, even leading to a decline in circulation as Hearst veered sharply to the right (Nasaw Reference Nasaw2000). Thus, this paper provides some initial evidence that ideology, in addition to profit, may drive media supply.
Finally, this paper contributes to the literature on what drives preferences toward redistribution. Previous literature has considered explanations such as belief in equal opportunity and fairness of social competition (Alesina and La Ferrara Reference Alesina and La Ferrara2005; Alesina and Angeletos Reference Alesina and Angeletos2005), racial discordance between the rich and poor (Alesina, Glaeser, and Sacerdote Reference Alesina, Glaeser and Sacerdote2001), personal history of hardship, and historical circumstances (Alesina and Giuliano Reference Alesina, Giuliano, Benhabib, Bisin and Matthew2011; Bazzi, Fiszbein, and Gebresilasse Reference Bazzi, Fiszbein and Gebresilasse2020). The paper provides additional evidence that exposure to specific historical events may have long-run effects on political attitudes.
HISTORICAL BACKGROUND
The Red Scare, the Depression, and FDR
In 1917, the Bolsheviks overthrew the Russian monarchy, establishing a socialist government in its place. In turn, the success of the Bolsheviks spurred a wave of other communist revolutions throughout Europe and beyond. As international politics surrounding the threat of communist overthrow intensified, American politicians warned the public that there could be a communist plot within the United States itself. These fears sparked a domestic witch-hunt against anyone with supposed communist or socialist sympathies, including those more broadly on the economic left. This period in U.S. history is famously referred to as the “Red Scare,” with red signifying allegiance to the Soviet flag.
While American capitalism boomed during the 1920s, the stock market crash in 1929 marked the start of the Great Depression. Unemployment levels reached a peak of nearly 25 percent in 1933 (Bureau of Labor Statistics 2025). Franklin Delano Roosevelt, then the governor of New York, won the Democratic Party nomination in 1932, pledging to bring America out of the Depression. Bringing small farmers, Southern whites, northern Blacks, Catholics, Jews, labor unions, and intellectuals into his coalition, FDR won the presidential election in 1932 by a landslide, with 57 percent of the popular vote (CQ Press 2015, p. 529).
In his first days in office, FDR began a series of federal policies and programs that became known as the New Deal, aimed at combating the Depression. Early initiatives included monetary policy and banking reform. Roosevelt also established organizations to improve public infrastructure and employ the unemployed, including the Public Works Administration and the Civilian Conservation Corps. Other legislation provided relief for farmers and support for homeownership.
Programs enacted in 1935 and later were dubbed the “Second New Deal,” as they were both more liberal and met with stronger pushback. Notably, with the passage of the Social Security Act in 1935, Roosevelt established the first widespread social safety net program for the elderly, the unemployed, and families with single mothers. The National Labor Relations Act, also passed in 1935, gave workers the right to collective bargaining. Concurrently, FDR increased both individual and corporate tax rates to raise revenue for these projects. These later policies attracted criticism from both the business community and right-wing politicians, with some labeling the New Deal as state-sponsored socialism (Schrecker Reference Schrecker2021; Roosevelt Reference Roosevelt, Buhite, Levy and New York1993, p. 51).
Newspapers in the Early Twentieth Century
Before both the advent of television and widespread popularity of radio, newspapers were the most important source of information on politics and current events. By 1932, there were nearly 2,000 daily newspapers, encompassing over 1,000 U.S. counties. Combined, these papers had a total circulation of nearly 38 million (Gentzkow, Shapiro, and Sinkinson Reference Gentzkow, Shapiro and Sinkinson2011a). Newspapers were often highly partisan, both declaring explicit party affiliations and endorsing political candidates during elections. Moreover, newspaper distribution was highly local; news hawkers or delivery boys distributed papers within a given city, usually either by selling individual copies on downtown streets or delivering newspapers to subscribers’ front porches. As newspaper readership grew, papers were increasingly acquired by large chains—the largest and most famous being the Hearst media empire. Concurrently, newspapers faced rising competition from radio, with around 80 percent of American households having a radio in their homes by 1940 (Treisman Reference Treisman2025).
William Randolph Hearst
Two decades before Senator Joseph McCarthy became the face of America’s anti-communist crusade, media mogul William Randolph Hearst captured readers across the United States with his so-called “yellow journalism,” characterized by sensationalized, exaggerated reporting. Hearst was born in San Francisco in 1863 to millionaire mining engineer George Hearst, who passed down ownership of the San Francisco Examiner to his son in 1887. With plans to create a large newspaper chain, by the mid-1920s, Hearst had purchased a string of 28 newspapers across the country, including the Los Angeles Examiner, the Boston American, the Atlanta Georgian, the Chicago Examiner, and the Detroit Times. At its peak, readership of the Hearst papers reached 20 million (Nasaw Reference Nasaw2000, p. xiv).
Hearst began his political career as a Democrat, serving as a member of the U.S. House of Representatives from 1903 to 1907. He was originally a champion of the working class, continuing to support FDR through the 1932 election. However, as the Red Scare re-entered political discourse, Hearst became increasingly conservative and turned against FDR’s later New Deal policies, splitting from the party in the mid-1930s (Nasaw Reference Nasaw2000; Schrecker Reference Schrecker2021).
Hearst exerted tight control over his papers, printing his own political opinions and dictating the way news should be presented. As historian David Nasaw writes in his biography of Hearst, “The Hearst newspapers had always spoken with one voice, Hearst’s” (Nasaw Reference Nasaw2000, p. 484). Hearst often used bombastic, alarmist rhetoric. In particular, he made connections between the Soviet Union, labor unrest in the United States, and New Deal policies, accusing FDR of being a communist. Hearst continued his anti-communist vitriol and attacks against FDR despite declining profits—with his newspaper circulation declining by 8 to 10 percent in major cities between 1933 and 1937 (Nasaw Reference Nasaw2000, p. 426).
Figure 1 displays a San Francisco Examiner headline from 1936 which directly implicates FDR with the “Alien Reds.” Similarly, Online Appendix Figure A1 displays other illustrative Hearst newspaper clippings. In addition to calling FDR a communist, Hearst painted the New Deal as both an attack on the American system of government and a recipe for federal waste. His newspapers reported that the New Deal was a result of “flirtation with alien ideas” and that its supporters wanted “to terminate the American system, and subtly put some totalitarian substitute in its place” (Pittsburgh Sun-Telegraph, 23 August 1939; Pittsburgh Sun-Telegraph, 22 September 1944). On an economic front, Hearst argued that the New Deal would increase debt and taxation while exacerbating poverty, and that FDR’s policies had led only to “waste, extravagance, and squandering” (Pittsburgh Sun-Telegraph, 23 August 1939; San Francisco Examiner, 2 November 1936).
ARTICLE FROM THE SAN FRANCISCO EXAMINER, 9 OCTOBER 1936
Sources: Schrecker (Reference Schrecker2021), PBS.

In 1943, Hearst stepped down as president of the Hearst Corporation, his newspaper conglomerate. Nevertheless, his legacy continued to flourish. With rising Cold War tensions, Hearst’s denunciations seemed increasingly credible. His successor as head of the Hearst Corporation, Richard Berlin, unabashedly continued Hearst’s red-baiting practices. Soon, the much younger McCarthy would enter the scene, announcing that he possessed a list of communists in the State Department (Schrecker Reference Schrecker2021; Tuck Reference Tuck1995). The Hearst papers not only championed McCarthy’s cause, but volunteered to disclose their own files on supposed Communist sympathizers to McCarthy’s staff (Nasaw Reference Nasaw2000).
DATA
Newspaper Data
To determine which newspapers were owned by William Randolph Hearst in the 1930s, I use the Library of Congress (2011) U.S. Newspaper Directory. Derived from data collected during the United States Newspaper Program (1982–2011), a national effort to catalog historical papers, the directory contains detailed descriptions of historical papers, including ownership. I search the directory with the keyword “Hearst” and date range 1900–1950. I then check all search results by hand, confirming Hearst ownership with a secondary online source. Additionally, I note dates that a given newspaper was bought, sold, and/or ceased publication. In total, I identify all 28 daily papers owned and operated by William Randolph Hearst in 1932. These newspapers were located in 22 unique U.S. counties.Footnote 1
Broader data on daily newspapers comes from Reference Gentzkow, Shapiro and SinkinsonGentzkow, Shapiro, and Sinkinson (2011b). This dataset contains information on every daily newspaper across U.S. cities starting from 1869. Relevant to this study, data from 1932 and onward come from the Editor and Publisher Yearbook, a monthly trade magazine covering the newspaper industry. Gentzkow and coauthors collect information on individual papers by county, including circulation, political affiliation, and presidential candidate endorsements. I link my hand-coded dataset on Hearst’s papers to this larger newspaper panel by matching on newspaper title and city, with a 100 percent match rate.
Lastly, to explore newspaper text data directly, I locate Hearst and relevant control newspapers available in either Newspapers.com or NewspaperArchive.com, the two sources with the largest historical coverage (Beach and Hanlon 2022). While coverage of the Hearst papers is incomplete, I locate 6 Hearst newspapers and 18 newspapers in propensity-score matched counties available within these databases during the 1930s and 40s. To capture Hearst’s growing focus on anti-communism directly within news coverage, I scrape the count of total mentions of the word “communist” for each newspaper year using the Optical Character Recognition (OCR) software within these databases. To approximate coverage during these years, I compare these mentions to mentions of a neutral word, as suggested by Beach and Hanlon (2022).
Public Opinion and County Characteristics
To analyze public opinion toward redistributive policy, I use both voting data and survey data on public opinion. My primary dependent variable for the baseline results is support for FDR. Following Wang (Reference Wang2021), I use Clubb, Flanigan, and Zingale’s (Reference Clubb, Flanigan and Zingale1987) data on electoral elections to determine vote shares for FDR by county in the 1932–1944 elections. Additionally, to assess balance in the pre-period, I collect county-level vote shares for the Democratic Party between 1912 and 1928. I match these data to the Newspaper Panel by FIPS county code. As additional control variables, I collect 1930 county demographic information from Haines and ICPSR (2010), which collapses decennial census data to the county level.
An alternative way to assess balance would be to look at public opinion surveys in treated and control counties in the years prior to Hearst’s switch in political ideology. Unfortunately, the first U.S. public opinion poll, conducted by Gallup, was not administered until 1935. Thus, I rely on both prior vote shares and demographic characteristics to construct a valid control group.
For longer-run data on public opinion, I use the American National Election Studies (ANES) Survey, a nationally representative survey on public opinion first conducted in 1948. Published every two to four years, the survey interviews respondents about their attitudes toward elected officials as well as pressing political topics of the day. As individual surveys have only around 1,000 respondents, I focus on questions asked across a wide range of years. The survey contains county information for each respondent, as well as respondent demographics such as race, age, education, and economic status. Additionally, starting in 1968, the survey began asking respondents how long they have lived in a given county, allowing me to track whether respondents were directly exposed to Hearst.
SAMPLE CONSTRUCTION
What Predicts Hearst Owning a Newspaper in a Given County?
One relevant concern for the empirical design is why Hearst decided to purchase papers in particular counties. As noted by Gentzkow, Shapiro, and Sinkinson (Reference Gentzkow, Shapiro and Sinkinson2011a), newspaper slant is both supply and demand driven; slant could merely reflect what readers want to hear. The idea that slant is demand driven is less concerning in this case study: historical accounts repeatedly emphasize that Hearst’s papers reflected his own, often controversial political views, even resulting in a decline in circulation among his working class, pro-labor readers as he became increasingly right wing (Nasaw Reference Nasaw2000, pp. 9, 426, 458). Moreover, as Hearst’s political views sharply changed over the 1930s, some years after he had acquired all of his papers, the location of Hearst’s papers are unlikely to be correlated with prior attitudes toward communism or redistribution.
Nevertheless, even if slant is driven by owners, rather than readers, Hearst counties may look fundamentally different from non-Hearst counties. Hearst purchased papers for both business and political motives, seeking to create a newspaper empire and increase his prominence in the Democratic Party in the early twentieth century. Starting with his home city of San Francisco, this primarily brought him to the biggest cities in the country, starting with New York (1895), Chicago (1900), and Los Angeles (1903). In Online Appendix Figure A2, I more closely examine what characteristics predict Hearst operating in a certain county in 1932 by running the following bivariate regressions:

where 1[Hearsti] is an indicator for Hearst operating in county i in 1932 and Xi is a standardized county characteristic. I find that Hearst counties have the largest population sizes, have the highest land values, and are the most urban. These results are consistent with Hearst seeking out the biggest, richest cities to increase his power and influence. Importantly, Hearst’s presence in a county is entirely uncorrelated with FDR vote share in 1932, with a coefficient of –0.00003 (0.0003).
Although Hearst ownership is unrelated to political attitudes in the pre-period, there is still concern that Hearst counties, which are densely populated and highly urban, are likely to be on different time trends than smaller, rural counties. To account for this concern, I control for detailed county characteristics interacted with year fixed effects, as well as construct various versions of the control group that become increasingly similar to Hearst counties.
Constructing a Comparable Control Group
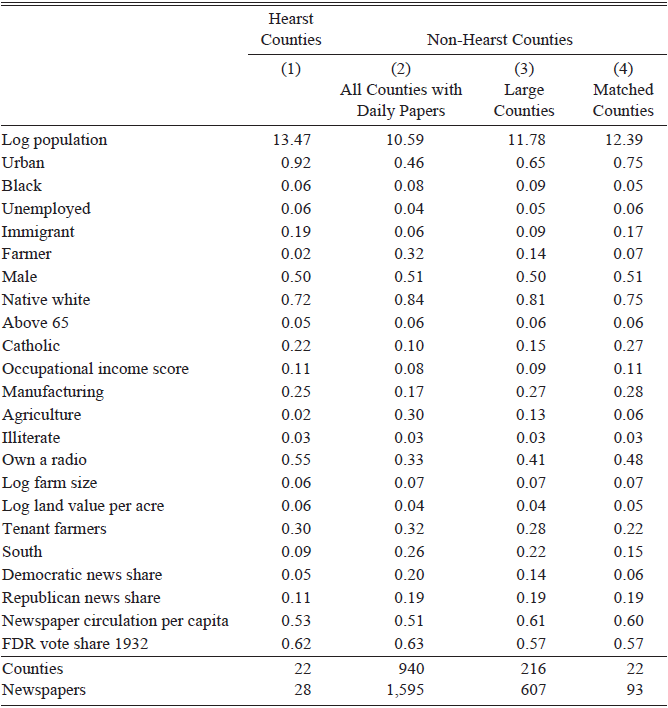
I start with a sample of all U.S. counties that had at least one daily paper in 1932.Footnote 2 Although newspaper circulation during this time was locally concentrated, there is some concern that nearby counties were partially treated. For example, those in a nearby county could have travelled to the city center to purchase a paper from a newspaper stand. Thus, in the baseline analysis, I exclude 55 contiguous border counties from the control group.Footnote 3 Table 1 compares 1930 demographic characteristics of Hearst vs. non-Hearst counties. Echoing results from Online Appendix Figure A2, Hearst counties were highly urban, large, and had a higher share of immigrants than other counties.
POPULATION CHARACTERISTICS FOR HEARST AND NON-HEARST COUNTIES

Table 1 Long description
The table compares population characteristics of Hearst and non-Hearst counties. It has 22 rows and 4 columns. The columns are labeled as Hearst Counties, Non-Hearst Counties (All Counties with Daily Papers), Non-Hearst Counties (Large Counties), and Non-Hearst Counties (Matched Counties). The rows include various demographic characteristics such as Log population, Urban, Black, Unemployed, Immigrant, Farmer, Male, Native white, Above 65, Catholic, Occupational income score, Manufacturing, Agriculture, Illiterate, Own a radio, Log farm size, Log land value per acre, Tenant farmers, South, Democratic news share, Republican news share, Newspaper circulation per capita, FDR vote share 1932, Counties, and Newspapers. Each row lists values for the respective characteristics across the different county categories.
Notes: This table compares sample characteristics for Hearst versus non-Hearst counties. Column (1) shows sample means for Hearst counties, Column (2) shows sample means for all non-Hearst counties with daily papers, Column (3) shows sample means for non-Hearst counties with daily papers where the total population is above the 75th percentile, and Column (4) shows means for the propensity-score matched sample. In Column (1), “Newspapers” is a count of newspapers owned by Hearst (although there are also non-Hearst papers in those counties). In Column (4), I list unique counts of newspapers and counties, but matching is done with replacement. Democratic and Republican news shares do not sum to 1, as many newspapers were either politically unaffiliated or listed their political affiliation as Independent.
Sources: Original data come from Haines and ICPSR (2010) and Reference Gentzkow, Shapiro and SinkinsonGentzkow, Shapiro, and Sinkinson (2011b).
Thus, to ensure differences in county characteristics are not driving the results, I control for a detailed array of county characteristics interacted with year. In particular, since Hearst counties are particularly large, I flexibly control for log total population interacted with year (using ventile indicators for county size). Additionally, I include the following demographic characteristics: log population located in cities, percent urban, percent Black, percent immigrant, percent farmers, percent illiterate (above the age of 10), percent unemployed, retail sales per capita, log land value per acre, share of farmland with tenant farmers, and whether the county is located in the South.Footnote 4 I include this set of control variables as demographic characteristics, such as the percent of Black individuals and immigrants, are highly predictive of voting outcomes. Additionally, some of these controls, particularly economic variables such as the share of unemployed, are predictive of attitudes toward the Depression and New Deal policies. On the whole, this set of control variables will allow for pre-period balance in the event study design.
Demographic × year controls may be particularly relevant given the political context. The positions of the Democratic Party underwent major changes between the late nineteenth to mid-twentieth century, with the party initially opposing the abolition of slavery and often promoting laissez-faire capitalism. According to historians and political scientists, the party went through a major re-alignment in the 1928 presidential election when Democrats nominated progressive candidate Al Smith (Clubb and Allen Reference Clubb and Allen1969). Al Smith was a liberal who promoted policies such as workers’ rights and racial equality, bringing Blacks, urban blue-collar workers, and immigrants into his coalition–voting blocks that would form the basis of support for FDR and the New Deal. Thus, county characteristic × year controls in this setting allow different demographic groups to have election-specific effects, accounting for any demographic-based realignment in response to the New Deal.
Moreover, radio became an increasingly popular source of political coverage in the 1930s. Thus, to adjust for potential differences in exposure to radio, in my analyses, I add controls for the percent of individuals who own a radio in their household, as well as exposure to Father Coughlin, a prominent right-wing radio host in the 1930s and 40s (Wang Reference Wang2021).
In addition to employing detailed county controls, I confirm that results hold using alternative versions of the control group that more closely resemble Hearst counties. First, since Hearst’s papers were located in large cities, in Column (3) of Table 1, I restrict the sample to counties where the total population is above the 75th percentile of counties. Moreover, to more closely replicate characteristics of Hearst counties, I also show results using a propensity-score matched sample, matching on all characteristics in Table 1. Because of the large number of control counties compared to Hearst counties, I match the 20 nearest neighbors (with replacement) to a given Hearst county. In Column (4) of Table 1, I show that the matched sample more closely resembles the treated sample across baseline characteristics. In Figure 2, I show a visual map of treated and control counties for both the sample of large counties and the propensity-score matched sample. For newspaper text analyses, to lessen the computational intensity of the data mining procedure, I focus on text data from newspapers in propensity-score matched counties.
MAP OF HEARST AND CONTROL COUNTIES
Notes: This figure shows treatment and control counties used for the difference-in-difference analysis. The counties in dark blue are treated Hearst counties, while the counties in light blue are control counties. Panel A shows control counties for the sample of large counties. Panel B shows control counties for the propensity-score matched sample. Matching is done with replacement, so a control county may be matched to several treated counties.
Sources: Original data come from Clubb, Flanigan, and Zingale (Reference Clubb, Flanigan and Zingale1987), Haines and ICPSR (2010), and Reference Gentzkow, Shapiro and SinkinsonGentzkow, Shapiro, and Sinkinson (2011b).

Finally, in the Online Appendix, I also construct a synthetic control for Hearst counties using the method proposed by Abadie and Gardeazabal (Reference Abadie and Gardeazabal2003). In this approach, I select counties based on the trend in Democratic vote share in the pre-period, with the algorithm minimizing the distance between Democratic vote share across time in each Hearst county compared to a weighted average of control counties. In Online Appendix Figure A5, I show that the synthetic control nearly exactly matches the trend in Democratic vote share of Hearst counties prior to 1936.
DOCUMENTING THE SHIFT IN HEARST NEWSPAPER REPORTING
Did Hearst’s Political Views Affect Newspaper Endorsements?
To validate the historical narrative regarding Hearst’s changing political allegiances and to demonstrate that these views were replicated in his papers, I use Reference Gentzkow, Shapiro and SinkinsonGentzkow, Shapiro, and Sinkinson (2011b) data on which candidate a given paper endorsed for all presidential years between 1932 and 1968. I define a Hearst paper as any paper owned and operated by William Randolph Hearst in 1932. My endorsement measure, Ent, takes a value of 1 if the newspaper endorsed a Republican candidate in that election year, 0 if it endorsed an independent, and –1 if it endorsed a Democrat.Footnote 5
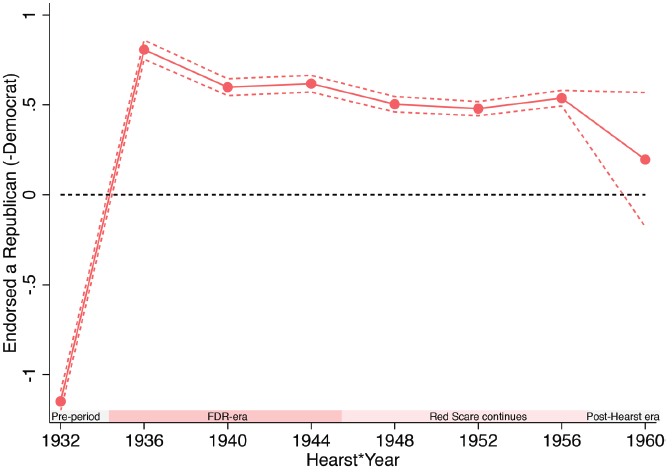
In the raw data, I find that all Hearst papers that reported a party endorsement in 1932 endorsed FDR, consistent with the historical record. Moreover, in every election from 1936–1956, all papers operated by the Hearst Corporation endorsed Republican presidential candidates. Finally, historians generally consider the death of Senator McCarthy in 1957 as marking the end of the Red Scare (Sabin Reference Sabin1999, p. 5). Newspapers formerly tightly controlled by Hearst became much less consistently right wing in these later years, endorsing candidates from all parts of the political spectrum.
To formally test whether Hearst papers exhibited stronger political biases than other newspapers at the time, I run the following specification to examine the effect of Hearst ownership on party endorsement:

where n indicates newspaper, t indicates election year, Hearstnt is an indicator for being a Hearst paper in year τ, and αt are year fixed effects. To improve power, I bin the endpoint year to include newspaper endorsements from 1960, 1964, and 1968.Footnote 6 All standard errors are clustered at the newspaper level.
In Figure 3, I show that Hearst newspapers were much more likely than other newspapers to endorse FDR, the Democrat, in 1932; however, in all years between 1936–1956, Hearst papers were far more likely to endorse a Republican. These results confirm that Hearst exhibited a sharp change in political attitudes in the mid 1930s and that his own political views were reflected in the slant of his papers. Finally, in the years 1960 and onward, following both Hearst’s death and the end of the Red Scare, these same papers were neither more nor less likely to endorse Republican political candidates. This null effect confirms that treatment was confined to a historically distinct period.
EFFECT OF HEARST OWNERSHIP ON PRESIDENTIAL PARTY ENDORSEMENT
Notes: This figure shows the effect of a newspaper being owned by Hearst on the likelihood of that paper endorsing a Republican (or Democratic) candidate for president. 1 indicates endorsing the Republican, 0 endorsing an Independent, and –1 endorsing a Democrat. Dots show coefficients on Hearst × year interactions, and dashed lines show 95 percent confidence intervals. The endpoint is binned to include years 1960, 1964, and 1968. I control for election year, and standard errors are clustered at the newspaper level.
Sources: Original data come from Reference Gentzkow, Shapiro and SinkinsonGentzkow, Shapiro, and Sinkinson (2011b).

Did Hearst’s Anti-communism Affect Newspaper Reporting?
While the prior section demonstrates that Hearst’s papers were much less likely to endorse a Democrat after his political views veered to the right, how much did anti-communist sentiment actually affect reporting? To analyze the content of Hearst papers directly, I use newspaper text data and OCR software within Newspapers.com and NewspaperArchive.com, the two sources with the largest historical coverage (Beach and Hanlon 2022). While coverage of the Hearst papers is incomplete, I locate 6 Hearst newspapers (The San Francisco Examiner, The Oakland Post Enquirer, Pittsburgh Sun-Telegraph, Washington Times, Washington Herald, and San Antonio Light) and 18 newspapers in propensity-score matched counties available within these databases during the 1930s and 40s.Footnote 7
To capture Hearst’s growing focus on anti-communism directly within news coverage, I scrape the count of total mentions of the word “communist” for each newspaper-year.Footnote 8 In all analyses, I include newspaper fixed effects to control for the average length and content of a specific newspaper. Moreover, as some newspapers might not have full coverage within these directories for a particular year, I compare the number of mentions of “communist” to mentions of a neutral word, either Monday or rain, as suggested by Beach and Hanlon (2022). Let  for a given newspaper-year. The mean number of communist mentions per year in a given newspaper is 493, compared to 5,424 mentions of Monday.
I run the following regression to assess newspaper content related to communism:

where n indicates newspaper, t indicates election year, Hearstnt is an indicator for being a Hearst paper in year τ, αt are year fixed effects, and ζn are newspaper fixed effects. For ease of interpretation, I scale Nnt by the mean so that regression coefficients can be interpreted as the percent increase in communist mentions relative to the sample average.
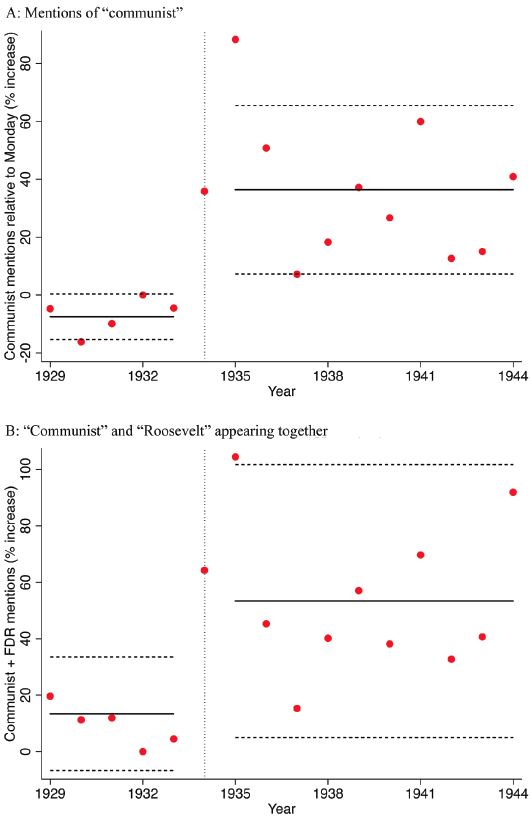
In Figure 4 Panel A, I show estimates of each  , as well as a pooled estimate where I replace yearly indicators with indicators for Hearst × pre-1934 and Hearst × post-1934.Footnote 9 The reference year is 1932. I find that Hearst ownership had no effect on mentions of “communist” prior to 1934, with an average coefficient of –7.5 percent (s.e.=4.0 percent). In contrast, in the post-period, Hearst ownership predicts a 36.4 percent (s.e.= 14.8 percent) increase in communist mentions. In Online Appendix Figure A3, I show estimates of
 when I replace the word “Monday” with another neutral word, “rain.” The results are very similar.
EFFECT OF HEARST OWNERSHIP ON MENTIONS OF “COMMUNIST”
Notes: Panel A shows the effect of Hearst ownership on newspaper mentions of the word “communist” each year relative to “Monday” (a neutral word). The dependent variable is the word count ratio between communist and Monday for that year. Panel B shows the effect of Hearst ownership on joint mentions of “communist” and “Roosevelt” (relative to joint mentions of “Monday” and “rain”). In both panels, I divide the dependent variable by the sample mean so that coefficients represent the percent increase in mentions. Red dots show yearly point estimates, and the black lines show the average effect between 1929 and 1933 (the pre-period) and 1935 and 1944 (the post-period). The reference year is 1932. Dotted lines show 95 percent confidence intervals for the mean pre- and post-period effects.
Sources: This content analysis is based on original newspaper content, available on either Newspapers.com or NewspaperArchive.com.

Next, were Hearst newspapers even more anti-communist than other Republican newspapers of the time? To address this question, I categorize control newspapers as having either a Republican political affiliation (7 papers) or a Democratic or Independent political affiliation (11 papers). I then rerun the content analysis for each group of control newspapers. Results are shown in Online Appendix Figure A4. I find some evidence of effect heterogeneity: Hearst papers were far more likely to contain the word “communist” after 1934 than non-Republican papers. However, Hearst papers were also more likely to mention the word “communist” than other Republican papers, corroborating the historical evidence that Hearst papers were particularly anti-communist.
Lastly, did Hearst explicitly link communism with FDR? In Figure 1, I show anecdotal evidence from an issue of The San Francisco Examiner, which declares, “Neither is the shameful act to be denied that COMMUNISTS are supporting Franklin D. Roosevelt for re-election in 1936.” In Figure 4 Panel B, I test this more systematically by exploring how often the words “Roosevelt” and “communist” appear together on the same page.Footnote 10 To adjust for both newspaper coverage in that year as well the likelihood that two words randomly appear together on the same page, I normalize joint mentions of “Roosevelt” and “communist” by joint mentions of “Monday” and “rain.” Then, I rerun Equation (3), redefining  . I again find that Hearst ownership had no effect in the pre-period, with a coefficient of 13.4 percent (s.e.=10.3 percent). However, as Hearst turned against FDR, he increasingly implicated him with communism: after 1935, Hearst ownership increased the probability of “Hearst” and “Roosevelt” being mentioned together by 53.4 percent (s.e.=24.7 percent).
Although coverage of the Hearst papers is incomplete within these archives, the previous analysis provides suggestive evidence that the Hearst papers disproportionately reported on communism compared to other newspapers in the same year, as well as disproportionately implicated FDR in communism. On the whole, the prior two sections demonstrate that (1) Hearst papers were much more likely to endorse a Republican after 1936 and (2) reporting on communism sharply increased concurrently with this change in endorsements. This evidence supports the historical narrative that Hearst turned against FDR in the mid-1930s and that his shift to the right was driven by anti-communist sentiment.
EMPIRICAL APPROACH
Measuring Hearst Penetration
My baseline analysis examines the effect of Hearst newspaper penetration on support for FDR in the 1936, 1940, and 1944 elections. I define my primary Hearst exposure variable as  , or Hearst circulation per capita. One concern here is that circulation is likely endogenous within a given market, as more residents will subscribe to a newspaper when it matches their own political views. Thus, I use circulation data from 1932, before Hearst became staunchly anti-communist and anti-FDR. Therefore, Hearst penetration captures how popular his papers were before they began printing anti-communist rhetoric, eliminating the potential of political sentiment in the mid-1930s to influence my independent variable. Among Hearst counties, the mean value of Hearst circulation per capita is 0.25, with a standard deviation of 0.13.
As further robustness checks, I use another measure of Hearst penetration: newspaper share, or the count of Hearst papers over total number of daily papers within a county. Within Hearst counties, there were an average of 10.3 daily newspapers operating in 1932 (s.e.=9.0), with a mean of 1.59 (s.e.=0.5) Hearst papers. This alternative measure is plausibly more exogenous, as it does not use circulation data at all. However, my primary measure, Hearst circulation per capita, best reflects how much influence these papers had within individual counties.
Difference-in-Difference Design
To examine the effect of Hearst penetration on support for FDR, I use a difference-in-differences design. Since Hearst’s anti-communist rhetoric began in the mid-1930s, I consider FDR’s vote share in the 1932 election to be prior to treatment, allowing me to examine the change in vote share over time.
The benefit of difference-in-differences is that it does not require control and treatment groups to be randomly assigned; instead, it requires parallel trends in the absence of treatment. Although the geographic locations of Hearst’s papers are unrelated to counties’ support for FDR in 1932, all of his daily papers were located in highly urban areas, which are not representative of all counties across the United States. To account for potential violations in parallel trends, I control for county fixed effects as well as detailed county characteristics interacted with year fixed effects, allowing these characteristics to have differential effects over time.
Finally, in some specifications, I control for political persuasion of newspapers more broadly. This includes controlling for total newspaper circulation per capita (excluding the circulation of Hearst papers), reflecting how popular newspapers were within a given county. Additionally, I control for the (leave-out) share of newspaper circulation where the newspaper had a Republican political affiliation, as well as the share of newspaper circulation where the newspaper had a Democratic political affiliation.
My main empirical specification is as follows:

where Yit is vote share for FDR, Hi is Hearst circulation per capita in county i, Postt is an indicator for post-1932, ηt are year fixed effects, ζi are county fixed effects, and  are baseline county controls interacted with year. Baseline controls include log total population (in ventiles), log population located in cities, percent urban, percent unemployed, percent Black, percent immigrant, percent farmers, percent illiterate (above the age of 10), percent who own a radio in their household, retail sales per capita, log land value per acre, share of farmland with tenant farmers, and whether the county is located in the South.
 is the estimated difference-in-difference coefficient, which represents the effect of Hearst newspaper penetration on the change in vote share for FDR. I show standard OLS standard errors clustered by county,Footnote 11 as well as wild-bootstrap standard errors, which often perform better with a small number of treated clusters (Cameron, Gelbach, and Miller Reference Cameron, Gelbach and Miller2008; Canay, Santos, and Shaikh Reference Canay, Santos and Shaikh2021).
Additionally, I use an event study approach, where I replace Hi × Postt with interactions between Hearst circulation and year, extracting separate coefficients for all elections. I generalize Yit to represent Democrat vote share in a given presidential year. This latter approach allows me to assess both parallel trends and determine whether Hearst’s reporting had a longer-run effect on support for the Democratic Party.
Within-County Design for Long-Run Public Opinion
Finally, to assess whether anti-redistributive attitudes persisted among those exposed to Hearst, I collect survey data from ANES. I use responses to two survey questions asked across multiple years that are closely related to redistributive beliefs: support for public healthcare and attitudes toward social welfare programs. First, for survey years 1970–1994, ANES asks respondents on a 7-point scale whether the government should provide health insurance for all (1) or health insurance should be fully private (7). I transform responses of 3 or below on the 7-point scale to be indicators that the respondent supports public healthcare. Additionally, from 1992–1994, ANES asked respondents whether spending on welfare programs should be reduced, stay the same, or increase, and from 1976–1994, how negatively respondents feel about those on welfare, from 0 (very negative) to 100 (very positive). To improve power, I combine these latter two variables to create a composite “negative towards welfare” variable, equal to 1 if respondents either feel welfare spending should be reduced or feel negatively toward those on welfare (below the 25th percentile of respondents).
Next, using the current county of the respondent and the number of years the respondent has been in that county, I create an indicator, Exposedr, indicating that the respondent was exposed to a Hearst newspaper. I consider one exposed to Hearst if they resided in a Hearst county while the papers were actively owned by Hearst and promoting anti-communist rhetoric. Based on my prior analysis of newspaper content, I consider this exposure window to start in 1935. For newspapers sold or closed down before 1957, I consider the end exposure year to be the year of sale or closure. Otherwise, I consider the last year of exposure to be 1957, regarded as the end of the Red Scare.Footnote 12
I run the following regression:

where Yrt is the survey response of interest, Adultr is an indicator for being exposed to Hearst for at least one year as an adult, Childr is an indicator for being exposed to Hearst only as a child, ζ c(r) are county fixed effects, γt are survey year fixed effects, and Xrt are respondent characteristics, including birth cohort in ten-year bins, age in five-year bins, gender, race, income binned in percentile buckets,Footnote 13 urban, suburban, or rural residence, education buckets (less than high school, high school, some college, or college or higher), major religious group (Protestant, Catholic, Jewish, or other), occupation category,Footnote 14 and whether the respondent considers themselves to be working, middle, or upper-middle class. Importantly, this specification compares respondents in the same county who were exposed or unexposed to Hearst, absorbing any other characteristics specific to counties that affect voting outcomes. Moreover, by controlling for detailed age buckets and survey year fixed effects, I account for the fact that older respondents or respondents surveyed in earlier years may hold generally more conservative beliefs. Again, all standard errors are clustered by county.
RESULTS
Support for FDR
Table 2 shows estimates of  , the effect of Hearst circulation on vote share for FDR in elections 1936 and later (Costantini Reference Costantini2026). Column (1) shows results for the full sample with baseline controls, Column (2) shows results with additional newspaper controls (for other newspapers operating within a given county), Column (3) shows results for the sample of large counties, and Column (4) shows results for the propensity-score matched sample. Column (2) suggests that a 10-percentage point increase in Hearst circulation decreased FDR vote share by 2.14 percentage points (s.e.=0.77), or 3.6 percent of the mean vote share for FDR. This result is robust to using more and more selective versions of the control group, as shown in Columns (3) and (4). In particular, the point estimate using the propensity-score matched sample is highly aligned with the baseline results, but is slightly noisier due to the much smaller sample size.
EFFECT OF HEARST NEWSPAPER CIRCULATION ON SUPPORT FOR FDR

Table 2 Long description
The table presents estimates of the effect of Hearst circulation on vote share for FDR in elections post-1932. It includes four columns and six rows of data. Column headers are: (1), (2), (3), and (4). Row labels include Hearst circulation per capita post-1932, Wild bootstrap confidence interval, Outcome mean, Observations, Controls, County fixed effects, County char. x year, Newspaper char. x year, and Sample. Each column shows different sets of controls and sample specifications. Column (1) shows results for the full sample with baseline controls, Column (2) includes additional newspaper controls, Column (3) focuses on large counties, and Column (4) uses a propensity-score matched sample. The table provides specific values for each column, indicating the impact of Hearst circulation on FDR's vote share.
Notes: The table shows difference-in-difference regression results, where row 1 displays  , the effect of Hearst circulation on vote share for FDR in elections 1936 and later. Column (1) is a regression on the full sample using baseline controls, Column (2) is a regression on the full sample using additional newspaper controls, Column (3) is a regression on the sample of large counties, and Column (4) is a regression on the propensity-score matched sample. I show standard errors clustered by county (in parentheses), as well as wild bootstrap confidence intervals. Sample sizes slightly differ between Columns (1) and (2) due to missing newspaper circulation data in some counties.
Sources: Original data come from Clubb, Flanigan, and Zingale (Reference Clubb, Flanigan and Zingale1987), Haines and ICPSR (2010), and Reference Gentzkow, Shapiro and SinkinsonGentzkow, Shapiro, and Sinkinson (2011b).
Event Study
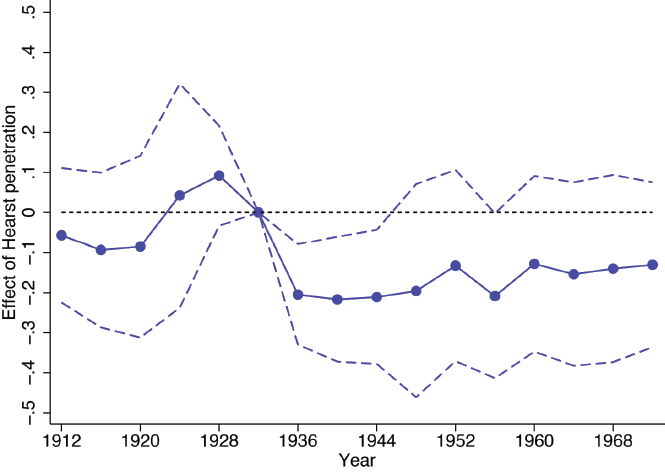
In Figure 5, I show the results of the event study specification, where the outcome of interest is Democratic vote share over time.Footnote 15 I show balance in the pre-period, with coefficients prior to 1932 close to 0 and statistically insignificant across all years. In contrast, I show that coefficients on Hi×1936, Hi×1940, and Hi×1944 are consistently negative and statistically significant, showing that Hearst influenced voting outcomes in all three FDR elections following his turn to the right. This shift in voting outcomes exactly mirrors Hearst’s shift in both political endorsements and reporting on communism, as shown in Figures 3 and 4.
EFFECT OF HEARST NEWSPAPER CIRCULATION ON DEMOCRATIC VOTE SHARE OVER TIME
Notes: This figure shows regression coefficients from the event study specification, where Democratic vote share is the dependent variable. Dots show point estimates, and dashed lines show 95 percent confidence intervals. I use the full sample of counties with daily papers, and controls include baseline county controls interacted with year and newspaper controls interacted with year. Standard errors are clustered by county.
Sources: Original data come from Clubb, Flanigan, and Zingale (Reference Clubb, Flanigan and Zingale1987), Haines and ICPSR (2010), and Reference Gentzkow, Shapiro and SinkinsonGentzkow, Shapiro, and Sinkinson (2011b).

Moreover, though the Red Scare died down at the end of the 1950s, I also show some suggestive evidence of persistence: I find that point estimates remain consistently negative—though they are insignificant—through 1972. When I look at long-run outcomes, I directly relate this persistent effect on voting outcomes to attitudes toward redistribution among those exposed to Hearst.
One concern with the event study design is the small number of potentially distinct treated counties. Thus, in the Online Appendix, I also use a synthetic control design (Abadie and Gardeazabal Reference Abadie and Gardeazabal2003; Abadie, Diamond, and Hainmueller Reference Abadie, Diamond and Hainmueller2010). Rather than relying on parallel trends, this approach matches prior trends in Democratic vote share using a weighted average of control counties, which make up the “synthetic” control. The method relies on the assumption that each Hearst county would have followed the same voting trajectory as its respective synthetic control under the counterfactual of no shift in Hearst’s ideology. I find that the synthetic control closely matches the voting pattern of Hearst counties in the pre-period, and I find similar qualitative results to those of the event study. See the Online Appendix for details.
However, one particular advantage of the event study and difference-in-differences approaches is that they allow me to include detailed county characteristic × year interactions, enabling the effect of a given demographic group to vary in each presidential election. Demographic × year controls may be particularly relevant in this setting, as the New Deal coalition was distinct from that of prior presidential elections, and demographic voting patterns may be correlated with Hearst’s presence. Most notably, Hearst counties have a very high share of immigrants, as documented in Table 1. Prior to the 1928 voter re-alignment, immigrants were far less likely to vote for a Democrat; following 1928, they were far more likely. Thus, using the full sample as a control group without these detailed county controls, I would have falsely concluded that Hearst had no effect (Online Appendix Table A1 Column (1)). Limiting the sample to only large counties, I estimate an effect much closer to the baseline estimate (Table A1 Column (3)). Nevertheless, adding demographic × year interactions makes the estimate slightly larger and more precise (Table A1 Column (4)). I perform additional robustness checks of interest in the following section.
Concerns Regarding Omitted Variable Bias
The primary concern with comparing Hearst and non-Hearst counties is that Hearst counties are fundamentally distinct from non-Hearst counties. As shown in Table 1, Hearst counties are larger and have a higher share of immigrants than non-Hearst counties. Although both the large county sample and the propensity-score matched sample have characteristics that more closely resemble Hearst counties, Hearst bought newspapers in the largest U.S. cities, making it difficult to find a comparable control group. In other words, despite the detailed county by year controls used in the analysis, there is still a concern about omitted variable bias.
One notable point is that any remaining omitted variable bias is likely to be reverse-signed: FDR was particularly popular among urban voters, and Hearst counties had a much higher share of immigrants, Jews, and Catholics, all of whom were much more likely to support FDR. This point is demonstrated clearly in Online Appendix Table A1, where I show the results with and without the county characteristic × year controls. The effect of Hearst circulation on vote share for FDR is actually reverse signed without these control variables (Column (1)), and the effect only becomes stronger as I add additional controls (Column (2)). Moreover, in Columns (3) and (4), I show the results with and without controls for the large county sample, which are almost identical. These latter results provide reassurance that these alternative samples—which more closely resemble Hearst counties—suffer from minimal omitted variable bias.
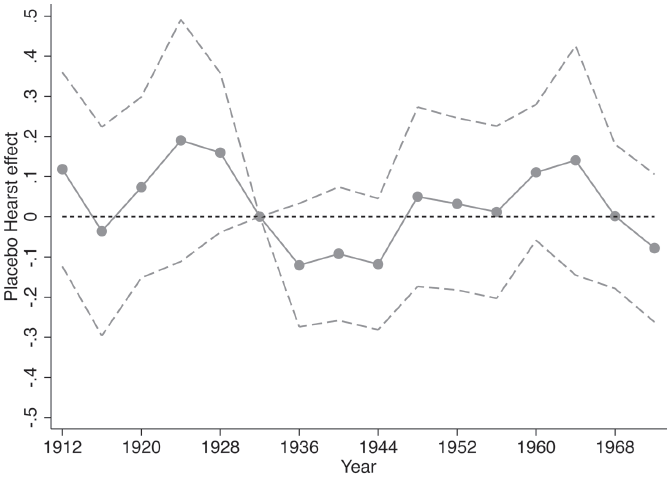
Moreover, I conduct several additional tests to mitigate concerns over omitted variable bias. First, in Table 4 (see the subsequent section), I drop the largest Hearst counties from the analysis, and results remain highly robust. Perhaps most convincingly, in Figure 6, I run a placebo test. First, I drop true treated Hearst counties from the analysis. Instead, I consider “treated” counties to be the largest U.S. counties that Hearst did not operate in. I assign these counties artificial values of Hearst circulation per capita based on those of true treated counties,Footnote 16 and then I rerun the baseline event study specification. The placebo test answers the question: Does Hearst circulation actually have no effect, but instead something about differential trends between large and non-large U.S. counties bias my results? I find insignificant coefficients across the board in the post-period for the placebo sample. This test should reassure the reader that the effect is not driven by Hearst counties being large and urban.
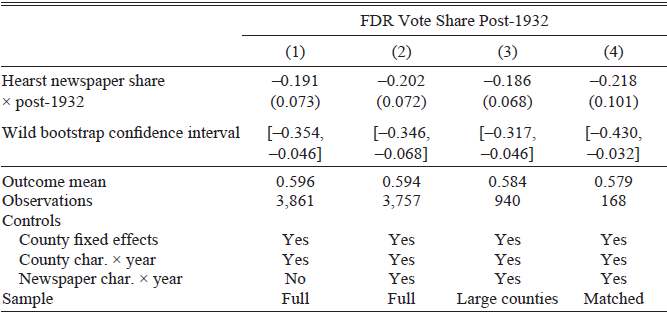
EFFECT OF HEARST NEWSPAPER SHARE ON SUPPORT FOR FDR

Table 3 Long description
The table presents difference-in-difference regression results examining the impact of Hearst newspaper share on support for FDR post-1932. It includes four columns of regression results with various controls and samples. Row 1: Hearst newspaper share post-1932, values are -0.191, -0.202, -0.186, -0.218 with standard errors in parentheses. Row 2: Wild bootstrap confidence intervals, values are [-0.354, -0.046], [-0.346, -0.068], [-0.317, -0.046], [-0.430, -0.032]. Row 3: Outcome mean, values are 0.596, 0.594, 0.584, 0.579. Row 4: Observations, values are 3,861, 3,757, 940, 168. Row 5: Controls include County fixed effects, County char. year, and Newspaper char. year with variations across columns. Row 6: Sample types are Full, Full, Large counties, Matched.
Notes: This table shows difference-in-difference regression results using the newspaper share measure of Hearst penetration. Newspaper share is defined as the count of Hearst papers over total number of daily papers within a county. Column (1) is a regression on the full sample using baseline controls, Column (2) is a regression on the full sample using additional newspaper controls, Column (3) is a regression on the sample of large counties, and Column (4) is a regression on the propensity-score matched sample. I show standard errors clustered by county (in parentheses), as well as wild bootstrap confidence intervals.
Sources: Original data come from Clubb, Flanigan, and Zingale (Reference Clubb, Flanigan and Zingale1987), Haines and ICPSR (2010), and Reference Gentzkow, Shapiro and SinkinsonGentzkow, Shapiro, and Sinkinson (2011b).
ROBUSTNESS CHECKS

Table 4 Long description
A table titled FDR Vote Share Post-1932 with five columns and four rows. The columns are labeled Baseline, Drop Large Hearst Counties, Control for Coughlin Signal, Cluster by State, and Spatial Clustering. The rows are labeled Hearst circulation per capita x post-1932, Outcome mean, and Observations. The values in the table are as follows: Row 1: Hearst circulation per capita x post-1932, -0.214 (0.077), -0.218 (0.076), -0.211 (0.078), -0.214 (0.070), -0.214 (0.052). Row 2: Outcome mean, 0.594, 0.594, 0.594, 0.594, 0.594. Row 3: Observations, 3,757, 3,745, 3,757, 3,757, 3,757.
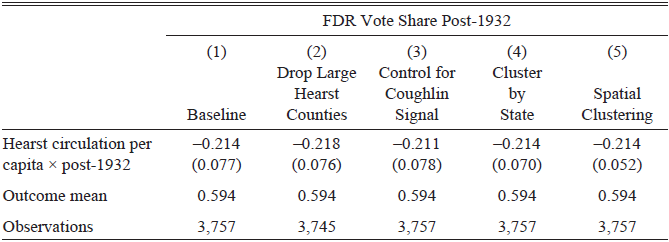
Notes: This table shows difference-in-difference regression results under various alternative specifications. Column (1) shows the baseline estimate using the full sample and all baseline control variables, including newspaper circulation variables. In Column (2), I drop Manhattan, Cook, and Los Angeles counties. In Column (3), I control for an indicator of Coughlin’s radio signal strength × post-1932, from Wang (Reference Wang2021). In Column (4), I cluster standard errors by state, and in Column (5), I report Conley (Reference Conley1999) spatial standard errors.
Sources: Original data come from Clubb, Flanigan, and Zingale (Reference Clubb, Flanigan and Zingale1987), Haines and ICPSR (2010), Reference Gentzkow, Shapiro and SinkinsonGentzkow, Shapiro, and Sinkinson (2011b), and Wang (Reference Wang2021).
PLACEBO TREATMENT COUNTIES EVENT STUDY
Notes: This figure shows regression coefficients from the placebo analysis, where I consider “treated” counties to be the largest U.S. counties in which Hearst did not operate. I assign these counties artificial values of Hearst circulation per capita based on those of true treated counties, and then I rerun the baseline specification. Hearst counties are excluded from the analysis. Dots show point estimates, and dashed lines show 95 percent confidence intervals.
Sources: Original data come from Clubb, Flanigan, and Zingale (Reference Clubb, Flanigan and Zingale1987), Haines and ICPSR (2010), and Reference Gentzkow, Shapiro and SinkinsonGentzkow, Shapiro, and Sinkinson (2011b).

Additional Robustness Checks
Another potential concern is that newspaper circulation is not exogenous, as it may reflect political opinions of readers. Although readers likely played a smaller role in Hearst’s decision to purchase a given paper, an individual chooses whether to have a particular paper delivered. To account for this problem, in the main specification, I use circulation share data from 1932, before Hearst became a hardline anti-communist. Moreover, I use an alternative measure of Hearst penetration: newspaper share, or number of Hearst newspapers in a county over total daily papers in that county. This measure is plausibly more exogenous, as it does not use circulation data. I display results using this alternative definition of the treatment variable in Table 3. Treatment effects using newspaper share are highly aligned with the primary results; increasing Hearst newspaper share by 10 percent decreases support for FDR by 2.02 percentage points (s.e.=0.72).
Secondly, recent innovations in the literature have demonstrated that OLS estimates of difference-in-difference coefficients may place negative weights on event time specific treatment effects, particularly in cases of staggered treatment adoption and treatment effect heterogeneity (Borusyak, Jaravel, and Spiess Reference Borusyak, Jaravel and Spiess2024; Callaway and Sant’Anna Reference Callaway and Sant’Anna2021; Chaisemartin and D’Haultfoeuille Reference Chaisemartin and D’Haultfoeuille2020). In this analysis, the treatment group is fixed, and all treatment begins in 1936, making this issue less of a concern here. Nevertheless, to ensure that negative weights are not affecting my results, I employ the method proposed by Callaway and Sant’Anna (Reference Callaway and Sant’Anna2021). I provide more detail in the Online Appendix and show results in Online Appendix Table A2. The estimates are very similar across approaches.
In Table 4, I perform miscellaneous relevant robustness checks. First, one potential concern is that the largest U.S. counties—Manhattan, Cook (Chicago), and Los Angeles County, all of which Hearst operated in—may be fundamentally incomparable to all potential control counties. To eliminate this concern, I drop these counties in Column (2).Footnote 17 Second, Wang (Reference Wang2021) showed that Father Coughlin, another large media personality in the 1930s and 40s, also influenced vote shares for FDR via his radio program, with Coughlin subsequently turning against FDR in later elections. Thus, to eliminate concern that Coughlin’s radio signal and Hearst’s newspaper circulation were spatially correlated, I control for Coughlin’s radio signal × post-1932 in Column (3).Footnote 18 Finally, to account for the fact that error terms may be geographically correlated, I cluster at both the state level (Column (4)) and report Conley standard errors (Column (5)), which adjust for spatial correlation (Conley Reference Conley1999). In Online Appendix Table A3, I perform various additional robustness checks. These include adding back contiguous border counties to the sample, as well as including more granular control variables, including state × year fixed effects and controls related to the strength of the Depression and New Deal spending. The results are highly aligned and statistically significant across all specifications.
Finally, another relevant question is whether Hearst’s other media holdings had an influence on voters. In particular, in the late 1920s, Hearst began to take an interest in radio, buying up local stations to complement his newspapers. I geolocate these radio stations and add radio exposure as a treatment variable in Online Appendix Table A4. I find some weak evidence that radio, in addition to newspaper circulation, affected voting outcomes.
Long-Run Outcomes
In Figure 7, I plot  and
 , estimated from the long-run regression specification. Across all survey years, 45.9 percent of respondents stated that they support public healthcare, while 38.1 percent of survey respondents answered that they feel negatively toward welfare; Hearst-exposed respondents hold even more anti-redistributive beliefs. I find that those exposed to Hearst as adults are less likely to support public healthcare and are more likely to feel negatively toward welfare programs or recipients. Specifically, I find that being exposed to Hearst decreases support for public healthcare by 4.4 percentage points (s.e.=1.3 p.p.), or 9.6 percent of baseline support, and increases negative attitudes toward welfare by 5.1 percentage points (s.e.= 1.7 p.p.), or 13.4 percent of baseline. I cannot reject no effects across the board for those exposed to Hearst as children, suggesting that attitudes were not passed from parents to children.
EFFECT OF HEARST EXPOSURE ON LONG-RUN ATTITUDES
Notes: This figure shows the effect of exposure to Hearst as either a child or an adult on attitudes toward government spending and redistribution. The blue bars plot  , and the lavender bars plot
 . Gray lines show 95 percent confidence intervals. “Support public healthcare” comes from ANES survey years 1970–1994, and “Disapprove of welfare” comes from 1976–1994 and is a combined measure of either wanting to reduce spending on welfare or feeling negatively toward those on welfare. All standard errors are clustered by county.
Sources: Original data comes from the American National Election Survey (2020) for the years 1970–1994.

One concern with the prior analysis is that those exposed to Hearst tend to be older than those not exposed to Hearst, and results could be reflecting that older respondents tend to be more conservative. Additionally, those in older cohorts could hold more conservative views, even when accounting for age. In Online Appendix Table A5, I show regression results from Equation (4). In Panel A, I show the baseline results, which control for detailed respondent characteristics, including five-year age groups and birth cohorts in ten-year intervals. In Panel B, I restrict the analysis to those old enough to be potentially exposed to Hearst as adults. Finally, as the Red Scare faded out gradually rather than ending abruptly in 1957, in Online Appendix Figure A6, I conservatively redefine the last year of potential exposure to Hearst-era propaganda as 1960. I find very similar results across all specifications.
Why Did Hearst Have Such a Large Impact?
Compared with other studies of the media’s impact, I find that Hearst had a particularly large effect on public opinion. For instance, DellaVigna and Kaplan (Reference DellaVigna and Kaplan2007) find that the entry of Fox News increased Republican vote share by only 0.4–0.7 percentage points. On the other hand, I find that a 10 percent increase in Hearst circulation per capita decreased vote share for FDR by 2.1 percentage points. With a mean Hearst circulation per capita of 25 percent across treated counties, this implies that Hearst presence in a county decreased vote share by about 8 percentage points. However, my estimates are highly aligned with those of Enikolopov, Petrova, and Zhuravskaya (Reference Enikolopov, Petrova and Zhuravskaya2011), who found that access to the only non-government run TV channel in 1999 Russia decreased support for the party in power by 8.9 percentage points.
What could explain the difference in magnitude between these different settings? One potential explanation is the lack of presence of other media sources. In particular, Durante and Knight (Reference Durante and Knight2012) find that highly partisan media causes readers to substitute toward more like-minded news sources, mitigating any potential effects of a single media source. In the case of the Russian media market, in many regions, all other sources of media were run by the government. Similarly, perhaps more limited competition during the FDR era, both due to media consolidation and the lack of alternative forms of news coverage, could help explain the large influence of the Hearst papers.
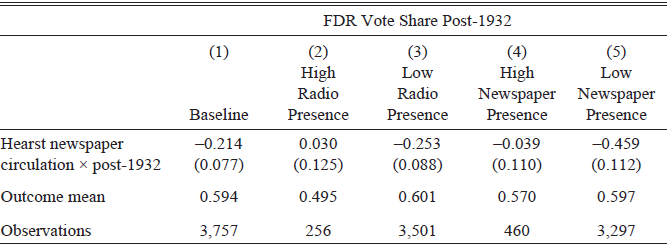
Following this logic, in counties with few alternative sources of news coverage, one should expect Hearst papers to have had more influence. To test this theory directly, I examine effect heterogeneity by the presence of other media in each county. First, during this era, radio was gaining increasing popularity. Thus, I divide the sample into counties with above and below median radio ownership (defining the median based on Hearst counties). Second, I test the diversification of the newspaper market directly by dividing the sample into counties with an above and below median number of (non-Hearst) newspapers. I show results in Table 5. The results are striking: in diversified media markets, Hearst newspapers seem to have had no impact at all. Thus, this table provides convincing evidence that the impact of the media highly depends on market concentration and individuals’ ability to substitute alternative forms of coverage.
HETEROGENEITY BY PRESENCE OF OTHER MEDIA

Table 5 Long description
A table comparing FDR vote share post-1932 across different media presence conditions. The table has 4 rows and 5 columns. Column headers are Baseline, High Radio Presence, Low Radio Presence, High Newspaper Presence, and Low Newspaper Presence. Row labels are Hearst newspaper circulation x post-1932, Outcome mean, and Observations. Row 1: Hearst newspaper circulation x post-1932, -0.214 (0.077), 0.030 (0.125), -0.253 (0.088), -0.039 (0.110), -0.459 (0.112). Row 2: Outcome mean, 0.594, 0.495, 0.601, 0.570, 0.597. Row 3: Observations, 3,757, 256, 3,501, 460, 3,297.
Notes: This table shows heterogeneity in the effect of Hearst circulation on vote share for FDR based on the presence of other media in the county. In Column (1), I show the baseline estimate. In Columns (2) and (3), I divide the sample into counties with above and below median shares of radio ownership (with the median defined based on Hearst counties). In Columns (4) and (5), I divide the sample into counties with an above and below median number of non-Hearst newspapers.
Sources: Original data come from Clubb, Flanigan, and Zingale (Reference Clubb, Flanigan and Zingale1987), Haines and ICPSR (2010), and Reference Gentzkow, Shapiro and SinkinsonGentzkow, Shapiro, and Sinkinson (2011b).
CONCLUSION
The rise of the Soviet Union spurred a domestic Red Scare in the United States in the early to mid-twentieth centuries, with real political ramifications. From William Randolph Hearst’s “yellow journalism” to McCarthy’s effort to purge communists from government, to fear of the atomic bomb, anti-Soviet and anti-communist sentiment played a prominent role in American political discourse for decades. This paper examines how this rhetoric influenced American households, particularly in their voting behavior and support for redistributive policy, which is frequently associated with socialism. I find that exposure to Red Scare propaganda via the newspapers of William Randolph Hearst decreased support for FDR in the 1936–1944 presidential elections. Moreover, I find evidence that these effects are persistent, decreasing support for public healthcare and welfare programs through the late twentieth century.
In contrast with previous work which finds little effect of media ownership, this case study offers insight into when owners may be important in shaping both partisan slant and political outcomes. In particular, Hearst possessed extreme beliefs, controlled up to 60 percent of newspaper circulation in the areas where he purchased papers, and ruthlessly promoted his own ideology even when it nearly led to bankruptcy. In line with my results, Larcinese, Puglisi, and Snyder (Reference Larcinese, Puglisi and Snyder2011) and Durante and Knight (Reference Durante and Knight2012) also provide case studies where ideologically motivated owners played a key role in shaping news coverage. However, Durante and Knight (Reference Durante and Knight2012) find that highly partisan media causes readers to substitute toward more like-minded news sources, mitigating ownership effects. My results add to the evidence that, in low-substitutability markets, individual owners have more power to influence voters.
The widespread and long-lasting influence of Hearst’s anti-communist rhetoric adds strong support to the growing evidence that both media personalities and newspaper slant can influence public opinion, with real effects on voting behavior. Thus, this study has important implications with regard to populists’ use of media in contemporary elections. In fact, Hearst is sometimes described as the originator of fake news, publishing a-factual, sensationalized stories that corroborated his personal viewpoints. Ultimately, this paper both emphasizes the role of journalism in influencing political outcomes and demonstrates the long-run legacy of anti-communist sentiment in American politics.




 Open access

