INTRODUCTION
Current recommendations for K fertilizer use on UK sugar beet are based on yield-response trials done in the late 1960s and early 1970s (Durrant et al. Reference Durrant, Draycott and Boyd1974; Draycott & Durrant Reference Draycott and Durrant1976; Anon. 1995, 2002; MAFF 2000). Since then, national average yields have increased from 35 to 60 t clean beet/ha and from 6 to 9 t sugar/ha, largely through the introduction of better varieties and improved cultural practices. These greater yields might be expected to need increased inputs of K, yet recent trials have shown few yield responses to freshly applied K fertilizer – even on low K Index soils (Bee et al. Reference Bee, Jarvis and Armstrong1997; Armstrong et al. Reference Armstrong, Jarvis, Milford, Bellet-Travers and Leigh1998). In those studies, differences in soil Kex (due to soil type, rotation and past fertilizer and manuring practices) had much greater effects on K uptake, yield and beet quality than freshly-applied fertilizer K. Sodium can augment or replace K as an osmotic solute in sugar beet (Marschner Reference Marschner1971) and recent surveys show that over three-quarters of UK sugar-beet fields currently receive c. 150 kg Na2O/ha, usually in addition to any K fertilizer (British Sugar plc, unpublished data). It is not clear whether the lack of response to freshly applied fertilizer K means that modern, high-yielding sugar-beet crops do not require more K or whether the more extensive use of Na has obviated the need for it.
The main drawback of previous K-response experiments has been that, in order to achieve the required differences in soil Kex, they had to be done on different fields that varied in soil texture, rotational history and management practice. However, two long-term K-reference experiments have been established at Rothamsted and Woburn by differentially fertilizing plots with potash during the past 20 years to produce a wide range of topsoil Kex within single fields. These reference plots were used in the present study to examine whether modern, high-yielding sugar-beet crops required greater inputs of K than crops grown in the 1960–70s and to examine how soil Kex influenced responses to N, K and Na fertilizers.
MATERIALS AND METHODS
The main long-term K reference experiment is situated on a silty clay loam at Rothamsted Research with a topsoil concentration of exchangeable Na of 15–20 mg/kg. The experiment has two blocks each containing 20 randomized plots (24 m long and 9 m wide, separated by 3 m sown guard strips). The concentrations of Kex in the topsoil of these plots range from 40–550 mg/kg. In successive years between 2000 and 2005, the two blocks were alternately sown with winter wheat and sugar beet, with the rotation staggered to allow an experiment to be done on sugar beet on one of the blocks each year. The large main plots (excluding the two with the lowest concentrations of topsoil Kex) were sub-divided lengthwise when the sugar beet was grown to examine the interactions between (a) topsoil Kex and N fertilizer (90 v. 150 kg/ha) in 2000 and 2001; (b) topsoil Kex and freshly-applied K fertilizer (0 v. 100 kg K2O/ha applied as potassium chloride) in 2002 and 2003; and (c) topsoil Kex and Na fertilizer (0 v. 135 kg Na2O/ha applied as agricultural salt, NaCl) in 2004 and 2005. The fertilizers were applied by hand and cultivated into the topsoil prior to drilling, and the sub-plot treatments alternated in the years they were tested to maintain the long-term nutrient balance of the plots.
A subsidiary long-term K reference experiment is sited on a contrasting sandy loam soil at Woburn; this soil has a lower topsoil concentration of Na (i.e. 5–10 mg/kg). This smaller experiment consists of three blocks of 12 randomized plots (3×3 m) with a similar initial range of topsoil Kex to those at Rothamsted. Only the responses to differences in topsoil Kex were tested on this site because the plots were too small to sub-divide. The final experiment in 2005 was an exception. In this year, plots of similar topsoil Kex concentration were paired across two of the blocks to test interactions between soil K and applied Na (0 v. 135 kg Na2O/ha). The plots in the third block had a much higher topsoil concentration of exchangeable Na (27 mg/kg) than those of the other two blocks. This was because a previous year's experiment, sited on the third block, was abandoned having being completely grazed by deer at the seedling stage. This left large residues of Na in the soil that were not leached from the profile by the low rainfall of the intervening winter. The plots of the third block were consequently used to compare the effect of this greater concentration of exchangeable soil Na with that of freshly-applied fertilizer Na.
Each spring, the topsoil of every plot at both sites was sampled to 0·23 m depth and analysed for exchangeable K and Na. Representative plots with high, medium and low concentrations of Kex in the topsoil were also sampled in 0·30 m horizons to 0·90 m depth for analysis of exchangeable K and Na. Soil weights of 3·0 and 2·8 million kg of fine soil/ha, respectively, were used to convert the Kex concentrations of the Rothamsted and Woburn soils to kg Kex/ha. The plots at Rothamsted were cultivated and drilled by machine and those at Woburn dug and sown by hand. The sugar beet cv. Stallion was grown in 2000 and 2001, Roberta in 2002, 2003 and 2004, and Dominika in 2005 using pelleted seed treated with thiram, imadocloprid and tachigaren, sown at a rate of 10 seeds/m2 in rows 0·5 m apart. An initial dressing of 40 kg/ha of the N fertilizer and the whole K and Na fertilizer treatments were applied and incorporated into the soil prior to drilling. The balance of the N fertilizer was applied at the 4-leaf stage of seedling development. Appropriate pre- and post-emergence herbicides were used to control weeds and a flusilazole+carbendazim fungicide (Punch C at 0·525 l/ha) was applied, when necessary, to control late-season foliar diseases. Irrigation was applied at Rothamsted, as needed, to incorporate the fertilizers and to alleviate drought.
The plots were harvested in late September or early October. Immediately prior to harvest, a 3 m2 area was dug from each sub-plot and the plants counted and topped by hand. The fresh tops were weighed in the field and the beet in the laboratory after washing, and both tops and storage roots were sub-sampled to determine their dry matter content after drying at 80°C for 48 h. The dried sub-samples were milled and analysed for N, K and Na by standard laboratory methods. At Woburn, the whole of the small plots (except for a surrounding guard strip) was lifted and processed in this manner. Yields at Rothamsted were subsequently measured by lifting 9 m lengths from the three central rows of each sub-plot with a Garford plot harvester. The beet were washed and weighed in a static mobile tarehouse and brei samples taken for analysis of their sugar, K, Na and amino-N contents in a tarehouse laboratory. Yields are expressed as adjusted tonnes of beet (i.e. the tonnes of clean beet adjusted to a standard sugar concentration of 160 g sugar/kg fresh beet).
Data were analysed using the GENSTAT statistical package (Lane & Payne Reference Lane and Payne1996). Yield responses to differences in topsoil Kex were analysed by fitting asymptotic regressions to estimate the maximum yield in each experiment and the topsoil concentration of Kex needed to obtain 0·95 of the maximum yield (i.e. the ‘critical’ concentration). A split-plot statistical design was used to examine the interactions between topsoil Kex and the fertilizer treatments at Rothamsted. Because individual concentrations of soil Kex could not be replicated exactly, plots were allocated to six groups of broadly similar topsoil Kex concentration, i.e. 62–71, 77–93, 110–123, 148–187, 212–277 and 316–473 mg/kg (which equate to Soil K Indices of 0, 1, 2–, 2+, 3 and 4). There were three such plots in each group. Topsoil Kex was used as the main-plot factor and the fertilizer treatments as sub-plot factors in the analyses of variance.
Two relevant indices defined by Cassman et al. (Reference Cassman, Peng, Olk, Ladha, Reichardt, Dobermann and Singh1998) were calculated to assess the efficiency with which crops used the nutrients in the applied fertilizers. These were:
(i) the agronomic efficiency of the applied nutrient, (AEn)=(Y n−Y 0)/F n (expressed as kg adjusted clean beet/kg of applied nutrient);
(ii) the apparent recovery of the applied nutrient, (REn)=(U n−U 0)/F n.
In these, F n represents the amount of nutrient (n) applied, Y n and Y 0 the yields with and without the applied nutrient, and U n and U 0 the amounts of nutrient in the crop at harvest for crops grown with and without the applied nutrient (each expressed as kg/ha).
The second calculation, referred to as the ‘difference’ method, is widely and appropriately used for N because, when applied in the correct amount and at the right time, little of the fertilizer N remains in the soil to benefit succeeding crops. The method was used to quantify the recoveries of N and Na in the present experiments. However, the difference method is less appropriate for phosphorus (P) and K fertilizers because little of either is actually taken up by the crop to which it is applied. Syers et al. (Reference Syers, Johnston and Curtin2007) suggest that recoveries of P and K are better estimated by a ‘balance’ method in which the total uptake (or offtake) of the nutrient (n) is divided by the amount applied, i.e. U n/F n. In justification, they argue that much of the applied P and K enters the readily available and less readily available pools within the soil and may therefore be used by following crops. Any P and K present in crops to which they were applied, which has not come from the fertilizer, must have come from soil reserves. Thus any P or K that is applied to replenish soil reserves should be considered as part of their recovery in the year in which they are applied. The balance method always gives a larger percentage recovery than the difference method. Recoveries that exceed unity indicate that the amount of P or K applied was less than that removed in the harvested crop and infers that soil reserves of those nutrients are being depleted.
RESULTS
Changes in exchangeable soil K
When the sugar-beet experiments started in 2000, the concentrations of Kex in the topsoil of the reference plots on the silty clay loam at Rothamsted ranged from 40–550 mg/kg, and those on the sandy loam at Woburn from 40 to 450 mg/kg. The sugar-beet tops were ploughed back into the soil after each experiment but the K removed in the harvested beet was not replaced so the topsoil concentrations of Kex decreased progressively during the course of the experiments – more so at the upper than the lower end of the Kex range, and more so at Rothamsted than Woburn. The topsoil concentrations of Kex in the final year ranged from 40 to 400 mg/kg at Rothamsted and from 35 to 350 mg/kg at Woburn.
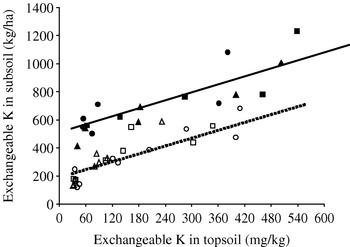
The potassium status of arable soils is usually characterized by measurements made on samples of topsoil (MAFF 2000), but subsoils usually also contain substantial quantities of nutrients and water which are exploitable by the deep, extensive fibrous-root systems of sugar beet (Brown & Biscoe Reference Brown and Biscoe1985). Soil-profile measurements on plots with similar concentrations of Kex in the topsoil showed that there was much more Kex in the subsoil at Rothamsted than at Woburn. The subsoil of the K Index 0 plots at Rothamsted, for instance, contained c. 550 kg Kex/ha compared with only 230 kg Kex/ha at Woburn, and that of the K Index 2− plots 600 and 300 kg Kex/ha, respectively (Fig. 1). The concentrations of exchangeable Na, on the other hand, did not vary greatly within the soil profile. Concentrations in both the topsoil and subsoil averaged 17 mg Na/kg at Rothamsted and 7 mg Na/kg at Woburn and remained at these levels throughout the experimental period.
Relationships between the concentrations of exchangeable K in the top 0·3 m of the soil and the amounts in the subsoil (0·3–0·9 m) at Rothamsted (open symbols) and Woburn (closed symbols) in 2000 (○●), 2001 (□■) and 2003 (△▲).

Agronomic responses to exchangeable soil K
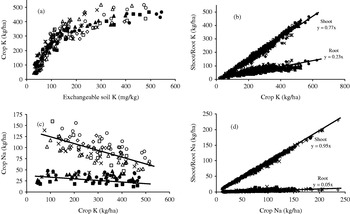
Crop uptakes of K increased asymptotically with topsoil Kex (Fig. 2a). Seasonal uptakes ranged from 350 to 520 kg K/ha, and averaged 430 kg K/ha at Rothamsted and 400 kg K/ha at Woburn (s.e.d.=32·2 with 7 d.f.). Increasingly larger uptakes of K were accompanied by progressively smaller uptakes of Na. Seasonal uptakes of Na ranged from 50 to 150 kg/ha at Rothamsted and from 10 to 50 kg/ha at Woburn (Fig. 2c). Potassium and sodium were distributed in an extremely consistent manner within the plant with 0·75 of the K and 0·95 of the Na being in the shoot and the rest in the storage root (Figs 2b and 2d). The distributions were not affected by the amounts taken up, seasonal weather or soil type.
(a) The effect of the concentration of exchangeable topsoil K on K uptake; (b) the distribution of K within the plant; (c) the relationship between K and Na uptake, and (d) the distribution of Na in sugar beet plants grown at Rothamsted (open symbols and ×) and Woburn (closed symbols and *) in 2000 (○●), 2001 (□■), 2002 (△▲), 2004 (◊◆) and 2005 (×*).

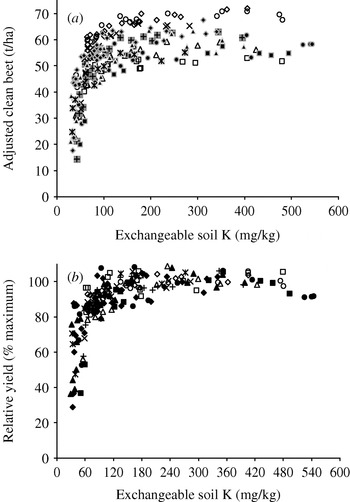
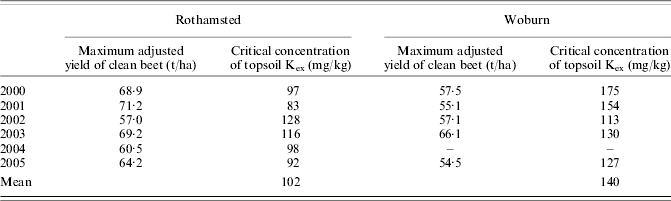
The adjusted yields of clean beet increased asymptotically with the concentration of Kex in the topsoil (Fig. 3a). Maximum adjusted yields of clean beet in different experiments ranged from 57 to 71 t/ha at Rothamsted and from 55 to 66 t/ha at Woburn. Critical soil concentrations for nutrients for yield are defined as the concentrations needed to achieve 0·95 of the maximum yield. They are preferred because they can be estimated more precisely from yield-response curves than the asymptotic concentrations needed to achieve maximum yield. The critical concentration of topsoil Kex needed to maximize sugar-beet yields in the present experiments averaged 102 mg/kg at Rothamsted and 140 mg/kg at Woburn (s.e.d.=3·0 with 9 d.f.; Table 1). Much of the season-to-season variation in the yield-response curves in Fig. 3a can be minimized by expressing individual plot yields as a proportion of the maximum yield of the experiment. Response curves plotted on this basis show more clearly that maximum yields were achieved in all experiments at a topsoil concentration of 120–150 mg Kex/kg (Fig. 3b), i.e. at soil K Index 2−.
Responses of (a) the adjusted and (b) the relative yields of clean beet to the concentration of exchangeable topsoil K at Rothamsted (open symbols, + and ×) and Woburn (closed symbols and *) in 2000 (○●), 2001 (□■), 2002 (△▲), 2004 (+) and 2005 (×*).

Maximum adjusted yields of clean beet and the critical concentrations of exchangeable topsoil K (Kex) needed to achieve 0·95 of the maximum yield at Rothamsted and Woburn in 2000–05
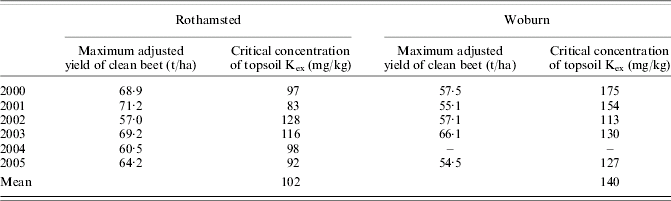
Two factors may explain why the critical concentrations of topsoil Kex needed to obtain maximum yield were, on average, greater at Woburn than Rothamsted. The first is that standard topsoil measurements do not take into account the reserves of Kex accessible to the crop within the subsoil. These subsoil reserves were substantially greater at Rothamsted than Woburn (Fig. 1); the subsoil of the K Index 0 and 1 plots at Rothamsted, for instance, contained more than 500 kg Kex/ha and that of the K Index 2 plots over 600 kg Kex/ha compared with only 150 and 250 kg Kex/ha, respectively, at Woburn. A second factor may be that the silty clay loam at Rothamsted also had a higher concentration of exchangeable Na (17 mg/kg) than the sandy loam at Woburn (7 mg/kg). Sugar beet can use Na as an alternative osmotic solute when K is in short supply. The physiological interactions underlying the responses to K and Na are discussed in more detail later.
Responses to N, K and Na fertilizers
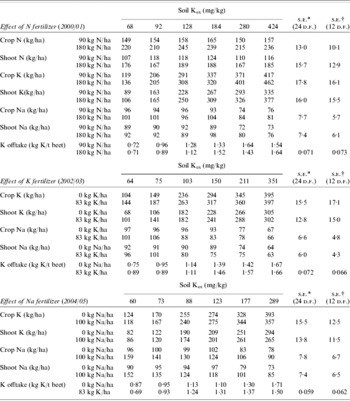
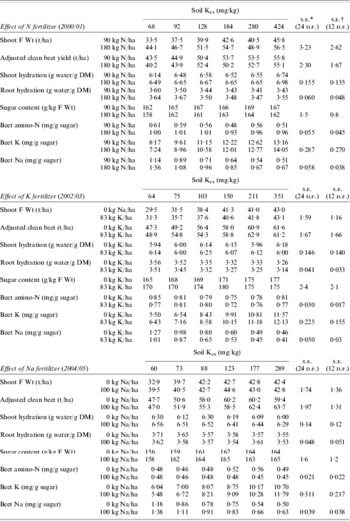
Apart from one experiment at Woburn that tested responses to applied Na in 2005, the interactions between topsoil Kex and freshly applied N, K and Na fertilizers were only examined at Rothamsted. There were no interactions between topsoil Kex and freshly applied N and K fertilizers and only a few involving fertilizer Na. Therefore, Tables 2 and 3 show only the main effects of each fertilizer on nutrient uptake, yield and beet quality averaged over the 2 years that each was tested.
Effects of N, K and Na fertilizers on the nutrient content of sugar beet at different levels of exchangeable topsoil K (Kex) at Rothamsted

* s.e.d. for comparing effects of fertilizers at different levels of topsoil K.
† s.e.d. for comparing effects of fertilizers at the same level of topsoil K.
Effects of N, K and Na fertilizers on yield and beet quality at different levels of exchangeable topsoil K (Kex) at Rothamsted

* s.e.d. for comparing effects of fertilizers at different levels of topsoil K.
† s.e.d. for comparing effects of fertilizers at the same level of topsoil K.
Fertilizer uptake
The lower rate of N fertilizer (90 kg/ha) used in the 2000/01 experiments was slightly smaller than that recommended for the soil type and cropping history of the field, whereas the higher rate (180 kg/ha) was sufficient to produce the luxuriant shoot growth characteristic of sugar beet grown on highly N-fertile soils. The amounts of fresh K fertilizer (100 kg K2O/ha) applied in the 2002/03 experiments and Na fertilizer (135 kg Na2O/ha) applied in the 2004/05 experiments were as recommended for the soil type and cropping histories of the fields (MAFF 2000).
The balance and difference methods for quantifying the recovery of freshly-applied K fertilizer were compared using the offtakes in harvested beet rather than total crop uptakes. This was because sugar-beet tops are normally ploughed in after harvest, returning their K to the soil. The balance method was not considered appropriate for quantifying the recovery of applied Na because virtually all of the crop's Na remains in the shoot and is also returned to the soil after harvest.
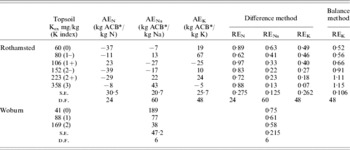
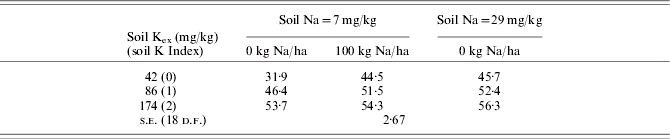
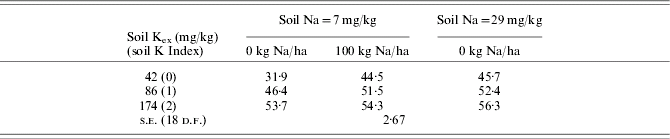
None of the N, K or Na fertilizer treatments at Rothamsted increased the adjusted yield of clean beet (Table 3) so the calculated agronomic efficiencies for these nutrients (AEN, AEK and AENa) were small and frequently negative at all concentrations of topsoil Kex (Table 4). There was, however, a large yield response to the applied Na on plots with low concentrations of topsoil Kex in the experiment on the low Na soil at Woburn in 2005 (Table 5) and, consequently, a large increase in AENa (Table 4). The recovery of the extra N supplied by the higher rate of fertilizer in the experiments at Rothamsted was not affected by the concentration of Kex in the topsoil – the same proportion of the extra N applied at the higher rate (i.e. 0·80) was recovered in the crop at all concentrations of topsoil Kex. The uptake of K from the freshly applied potash, on the other hand, was strongly influenced by concentration of Kex in the topsoil. The apparent recovery of applied K (calculated by the difference method) was just under 0·50 for crops grown on the K Index 0 plots, about 0·30 for crops grown on the K Index 1 and K Index 2 plots, and less than 0·10 for crops grown on the K Index 3 plots (Table 4). The corresponding calculations made using the balance method, however, inferred that the recovery of the freshly applied K was restricted by very low topsoil concentrations of Kex but balanced offtake when there was adequate Kex in the soil. The recovery of applied Na at different levels of topsoil Kex was only calculated using the difference method. Recovery was influenced by the concentrations of both Kex and exchangeable Na in the soil. The sugar beet grown on the low Na soil at Woburn took up 0·75 of the applied Na on the K Index 0 plots and 0·60 on the K Index 1 and 2 plots compared with 0·60 of the applied Na at K Index 0, 0·23 at K Index 1 and 0·12 at K Index 2 on the higher Na-content soil at Rothamsted (Table 4). A larger application of N increased the uptake of K but not Na – mainly into the shoot. The implications of these responses for fertilizer practice are discussed later.

Effect of exchangeable soil Na and Na fertilizer on adjusted clean beet yields (t/ha) at different levels of exchangeable topsoil K (Kex) at Woburn in 2005
Effects on growth and yield
None of the fertilizer treatments increased the adjusted yields of clean beet at Rothamsted. The extra N and Na increased the growth and water content of the shoot but an application of fresh K did not. The extra N also increased the water content of the harvested beet (thereby decreasing the fresh-weight concentration of sugar) and increased the concentration of amino-N and Na impurities relative to sugar. The Na fertilizer increased the concentration of Na impurities relative to sugar, and the K fertilizer increased the concentration of K impurities relative to sugar and decreased that of the Na impurities (Table 3).
DISCUSSION
The effects of K and Na fertilizers on yield and beet quality in the present experiments closely parallel those obtained in past fertilizer-response trials on commercial sugar-beet fields, especially those of Bee et al. (Reference Bee, Jarvis and Armstrong1997) and Armstrong et al. (Reference Armstrong, Jarvis, Milford, Bellet-Travers and Leigh1998) who reported large yield responses to field-to-field differences in soil Kex but few to freshly applied K or Na fertilizers – even on soils that were low in Kex. A yield response to applied Na was only obtained in the present study in the 2005 experiment on the low Na soil at Woburn, where the adjusted yields of clean beet on the K Index 0 plots were increased by 40% and those on the K Index 1 plots by 11%. The yields obtained with applied Na on these low Kex plots were comparable with those obtained without applied Na on adjacent plots with a much higher concentration of exchangeable soil Na (Table 5).
Physiological basis of K and Na interactions
A better physiological understanding of the interactions between soil Kex and freshly applied K and Na fertilizers should lead to better recommendations for K and Na use on sugar beet. The basic physiological processes relating to the interception and conversion of solar radiation that govern the growth and yield of sugar beet are now well established and were reviewed by Milford (Reference Milford and Draycott2006) and Jaggard & Qi (Reference Jaggard, Qi and Draycott2006). The physiological roles of K and Na within the plant have been reviewed by Kirkby et al. (Reference Kirkby, Armstrong and Milford1987). Briefly, sugar yields are determined primarily by the amount of solar radiation intercepted by the foliage during the growing season and rapid expansion of the leaf canopy during the early months of growth is a prerequisite for maximizing interception. Early leaf growth is driven by favourable spring temperatures and the availability of sufficient N and water in the soil, but it is essential that there are also adequate uptakes of osmotic solutes to maintain cell turgor and allow leaves to expand rapidly and function efficiently. Potassium is the major cellular osmotic solute used by plants to regulate water content and maintain turgor for growth and stomatal action (Marschner Reference Marschner1971). Because of their halophytic origin, sugar-beet plants have retained the ability to use Na as an osmotic solute in addition to, or as a replacement for, K (Marschner Reference Marschner1971; Kirkby et al. Reference Kirkby, Armstrong and Milford1987). Because K and Na are largely present as solutes within plant cell vacuoles, Leigh & Johnston (Reference Leigh and Johnston1983a, Reference Leigh and Johnstonb) suggested that better physiological insights into crop responses to such soluble nutrients could be obtained by expressing their concentrations relative to tissue water (mmol/kg) rather than as a conventional percentage in dry matter. Preliminary studies on sugar beet have shown that tissue-water concentrations of K and Na in the shoot remain relatively constant throughout much of the growing season (Kirkby et al. Reference Kirkby, Armstrong and Milford1987), as it does in cereals (Leigh & Johnston Reference Leigh and Johnston1983a, Reference Leigh and Johnstonb). Data from hand-harvested samples taken immediately prior to harvest in the present study were used to calculate the tissue-water concentrations of K and Na in shoots and storage roots.
Tissue-water concentrations of K and Na in the shoot
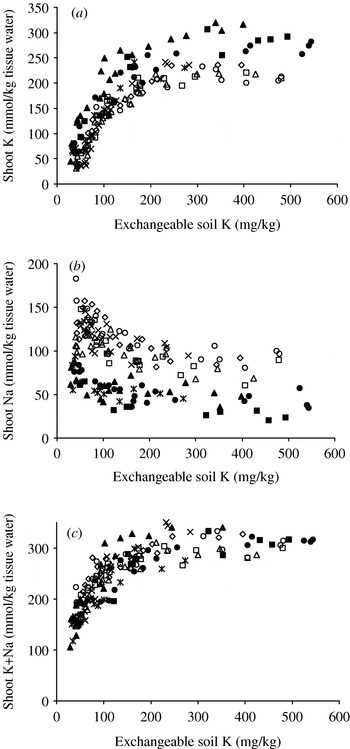
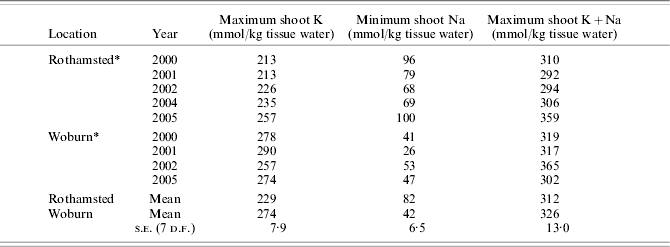
Tissue-water concentrations of K in the shoot increased asymptotically with increasing concentrations of Kex in the topsoil (Fig. 4a) and the increase in tissue-water K was accompanied by a corresponding decrease in the concentration of Na (Fig. 4b). Maximum concentrations of K and minimum concentrations of Na were attained when the concentration of Kex in the topsoil was greater than 120 mg/kg – the concentration needed to maximize crop growth and yield (Fig. 3b). The maximum concentrations of K, minimum concentrations of Na and the total concentrations of K+Na, given for each of the experiment in Table 6, were estimated from exponential regressions fitted to the individual response curves shown in Fig. 4. Plants maintained a similar total maximum concentration of 300–350 mmol/kg of K+Na within shoot tissue water at the two sites in each of the years but the availability of Na from the soil strongly influenced the balance of the two solutes. When soils contained little exchangeable Na, as at Woburn, the maximum total solute concentration was achieved with 40 mmol of Na plus 275 mmol of K/kg of tissue water whereas, on the higher Na soil at Rothamsted, it was achieved with less K (230 mmol/kg) and more Na (80 mmol/kg).
Tissue-water concentrations of (a) potassium, (b) sodium and (c) potassium plus sodium in the shoots of sugar beet grown without K or Na fertilizer on plots with different concentrations of exchangeable topsoil K at Rothamsted (open symbols and ×) and Woburn (closed symbols and *) in 2000 (○●), 2001 (□■), 2002 (△▲), 2004 (◊) and 2005 (×*).

Limiting tissue-water concentrations of K and Na in the shoots of sugar beet grown with non-limiting concentrations of exchangeable topsoil K at Rothamsted and Woburn in 2000–05
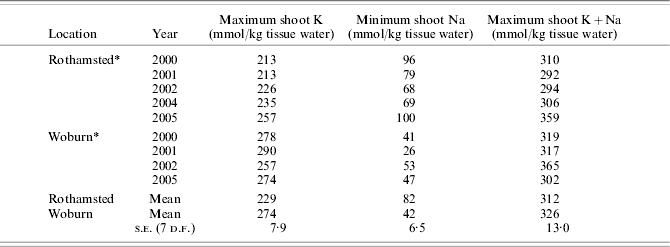
* The concentrations of exchangeable topsoil Na were 12–19 mg/kg at Rothamsted and 5–10 mg/kg at Woburn.
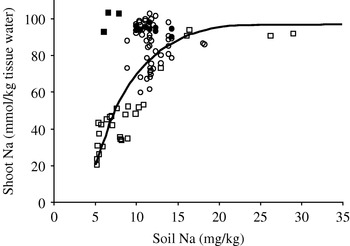
Earlier workers have observed a specific requirement of sugar beet for Na even when soil K is plentiful (Adams Reference Adams1961; Marschner Reference Marschner1971; Christenson & Draycott Reference Christenson, Draycott and Draycott2006). In an attempt to quantify the concentration of exchangeable soil Na needed to meet this requirement, the minimum asymptotic concentration of Na in shoot tissue-water that plants attained in each experiment when soil Kex was non-limiting (i.e. >200 mg/kg) has been plotted against the corresponding concentration of exchangeable Na in the topsoil (Fig. 5). The fitted regression relates to the open symbols which denote crops that received no Na fertilizer. The curve shows that there needed to be a minimum of 15–20 mg/kg of exchangeable Na in the topsoil for the shoots of plants to maintain an optimum tissue-water concentration of 90–100 mmol Na/kg. There was always sufficient exchangeable Na for this in the silty clay loam at Rothamsted but, in the 2005 experiment on the sandy loam at Woburn, there was only sufficient exchangeable soil Na in the group plots with a large residue a preceding experiment. Applying Na fertilizer to sugar beet grown on these Na-sufficient plots increased neither the concentration of Na in shoot tissue water (closed symbols in Fig. 5; Table 7) nor yield (Table 3). On the other hand, applications of Na fertilizer to the remaining Woburn plots that had little exchangeable Na in the topsoil not only restored the tissue-water concentrations of shoot Na to the optimum but also increased yield – especially on plots that were also low in Kex (Fig. 5; Table 5).
Relationship between the minimum tissue-water concentration of sodium in the shoot and the concentration of exchangeable Na in the topsoil for sugar beet grown with (closed symbols) and without (open symbols) NaCl fertilizer at Rothamsted (○●) and Woburn (□■).

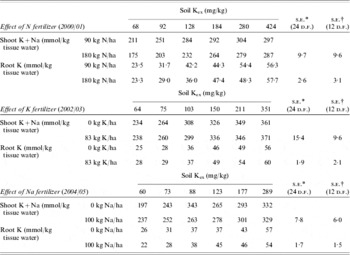
Effect of N, K and Na fertilizers on the tissue-water concentrations of K and Na in the shoots and storage roots of sugar beet at different levels of exchangeable topsoil K (Kex) at Rothamsted

* SED for comparing effects of fertilizers at different levels of topsoil K.
† SED for comparing effects of fertilizers at the same level of topsoil K.
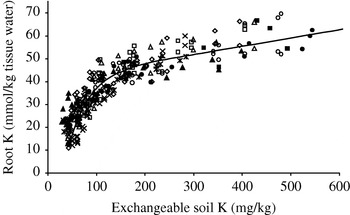
Tissue-water concentrations of K in the storage root
Only concentrations of K are considered in storage roots because they contain very little Na, so tissue-water concentrations of Na rarely exceed 5 mmol/kg. The tissue-water concentrations of K are much smaller in the storage root than in the shoot (Fig. 2d), presumably because a high concentration of sucrose is accumulated within the cell vacuoles of the storage root and acts as a major additional osmotic solute (Bell et al. Reference Bell, Milford, Leigh, Zamski and Schaffer1996). The tissue-water concentrations of K in the storage root increased with increasing concentrations of topsoil Kex. The increase was exponential up to a tissue-water concentration of 45 mmol K/kg but, instead of approaching an asymptotic maximum as in the shoot, continued to increase at a slower, more linear rate up to c. 70 mmol K/kg. There were no obvious locational or seasonal differences in this relationship between storage-root and topsoil K (Fig. 6) or any effects of applied N or Na fertilizers. Freshly-applied K increased the concentrations of K in storage-root tissue water by only 2–3 mmol/kg at each level of topsoil Kex (Table 7).
Relationship between the tissue-water concentration of K in the storage root and the concentration of exchangeable K in the topsoil for sugar beet grown at Rothamsted (open symbols and ×) and Woburn (closed symbols and *) in 2000 (○●), 2001 (□■), 2002 (△▲), 2004 (◊) and 2005 (×*).

Implications for fertilizer practice
Potassium
This series of highly definitive experiments has, for the first time, allowed the responses of sugar beet to a wide range of topsoil Kex concentration to be directly quantified within single fields on contrasting soils. They have also allowed some of the interactions between soil Kex and N, K and Na fertilizers to be more meaningfully interpreted. Maximum adjusted yields of clean beet were obtained with a topsoil concentration of 120–150 mg Kex/kg on both the silty clay and sandy loam soils. These limiting concentrations are within the soil K Index 2 – range; sugar yields were decreased below this range through reductions in both clean beet yield and sugar concentration. A current aim of the UK sugar-beet industry is to increase the national average adjusted beet yield in the UK from 54 to 70 t/ha during the next few years. The present study shows that the concentration of soil Kex needed to achieve maximum yield is no greater than that required in the 1970s (see review by Christenson & Draycott Reference Christenson, Draycott and Draycott2006). There are few reasons, therefore, to modify the current UK recommendations for K fertilizer use to achieve these targeted higher yields.
The lack of response to freshly applied K fertilizer in the present study – even on soils of low Kex concentration – is consistent with the findings from recent fertilizer-response trials on commercial fields (Bee et al. Reference Bee, Jarvis and Armstrong1997; Armstrong et al. Reference Armstrong, Jarvis, Milford, Bellet-Travers and Leigh1998). Reasons for the lack of response may be that much of the applied K remains poorly distributed within the soil or becomes rapidly equilibrated into less readily available pools within the lattices of the clay fraction of the soil during the early stages of growth when it is most required (Anon. 1997a, 2006a, b). Sugar beet grown at Rothamsted on plots with a low soil K Index seemingly took up less than half, and those on high K Index plots less than a tenth, of freshly-applied fertilizer K and most of that taken up was used to support the growth of the shoot and not the storage root. For these reasons, the application of potash to sugar beet should be regarded as part of a longer-term strategy to raise or maintain soil Kex at suitable levels rather than as a means of immediately increasing beet yields (Anon. 2006c).
The current recommendation for K fertilizer use on UK sugar beet being grown on K Index 0 or 1 soil is to replace the K removed in the harvested beet and, where the soil contains sufficient clay for it to be practicable, to apply extra K to raise the soil K Index to 2–. On a K Index 2 soil, only the K removed in the harvested beet needs to be replaced, and no K needs be applied to soils that are at K Index 3 and above (MAFF 2000; Anon. 2002). As sugar-beet tops are now routinely ploughed back into the soil after harvest, growers need only two pieces of information to apply these recommendations: knowledge of (a) the K status of the soil – which normally entails sampling and chemical analysis and (b) the quantity of K removed in the harvested beet. Relationships have emerged from the present study which, when used in conjunction with factory tarehouse data, provide growers with field-specific information on both of these aspects of K fertilizer use.
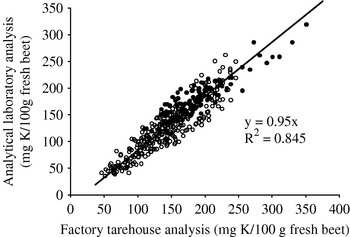
Until now, it has only been possible to estimate approximately the amount of K removed in harvested beet by assuming that each tonne of beet contains the equivalent of 1·7 kg K2O (Anon. 1997b; MAFF 2000; Hollies et al. Reference Hollies, Draycott and Chambers2001). This value is, unfortunately, extremely variable. In the present experiments, for instance, the ratio varied from 0·8 to 2·0 kg K2O/t depending on the K status of the soil (Table 2), and from 0·6 to 3·6 kg K2O/t in commercial crops (P. J. Jarvis, unpublished data). The present study has, however, shown that although the methodologies differ in some respects, of beet K concentrations measured in factory tarehouse laboratories correlate well with those measured using by the standard chemical methods of the analytical laboratory (Fig. 7). Provided growers schedule deliveries of their beet to relate to specific fields, factory-tarehouse records will, therefore, provide reasonably accurate estimates of the K offtakes in delivered beet (Jarvis et al. Reference Jarvis, Milford, Jones and Barraclough2005). These are now routinely calculated for individual contracts by British Sugar plc and disseminated to growers, along with other contract information, through their BSOn-line internet service (Bee Reference Bee2005).
Correlation between measurements of K concentrations in beet from experimental (○) and commercial (●) crops made using standard analytical laboratory methods and in the factory tarehouse.

Fresh-weight sugar concentrations measured in factory tarehouses can be used to indirectly estimate the water content of the delivered beet (Jarvis et al. Reference Jarvis, Milford, Jones and Barraclough2005) which can be combined with tarehouse measurements of beet K to estimate concentrations of K in the tissue-water of delivered beet. These, in turn, can be used to categorize the K status of the soil from which the beet came using the inverse of the relationship between K in beet tissue water and topsoil Kex shown in Fig. 6. This approach should allow potentially K-deficient soils to be broadly differentiated from those with adequate or more than adequate Kex and so trigger the need for more rigorous soil sampling and analysis. Growers are now also being routinely provided with this feedback via British Sugar's on-line service (Jarvis et al. Reference Jarvis, Milford, Jones and Barraclough2005).
Sodium
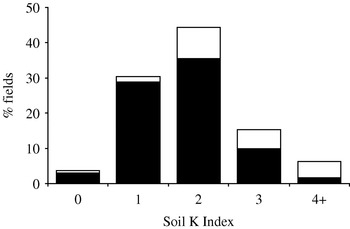
It is currently recommended that Na is applied to all soils except those that already contain an adequate amount, such as fen peats and some silts (MAFF 2000). An application of 200 kg Na2O/ha is recommended for soils that contain less than 20 mg/kg of exchangeable Na, 100 Na2O/ha for soils with 20–40 mg/kg, and none for soils with more than 40 mg/kg (Draycott & Durrant Reference Draycott and Durrant1977; MAFF 2000). Because, until recently, Na fertilizers have generally been cheaper than K fertilizers, most UK sugar-beet crops receive Na, often in addition to K. The most recent British Sugar plc surveys, for instance, show that almost 0·90 of the UK sugar-beet fields at K Index 0 and 1, and over 0·70 of those at K Index 2 and 3 receive an average of 165 kg Na2O/ha (Fig. 8).
Sodium fertilizer use on UK sugar beet. Columns indicate the proportion of UK sugar-beet fields within each soil K Index category and the closed part of each column the proportion of those fields that received Na fertilizer (British Sugar plc, 2004–06 field surveys).

The present study shows that yield responses to applied Na are rare on soils with adequate concentrations of exchangeable soil K because the sugar beet take up very little of the Na. The use of the Na on soils of K Index 2+ and above therefore seems unwarranted unless the concentration of exchangeable soil Na is also exceptionally low (Table 4). The present study also shows that the limiting concentration of exchangeable soil Na at which a response to NaCl fertilizer might be expected is closer to 25 mg/kg (Fig. 5) than the 40 mg/kg limiting concentration that is usually quoted (MAFF 2000; Anon. 2002). Yield responses to applied Na are, therefore, only likely to be obtained on soils that are low in both exchangeable K and Na, as in the present experiment at Woburn in 2005 and those reported by Bee et al. (Reference Bee, Jarvis and Armstrong1997) and Armstrong et al. (Reference Armstrong, Jarvis, Milford, Bellet-Travers and Leigh1998). The current recommendations for Na fertilizer use for UK sugar beet therefore need to be revised.
We thank the field experiment staff of Rothamsted Research and British Sugar plc for the conduct of the experiments, and A. E. Johnston for unstinting advice and comment on the analysis and interpretation of the data. The work was funded by the British Beet Research Organisation. Rothamsted Research receives grant-in-aid from the UK Biotechnology and Biological Sciences Research Council.