1. Introduction
A large literature documents how populations affected by drought or other adverse climatic shocks may turn to migration as a means to cope [Berlemann and Steinhardt (Reference Berlemann and Steinhardt2017), Beine and Jeusette (Reference Beine and Jeusette2018), Cattaneo et al. (Reference Cattaneo, Beine, Frohlich, Kniveton, Martinez-Zarzoso, Mastrorillo, Millock, Piguet and Schraven2019), Hoffmann et al. (Reference Hoffmann, Dimitrova, Muttarak, Crespo Cuaresma and Peisker2020)]. Migration is a potential adaptation option especially in countries where the population lacks formal insurance, or has little access to public safety nets. In this paper, we aim at linking recent research on marriage patterns according to bride price customs with the patterns of migration following drought, exploring its impacts according to the sex and age of the migrants.
In fact, there are gaps in the knowledge of how gender affects climate-induced migration [Chindarkar (Reference Chindarkar2012)]. Existing analyses find different responses for men and women according to cultural contexts. Studies on Ethiopia and Nigeria show that female migration is constrained by variability in temperature or by drought [Dillon et al. (Reference Dillon, Mueller and Salau2011), Gray and Mueller (Reference Gray and Mueller2012)], whereas some studies from Asia and the Caribbean find that women migrate more following higher temperatures or drought [Mueller et al. (Reference Mueller, Gray and Kosec2014), Baez et al. (Reference Baez, Caruso, Mueller and Niu2017a, Reference Baez, Caruso, Mueller and Niub), Thiede and Gray, (Reference Thiede and Gray2017)]. Although clear country-specific differences have been found, the specific mechanisms explaining the heterogeneous effects are not clear. In parallel, a recent literature in development economics documents the role of institutions such as bride price traditions and their impact on socioeconomic outcomes [Corno and Voena (Reference Corno and Voena2017), Ashraf et al. (Reference Ashraf, Bau, Nunn and Voena2020), Corno et al. (Reference Corno, Hildebrandt and Voena2020)]. In particular, Corno et al. (Reference Corno, Hildebrandt and Voena2020) study how drought affects the age of marriage and show differential impacts of the outcome depending on whether the country has a culture of dowry payments or bride prices. Corno and Voena (Reference Corno and Voena2017) find that adverse shocks—measured by rainfall shocks—during teenage years increases the likelihood of early marriage in Tanzania. Evidence such as this is important since it shows the benefits of developing formal insurance or social safety net policies to cope with drought.
The bride price is money or goods paid by a man to a girl's family to secure a bride. Contrary to countries such as India where the bride's family gives money to the bridegroom's family (dowry), bride prizes are frequent in sub-Saharan Africa [Lowes and Nunn (Reference Lowes, Nunn, Anderson, Beaman and Platteau2018)]. In this paper, we use data from Malawi over the period 2000–2016 to investigate how droughts affect men's and women's migration differently, in particular marriage-related migration. In Malawi, a sizeable number of individuals migrate for marriage, as will be seen in the data. The country suffers recurrent episodes of droughts that affect agricultural production and the population's food security. In particular, the drought of 2005 was one of the most severe experienced recently in Malawi, leading the country to declare a state of disaster and a food emergency. According to the Food and Agriculture Organization (FAO), more than 4.2 million people, or around 34% of the population were not able to meet their food needs. Since droughts affect crop yields and the income of families dependent on agriculture, sending family members to live with other relatives or anticipating the marriage of daughters during those shocks could be a way to smooth consumption of the family.
To analyze the impact of drought on women's and men's migration, we construct a retrospective panel on a yearly basis (a panel for individual migrant i from 2000 to 2016 that moves at time t) based on data from the Living Standards Measurement Study-Integrated Surveys of Agriculture (LSMS-ISA) of Malawi. We combine these data with the measures of droughts based on precipitation and temperature from satellite images. Relying on a quasi-experimental design, we compare the probability of an individual in a particular age group migrating from an origin district to a destination district in a particular year, with or without drought. In particular, we explore whether there was an increased probability of migrating for marriage among women aged 10–17. In doing so, we aim to provide more evidence on heterogeneous effects related to gender for climate change induced migration and the risk of drought inducing more child marriages in a country with bride price customs. We also compare the results with women's work-related migration and men's migration for marriage to explore the differences further.
Our results show rather small increases in the probability of women's within-district migration because of marriage following drought (a few percentage points). On the one hand, the results are somewhat optimistic in that we do not find sufficient evidence to reject the null hypothesis of drought not affecting the probability of child marriages. On the other hand, following severe drought, the results show increases in the probability of between-district migration for work-related reasons in the age category of boys (10–17 years old). Severe drought increases the probability of migrating for work by almost 9 percentage points for boys, and by 5 percentage points for girls. Combining both marriage- and work-related migration reasons for girls shows an increase of 2.3 percentage points in migration following severe drought.
The paper contributes to two different strands of the literature. Several household studies have found changes in migration patterns following drought [Gray and Mueller (Reference Gray and Mueller2012), Hirvonen (Reference Hirvonen2016), Kubik and Maurel (Reference Kubik and Maurel2016)]. A previous paper investigating rainfall shocks and migration of household heads in Malawi [Lewin et al. (Reference Lewin, Fisher and Weber2012)] finds that migration is reduced following rainfall shocks. This finding goes in line with other studies from Tanzania [Hirvonen (Reference Hirvonen2016)] and a more recent study from Malawi [Jovanovic et al. (Reference Jovanovic, Alwang and Ricker-Gilbert2019)], that all show evidence of lower rainfall hindering migration through liquidity constraints. Lewin et al. (Reference Lewin, Fisher and Weber2012) use cross-section data from the Second Malawi Integrated Household Survey (IHS2) 2004–2005 together with self-reported assessment of whether the household suffered a weather shock during the last 5 years and data on rainfall variability and past rainfall, whereas Jovanovic et al. (Reference Jovanovic, Alwang and Ricker-Gilbert2019) use panel data from 2009/10 (IHS3) and 2012/13 (IHSP) combined with rainfall data.
Another strand of the literature investigates how marriage patterns may be altered following income shocks. Already in the seminal paper by Rosenzweig and Stark (Reference Rosenzweig and Stark1989), marriage of daughters into districts with uncorrelated weather shocks was seen as a form of insurance mechanism to deal with agricultural income risk.Footnote 1 In line with these results, Hotte and Marazyan (Reference Hotte and Marazyan2019) find in Senegal that parents do within-kin-group (as opposed to outside-kin-group) marriages as a way to insure against adverse income shocks. Hoogeveen et al. (Reference Hoogeveen, van der Klaauw and van Lomwel2011) find some evidence that the marriage of daughters is used as an alternative form of insurance in rural Zimbabwe following drought. The findings are based on data over the period 1994–2000 on 400 households. On the one hand, they find a positive but not significant effect of rainfall levels on the marriage rate. This can be explained as a market supply effect since there are fewer men who can afford to pay the bride price following drought. On the other hand, they find evidence that the marriage rate of daughters in poor households increases following a shock to livestock wealth. They do not focus on the age of marriage and the likelihood of an increased probability of child marriages. The age of the wife is the explicit concern of Corno and Voena (Reference Corno and Voena2017) who find that adverse income shocks in teenage years increases the likelihood of an early marriage among young women in rural Tanzania, a country where bride price customs are common, as in Malawi. Corno et al. (Reference Corno, Hildebrandt and Voena2020) extend this study to several countries in sub-Saharan Africa, where bride prices are common, and to India, where dowry payments are used instead, to show the opposite effects of bride price payments vs. dowry payments on the timing of marriages.
Our paper contributes to the empirical literature on marriage and development in four ways. The first contribution of the paper is to analyze marriage-related migration and the timing of drought in the origin location of the individual, which provides for additional evidence on the impact of drought on migration for marriage. Corno et al. (Reference Corno, Hildebrandt and Voena2020) cannot control for the actual place of residence at the time of the drought, since they use Demographic and Health Survey (DHS) data and detailed information on the timing of marriage but have to assume that the individuals did not move after marriage but before the time of the survey.Footnote 2 The second contribution related to the literature on climate-induced migration is to analyze drought as a push factor driving different types of migration in Malawi, not only for work-related motives, but also for marriage as a way to smooth consumption of the family during droughts. Third, the analysis uses detailed information at the origin and destination districts over more than one and a half decade, exploiting the timing of the drought, unlike previous studies on Malawi. And fourth, it explores whether the type of migration changes depending on how far migrants move, comparing migration within the district of origin with migration between districts.
The remainder of the paper is organized as follows. Section 2 describes bride price customs and migration patterns in Malawi. Section 3 presents the empirical strategy, section 4 describes the data used for the analysis, and section 5 presents the main results. Robustness tests are discussed in section 6. Section 7 gives descriptive evidence on some of the outcomes of marriage-related migration, and section 8 concludes.
2. Background: migration and marriage patterns in Malawi
The bride price is money or goods paid by a man to a girl's family to secure a bride, whether she is willing or not. In Malawi, lobola, the bride price, is customary in patrilineal tribes, frequent in the Northern part of the country, but also in some Southern districts.Footnote 3 In the Karonga district for instance, the Nyakyusa tradition says that if a family is poor and low in status, it can go to a rich man and get a loan, a cow, or money in exchange for their daughter. The practice is called Kupimbira and the girl child is therefore used as a surety. As these practices started to reach the news, creating concern among the population, the Marriage and Family Relations Act was passed on February 12th, 2015, and promulgated into law by the President on April 17th, 2015. The Act raised the legal age of marriage from a minimum age of 15 to 18 for statutory marriage, but under-age marriages keep happening. Also, Malawi's constitution allows for children between 15 and 18 to get married with their parents' and guardians' consent. Hence, a constitutional amendment would be necessary to ban child marriages completely by legal means. In a recent study supported by the UNICEF of almost 7,500 households across the country [Makwemba et al. (Reference Makwemba, Chinsinga, Kantukule, Munthali, Woldegorgis, Haenni and Lin2019)], 9% of the interviewed women were married before the age of 15, while 42% married before the age of 18.Footnote 4 Marriage below 15 is particularly widespread in the Southern region while marriage below 18 is highest in the Northern region.
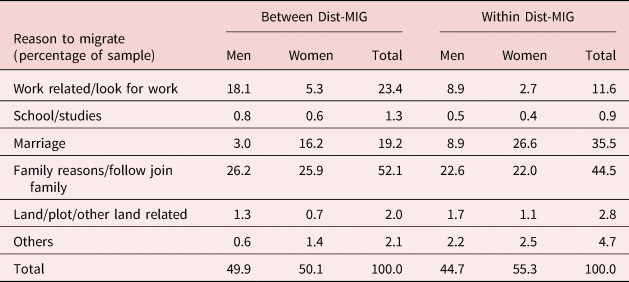
Marriage is often associated with relocation to other villages or towns [Beegle and Poulin (Reference Beegle and Poulin2013)], but Englund (Reference Englund2002) shows that most marriages in Malawi are formed within the woman's district of origin and that most rural–rural migration is for marriages. If the bride price can be paid in several years, it could be that even those affected by the same drought inside the district of origin can pay the bride price later on, hence avoiding the demand side effect for which Hoogeveen et al. (Reference Hoogeveen, van der Klaauw and van Lomwel2011) found evidence in rural Zimbabwe. In the data on Malawi, we note that indeed, women migrate predominantly within the district of origin for marriage, as seen in Table 1. Table 1 describes the different reasons to migrate reported by the household head (or the spouse of the household head) for each individual, separated by between-district and within-district migrants.Footnote 5
Reasons to migrate for the different types of migrants

Source: Created based on the LSMS-ISA information. A few migrants have missing information on the reason to migrate. Initial categories were re-classified in these six categories. Migrants established only one reason to migrate.
The categories were re-classified into only these six groups, to assemble categories that were more similar, such as those related to work or migrants moving for family reasons, for instance. The numbers here coincide with the migrants reported in Table 21 in the Appendix, with a few missing observations. The main reasons to migrate are: to join family, followed by marriage, and work-related. For between-district migrants, 23.4% move for work and 52.1% to join relatives, and 19.2% for marriage reasons. Among the within-district migrants, migrating for family reasons-follow family is the main category with 44.5%, followed by marriage with 35.5% of migrants, and for work with 11.6% (see Table 1). Among those moving for marriage in Malawi, two-thirds correspond to within-district migrants while one-third are between-district migrants (see Table 1).
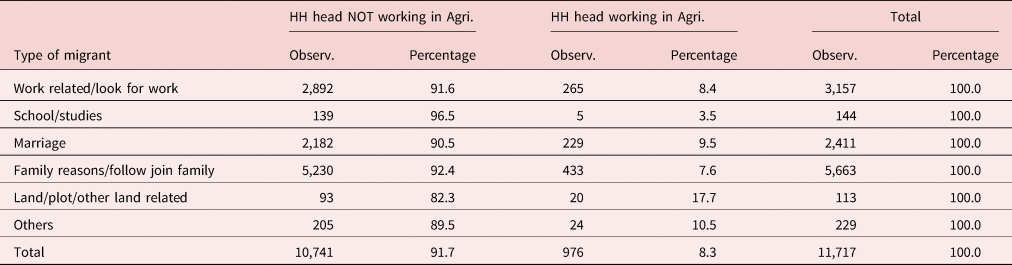
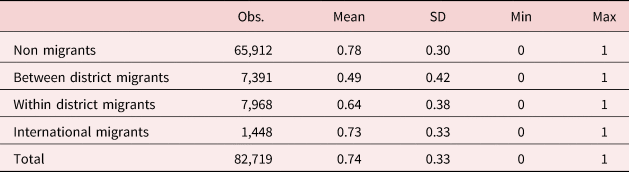
Marriage-related migration, and migration in general, is only one coping mechanism for drought. Several ex ante risk-management and ex post risk-coping strategies are used by households living in risky environments. Among the main ex ante risk-management strategies are informal insurance through networks, self-insurance in the form of savings, and income diversification in the same locality. In the Malawi sample, solidarity mechanisms through transfers account for only 5% of total household income, on average, as shown in Table 23 in the Appendix. In the case of covariate shocks such as drought, ex ante informal insurance and local income diversification have been shown to be ineffective [Dercon (Reference Dercon2002, Reference Dercon2005)]. Ex post, drawing down on assets such as livestock may not be sufficient either [Kazianga and Udry (Reference Kazianga and Udry2006)], and in the absence of public safety nets, migration is often the main risk-coping mechanism in poor countries. Tables 2 and 3 provide indications that migration is used as a coping mechanism following drought. Table 2 shows that around 90% of heads of households that receive migrants in the destination district work outside of agriculture. Table 3 provides further evidence that migrants tend to depend less on agriculture in the destination district: for between- and within-district migrants, 49% and 64% of total income is agricultural income, respectively, compared to the non-migrant average of 78%. The descriptive statistics of households with no migrants depending more on agricultural income than households with migrants, together with the fact that migrants go to households in destination that have a higher percentage of non-agricultural income (see Table 24 in the Appendix), indicate that migrants pursue activities less affected by drought after moving and may use migration to mitigate drought impacts.
Household head works in agricultural activities in the destination (by type of migrant)

Note: The table includes only migrants for whom the information was reported.
Percentage of agricultural income in the household by person in destination (by type of migrant)

Note: The table includes only those for whom the information was reported. Only for survey 2004–2005 and 2010–2011.
3. Empirical strategy
Identification is based on a quasi-experimental design that compares the probability of migration for individuals in specific age groups having been affected or not by drought. Similar to the approach in Baez et al. (Reference Baez, Caruso, Mueller and Niu2017a), the identifying assumption is that individuals in different districts but in the same age category would have similar migration probabilities in the absence of drought, given controls for education, sex, and district fixed effects and time trends. Such a quasi-experimental identification strategy relies on differences in migration propensities across age groups [Hatton and Williamson (Reference Hatton and Williamson2003)]. In particular, for a sample of African countries, including Malawi, FAO (2016) records that 60–70% of migrants are between 15 and 34 years old. Previous analyses of climate and migration have also found important heterogeneity in the migratory responses according to age [Baez et al. (Reference Baez, Caruso, Mueller and Niu2017a, Reference Baez, Caruso, Mueller and Niub)]. We estimate the following specification:

The dependent variable $M_{_{i, a, od, t, s} }$ is equal to 1 when individual i of age group a, migrated from district o to district d at time t, as recorded in survey s, and zero for all the years when the individual did not move. The dummy variable $ drought_{o, t} $
 equals 1 if a drought occurred in the district based on the standardized precipitation index (SPI) constructed from satellite images [Funk et al. ((Reference Funk, Peterson, Landsfeld, Pedreros, Verdin, Shukla, Husak and J.2015)].
Age a is a vector of five age groups at the time of migration (10–17, 18–27, 28–37, 38–47, 48–57, where we have excluded children below 10 and individuals above 57 years old); the coefficients δ a thus capture age fixed effects that influence migration. X i,d,t is a vector of individual control variables such as sex and whether the individual has primary schooling or not.Footnote 6
Migration costs are proxied by the distance between district o and district d, C od. The specification also includes fixed effects by survey-time ϕ s,i, since a migrant is recorded in the survey in year s, but the migration took place in time t, time-invariant origin-district and destination-district characteristics (ψ o and ψ d) to capture additional attracting factors of the destination district d and push factors in the origin district o. λ t are the time fixed effects. The variable ɛ i,a,od,t,s denotes the residuals, and standard errors are clustered by district of origin.Footnote 7
Previous analyses have shown that the impact of drought is ambiguous [Millock (Reference Millock2015)]. On the one hand, β > 0 since droughts push migrants out of the district in search of better conditions for agriculture elsewhere, or make them migrate within-district to the non-agricultural sector. On the other hand, migration is costly, and between-district migration more so than within-district migration, and the effect of drought could be to decrease the probability of migration, i.e., β < 0 [Henry et al. (Reference Henry, Schoumaker and Beauchemin2004a, Reference Henry, Piche, Ouedrago and Lambinb)]. As regards the interaction with age, γ a should indicate a positive probability of migration for the age groups 18–27 and 28–37, compared to the reference group of individuals aged between 48 and 57 years.Footnote 8
The net effect of drought on the probability of migration of children in the age group 10–17 is given by the estimate of β + γ 10−17. The coefficient γ 10−17 on its own measures the expected change following drought in the probability of migration of children in the age category 10–17 compared to the reference group aged 48–57:

The estimations are done both with a linear probability model and with a probit model. The specification in equation (1) assumes an idiosyncratic error term. Using a factor error model instead helps to control for any missing variables that could make the migratory response to drought vary over time and district. Examples of such common shocks could be low-level conflicts, the development of industry which would give alternative employment possibilities, or changes in infrastructure and policy that help cushion the impact of drought on agricultural households. In the case of Malawi, the Malawi Social Action Fund (MASAF) safety net program payments could be one such time-varying factor that is specific to some districts and that makes the drought response interdependent across districts.Footnote 9 In the ordinary least squares (OLS) estimations, we will thus use the interactive fixed effects approach [Bai (Reference Bai2009)] to account for common correlated effects.
4. Data
4.1 Migration
We use the Living Standards Measurement Study-Integrated Surveys on Agriculture (LSMS-ISA), implemented by the World Bank, jointly with national governments of Sub-Saharan African countries. The data give detailed information of migration movements with the districts of destination and origin and are nationally representative of Malawi.Footnote 10 Since the country did not experience wars or severe conflict during the period analyzed, it enables us to identify more clearly the impact of drought on migration.
The LSMS-ISA surveys were conducted taking into account two agricultural seasons. As the rainy season in Malawi goes from November to May in general,Footnote 11 the Integrated Household Panel Survey (IHPS) 2013 was conducted between April 2013 (post-planting period) and October 2013 (post-harvest).
As the time-line of the surveys shows (see Figure 2 in the Appendix), they were conducted in similar periods in order to capture the different agricultural seasons and make them comparable. This allows us to construct comparable measures at the level of district by year during the entire period.
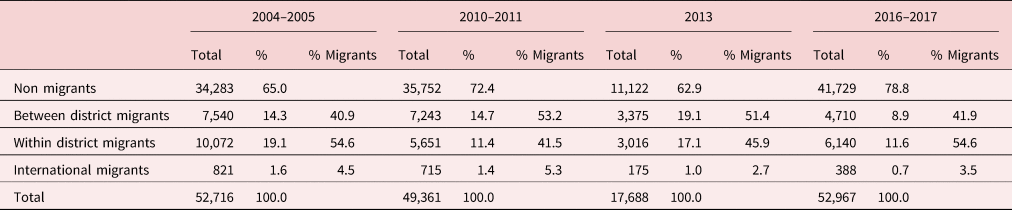
The LSMS surveys provide two types of questions related to migration: (a) in which region/district/country the person was born and (b) in which region/district/country the person lived before moving there. Both questions are the same for the different waves, stating also the number of years the individual has been living there and how many years ago the migrant moved.Footnote 12 We use option (b) to define migration. Table 4 shows the total number of migrants and non-migrants by survey. Internal migration is divided into within-district migrants and between-district migrants.Footnote 13 In Malawi, international migrants account for a small fraction of the total of migrants (around 3–5% of migrants in Table 4). The numbers of internal migrants are large, with a smaller share of total migration in 2016–2017 (around 21% of the total sample of individuals in that year, see Table 4). The size of within-district and between-district migration flows changes across the different waves, showing variability over time (see Table 4). The majority of movements have rural origin, rather than urban: 76.1% moved from villages in other districts (between-district) and 82.1% moved from villages in the same district (within-district).Footnote 14
Total number of migrants by survey

Source: Own calculations based on LSMS surveys.
LSMS Malawi 2004–2005 does not have information on district of origin for between district migrants. The table includes duplicate migrants appearing in more than one wave. They are dropped in the main analysis to arrive at a sample of migrants as in Table 21.
Although a migrant is recorded in the year of the survey s, her migration decision was taken in the year of movement.Footnote 15 As the surveys ask for the year of movement and record the year and month of the interview, we can track down more precisely the year of migration. In order to avoid double counting of migrants, we discard repeated cases when a person is recorded as migrant in wave s and in a wave before, but reported the same origin of district. Those are movements of the same person captured in more than one wave, so we will count only the last registration in the surveys. Table 21 in the Appendix has a more detailed description of the number of migrants used in the analysis by origin and by destination, which excludes those duplicate migrants (Table 4 includes them). Unfortunately, the LSMS-ISA 2004–2005 did not collect information on the district of origin for the between-district migrants and they cannot be included in the between-district analysis.
4.2 Drought measures
We measure drought using standardized indices calculated from gridded satellite data.Footnote 16 Two measures are extensively used in the literature to capture droughts: the SPI proposed by McKee et al. (Reference McKee, Doesken and Kleist1993) and the standardized precipitation–evapotranspiration index (SPEI) of Vicente-Serrano et al. (Reference Vicente-Serrano, Beguería and López-Moreno2010).
The SPI measures the number of standard deviations that observed cumulative precipitation deviates from the average and it can be calculated for any monthly time scale; it considers the long-term time series of precipitation accumulated over the desired time scale to estimate an appropriate probability density function. The method entails a transformation of the frequency distribution (e.g., Gamma, Pearson III, etc.) to another frequency distribution (normal, or Gaussian). A long period of data is necessary for the calculation (longer than 30 years is desirable). Compared to the SPI, the SPEI incorporates temperature data also. Thus, the SPEI is based on a climatic water balance determined by the difference between precipitation and potential evapotranspiration (PET) for each month in each location. It thus combines the changes in evapotranspiration demand of air temperature fluctuations and trends with the multiple temporality of the SPI. In both cases, the SPEI and SPI range from around −3 to 3, with lower values of the index being associated with more intense droughts and higher values with more rainfall.
A potential source of weather data to calculate both the SPI and the SPEI is the data from the Climatic Research Unit of the University of East Anglia with monthly information since 1900 to 2016 and for an extensive sample of variables such as precipitation, vapor pressure, PET, etc. [Harris and Jones (Reference Harris and Jones2017)]. Unfortunately, the resolution of this data is of only 0.5 × 0.5 degree—around 50 km × 50 km at the Equator—and the construction of drought indices for the size of the districts in Malawi will not capture correctly spatial variability of the districts which have an average size of 54.3 km × 54.3 km.Footnote 17 For these reasons, we use the satellite images of the Climate Hazards Group InfraRed Precipitation with Station data (CHIRPS) which provide information of rainfall from 1981 to 2016 at a higher resolution of 0.05 × 0.05 degree—around 5 km × 5 km at the Equator [Funk et al. ((Reference Funk, Peterson, Landsfeld, Pedreros, Verdin, Shukla, Husak and J.2015)]. Figure 3 in the Appendix also shows that the average temperature in the country stayed relatively stable during the period of analysis so there should be less need to adjust the drought measure by temperature changes and the SPI will be our preferred measure.Footnote 18
We used ArcGIS and Google Earth Engine to manipulate the raster images, calculate the averages of precipitation at the level of district and by month, and generate some additional maps with the help of the Python platform within the software. The drought indices are calculated using R-software and the package provided by Vicente-Serrano et al. (Reference Vicente-Serrano, Beguería and López-Moreno2010) and Beguería et al. (Reference Beguería, Vicente-Serrano, Reig and Latorre2014), which allows us to generate the SPI by months and for different locations (in this case, districts). Several monthly scales were calculated representing the number of months that the water deficits accumulate. Figure 4 in the Appendix shows the SPI using the CHIRPS data for the monthly scale 12 and 24, where the annual observation corresponds to the average during the agricultural growing season, from November of the previous year until March of that year, as in Asfaw and Maggio (Reference Asfaw and Maggio2017).Footnote 19
4.3 Socio-economic characteristics and other covariates
The analysis includes controls for the sex of the migrant (one for female, zero otherwise) and whether the individual has primary education or not. It also includes a variable of the distance between the district of origin and the district of destination as a proxy for the migration costs that the migrant would have faced. We use the Vincenty measure of Nichols (Reference Nichols2003) for the distance between districts. This measure takes into account geodesic distances between a pair of points on the surface of the Earth (specified in signed decimal degrees latitude and longitude), using an ellipsoidal model of the Earth. Alternative measures using the Euclidean distance gave very close results.
4.4 Summary statistics
The final sample consists of 127,000 individual-year observations of between-district migration and 182,000 individual-year observations of within-district migration.Footnote 20 Table 25 in the Appendix presents the balance table for the data measuring drought using the SPI for the 309,000 individual-year observations of the sample. The migrants in a drought year and the migrants in a non-drought year display no significant differences apart from rainfall, which we control for in the estimations using the drought indicator. This holds for both between-district and within-district migration.
5. Results
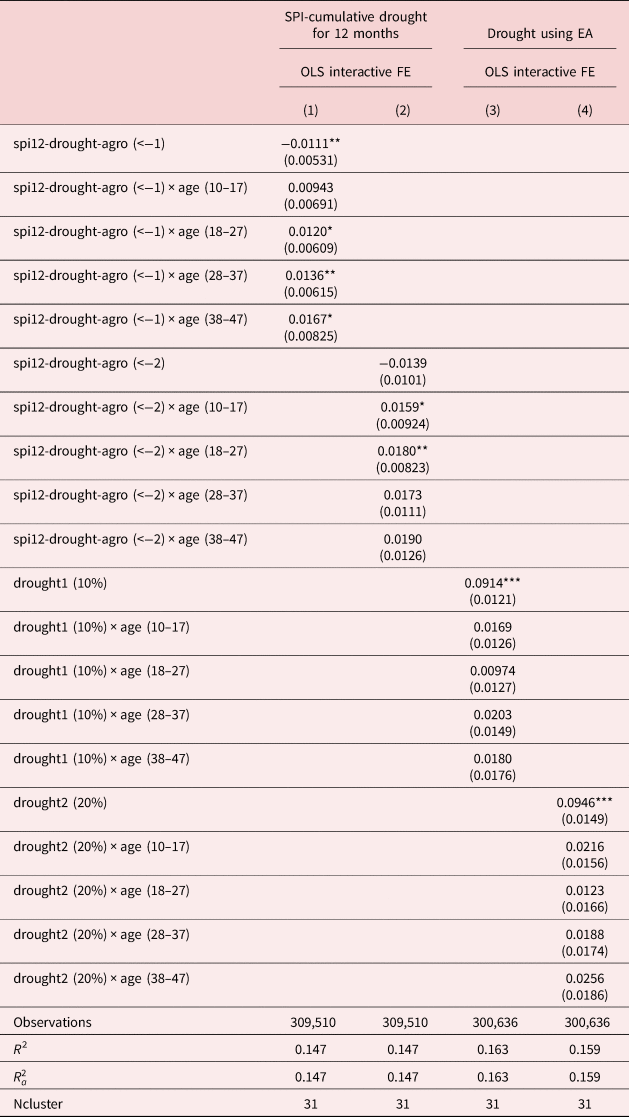
Before investigating the gender effects of migration, we start by showing the aggregate response of migration in Malawi to weather shocks, which goes in line with previous studies of liquidity constraints for migration. Table 5 shows all migration, for both men and women, with the drought measure based on the SPI presented in columns (1) and (2) and the measure based on the community surveys in columns (3) and (4). We show only the results from the estimations using interactive fixed effects, since the purpose of Table 5 is to underline the difference in conclusions between the two drought measures. The estimations based on the community survey measure show a significant increase in the probability of migration when drought was reported by the community chief in at least 20% (or 10%) of the enumeration areas in the origin district. This push effect of drought is not different according to age category [columns (3) and (4)]. Using the SPI measure of drought instead shows evidence that drought decreases the probability of migration, in line with evidence on liquidity traps [Hirvonen (Reference Hirvonen2016), Bazzi (Reference Bazzi2017)], but only for moderate droughts (SPI below −1) which are more frequent in Malawi according to the data [column (1)]. These results also show differences according to age category, with a small positive net effect in the age interval 28–37 years, and a negative or marginally significant net effect for other age categories. Since the drought measure based on community surveys in the enumeration area is less precise, due to the need to aggregate the measure at the district level, and the threshold for drought may seem ad hoc (10 or 20%), we prefer to interpret the results based on the SPI measure only, from now on. The results based on this measure are also in line with previous evidence of liquidity constraints for migration in Malawi [Lewin et al. (Reference Lewin, Fisher and Weber2012)] and in Tanzania [Hirvonen (Reference Hirvonen2016)].
Between and within district migration

*p < 0.10, **p < 0.05, *** p < 0.01.
Standard errors in parentheses.
Notes: The table includes dummies for year, district of origin, district of destination, and for survey, as well as controls for education and sex (in the case it is relevant).
Enumeration area is the lower level of district in Malawi.
drought1 (10%) is a dummy equal to 1 if a drought is reported in 10% or more of the enumeration areas.
drought2 (20%) is a dummy equal to 1 if a drought is reported in 20% or more of the enumeration areas.
spi12-drought-agro ( < −1) is a dummy equal to 1 if the SPI (accumulated over 12 months) takes values below −1 during at least 1 month of the agricultural growing season.
spi12-drought-agro ( < −2) is a dummy equal to 1 if the SPI (accumulated over 12 months) takes values below −2 during at least 1 month of the agricultural growing season.
Baseline category of age: 48–57. Age <10 and Age >57 are excluded. Distance or Vincenty-distance calculated using geodesic distances between a pair of points on the surface of the Earth. Standard errors clustered at origin-district. Standard deviations in parenthesis.
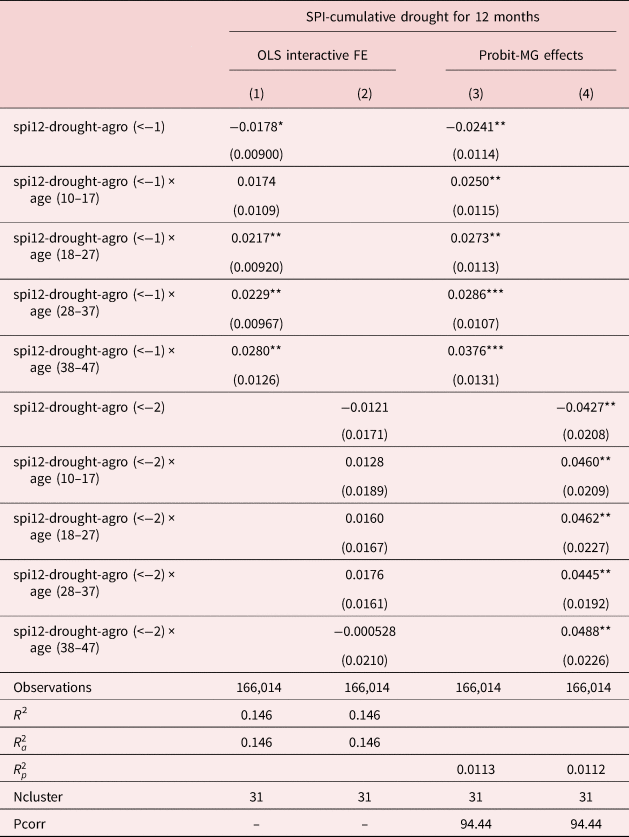
Our specific objective is to understand how women's migration responds to drought and, in particular, to investigate the risk of child marriages following drought. Table 6 shows the probability of female migration overall, without distinguishing between- and within-district migration, and for all reasons of migration. The sample is now 166,014 migrants, around half of the full migrant sample. The explanatory power of the OLS interactive fixed effects model is 14.6%.Footnote 21 The proportion of correctly predicted outcomes in the probit model is 94%. Table 6 shows that the general effect of drought on the reference group of women aged 48–57 years is to constrain migration rather than increasing it. When adding the marginal effectFootnote 22 of each age category compared to the reference group, we see small increases in the probability of migration, in particular in the older age intervals for moderate drought, but with significant effects also in the age intervals 10–17 and 18–27 for severe droughts (with the SPI below −2). The effects are not large, although. Based on the marginal effects of the probit estimation [columns (3) and (4)], the increase in the probability of migration following a severe drought is 0.35 percentage points in the age intervals 18–27 and 0.18 in the age interval 28–37. For girls in the ages 10–17, the marginal effect of a severe drought is a 0.33 percentage point increase in the probability of migration, and only a 0.09 percentage point increase following moderate drought.
Between and within district migration—women

Standard errors in parentheses.
*p < 0.10, **p < 0.05, *** p < 0.01.
Notes: The table includes dummies for year, district of origin, district of destination, and for survey, as well as controls for education and sex (in the case it is relevant).
spi12-drought-agro ( < −1) is a dummy equal to 1 if the SPI (accumulated over 12 months) takes values below −1 during at least 1 month of the agricultural growing season.
spi12-drought-agro ( < −2) is a dummy equal to 1 if the SPI (accumulated over 12 months) takes values below −2 during at least 1 month of the agricultural growing season.
Baseline category of age: 48–57. Age <10 and Age >57 are excluded. Distance or Vincenty-distance calculated using geodesic distances between a pair of points on the surface of the Earth. Standard errors clustered at origin-district. Standard deviations in parenthesis.
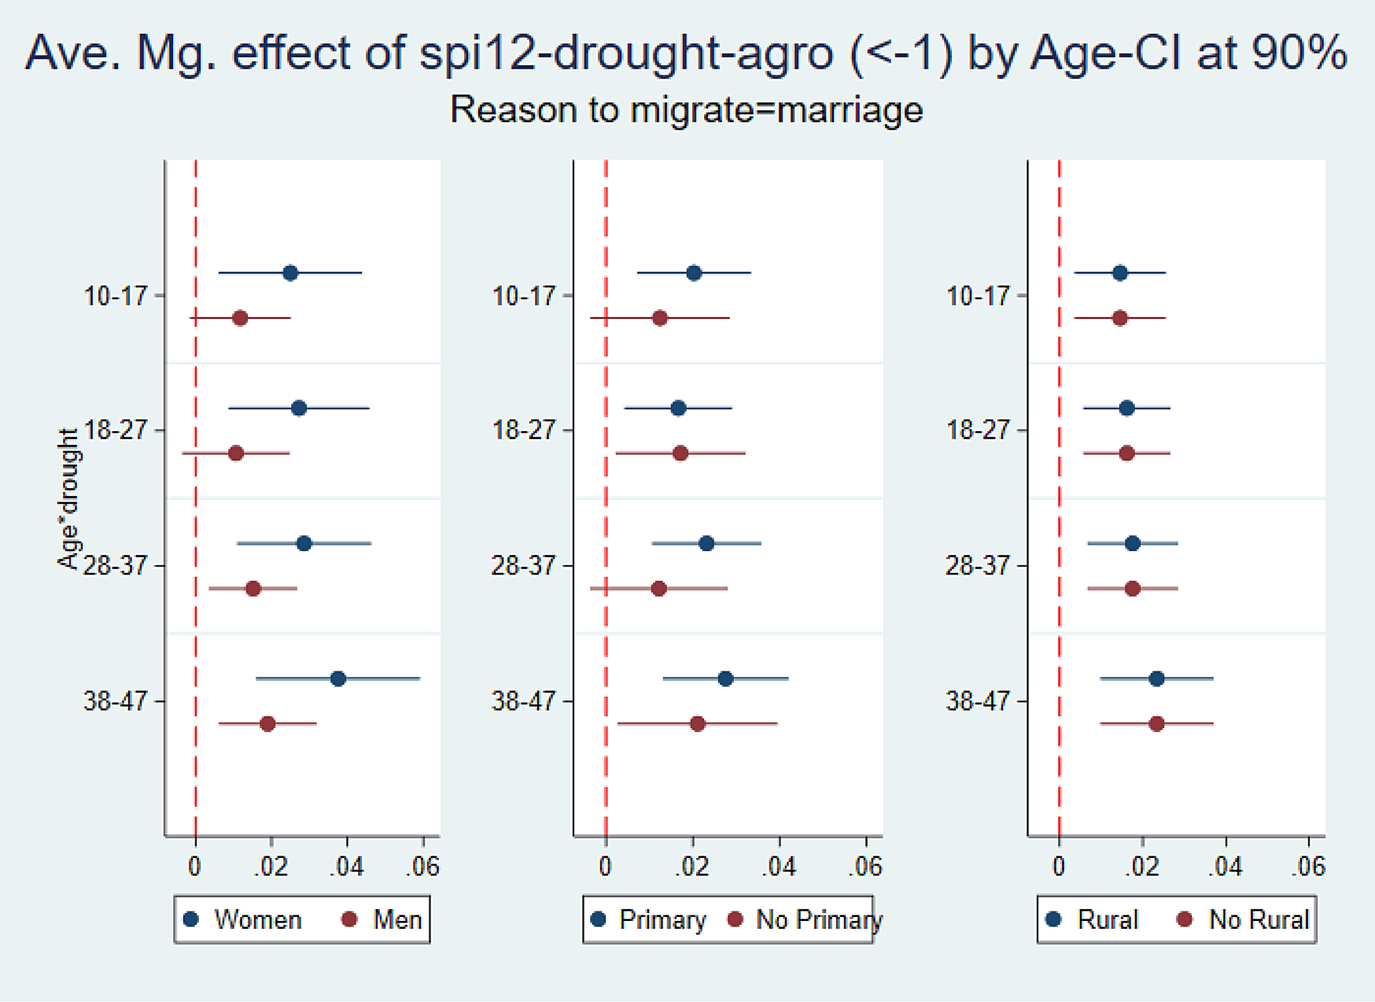
Figure 1 shows the marginal effects of women's and men's migration for marriage following moderate drought. Although there are no differences between migrants from rural vs. urban districts, one clearly sees the higher probability of migration for individuals with primary education compared to those without such education. But above all, Figure 1 shows the small increase in women's marriage-related migration following drought and the even more modest impact of drought on men's marriage-related migration, with no evidence of a different impact on marriage-related migration in the lowest age group of women compared to the older age intervals.
Average marginal effects by different categories (migrating for marriage). Source: Created using the spi12-drought-agro( < −1), which is a dummy equal to one if the SPI (accumulated over 12 months) takes values below −1 during at least 1 month of the agricultural growing season. Baseline category of age: 48–57. Age <10 and Age >57 are excluded. Results for a probit model for between and within migrants and migrating for marriage. The first figure corresponds to the punctual estimations restricting for women (blue) and men (brown). The same holds for primary–no primary and rural–no rural.

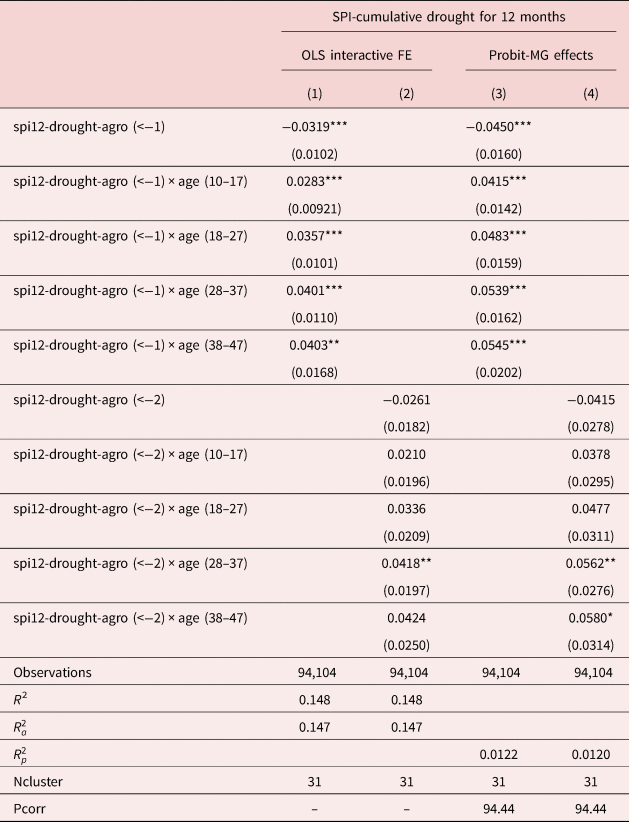
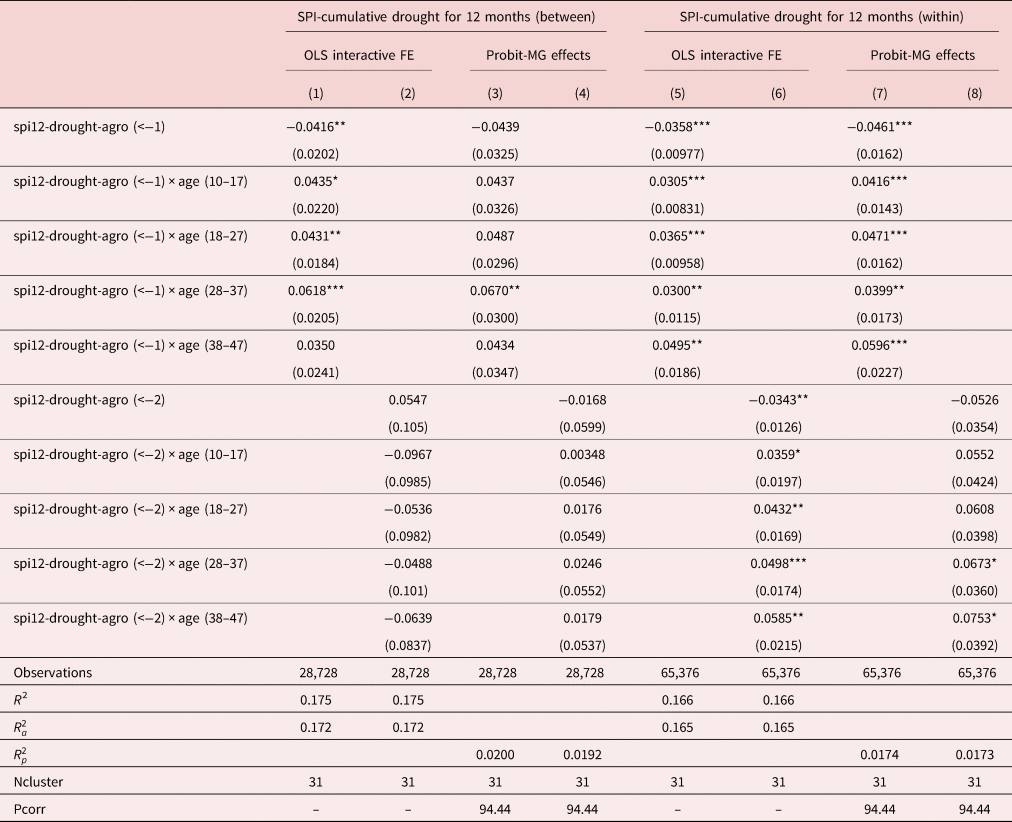
If we constrain the sample to women's marriage-related migration only, there is a significant increase in the probability of marriage-related migration in the age intervals above 18 years following moderate drought, ranging from 0.3 to 0.9 percentage points (Table 7). But any hypothesis of an increase in marriage-related migration of children following drought can be rejected according to these estimates, since we actually see a small but significant net reduction of 0.35 percentage points in the probability of marriage-related migration in the age interval 10–17.
Between and within district migration—women migrating for marriage (reason 3)

Standard errors in parentheses.
*p < 0.10, **p < 0.05, *** p < 0.01.
Notes: The table includes dummies for year, district of origin, district of destination, and for survey, as well as controls for education and sex (in the case it is relevant).
spi12-drought-agro ( < −1) is a dummy equal to 1 if the SPI (accumulated over 12 months) takes values below −1 during at least 1 month of the agricultural growing season.
spi12-drought-agro ( < −2) is a dummy equal to 1 if the SPI (accumulated over 12 months) takes values below −2 during at least 1 month of the agricultural growing season.
Agricultural growing season from November to March. Baseline category of age: 48–57. Age <10 and Age >57 are excluded. Distance or Vincenty-distance calculated using geodesic distances between a pair of points on the surface of the Earth. Standard errors clustered at origin-district. Standard deviations in parenthesis.
To investigate this result further, we separate marriage-related migration outside and within the woman's district of origin in Table 8. Here we see strong evidence of the effect coming only from within-district migration, with little effect of drought on between-district migration for marriage. This goes in line with the literature showing that women in Malawi migrate for marriage mainly within the district of origin [Beegle and Poulin (Reference Beegle and Poulin2013)]. The marginal effects from the probit model show a decrease in marriage-related within-district migration of children in the age interval 10–17 of 0.45 percentage points following moderate drought [column (7)]. The negative effect of drought on marriage-related migration of children could potentially be interpreted as evidence of a marriage-market equilibrium effect. If marriage-related migration is mainly local, and all households are affected by a covariate weather shock, then fewer grooms will be able to pay the bride price.Footnote 23 This interpretation is supported by the fact that between-district migration displays no significant change following drought in the same age-category. There is also a reduction by 0.62 percentage points in the probability of marriage-related migration within the district for women in the age interval 28–37 following moderate drought. The probability of within-district migration for marriage increases in the other age categories, with the marginal effect ranging from 0.10 to 1.35 percentage points.
Between and within district migration (split sample)—women migrating for marriage (reason 3)

Standard errors in parentheses.
*p < 0.10, **p < 0.05, *** p < 0.01.
Notes: The table includes dummies for year, district of origin, district of destination, and for survey, as well as controls for education and sex (in the case it is relevant).
spi12-drought-agro ( < −1) is a dummy equal to 1 if the SPI (accumulated over 12 months) takes values below −1 during at least 1 month of the agricultural growing season.
spi12-drought-agro ( < −2) is a dummy equal to 1 if the SPI (accumulated over 12 months) takes values below −2 during at least 1 month of the agricultural growing season.
Agricultural growing season from November to March. Baseline category of age: 48–57. Age <10 and Age >57 are excluded. Distance or Vincenty-distance calculated using geodesic distances between a pair of points on the surface of the Earth. Standard errors clustered at origin-district. Standard deviations in parenthesis.
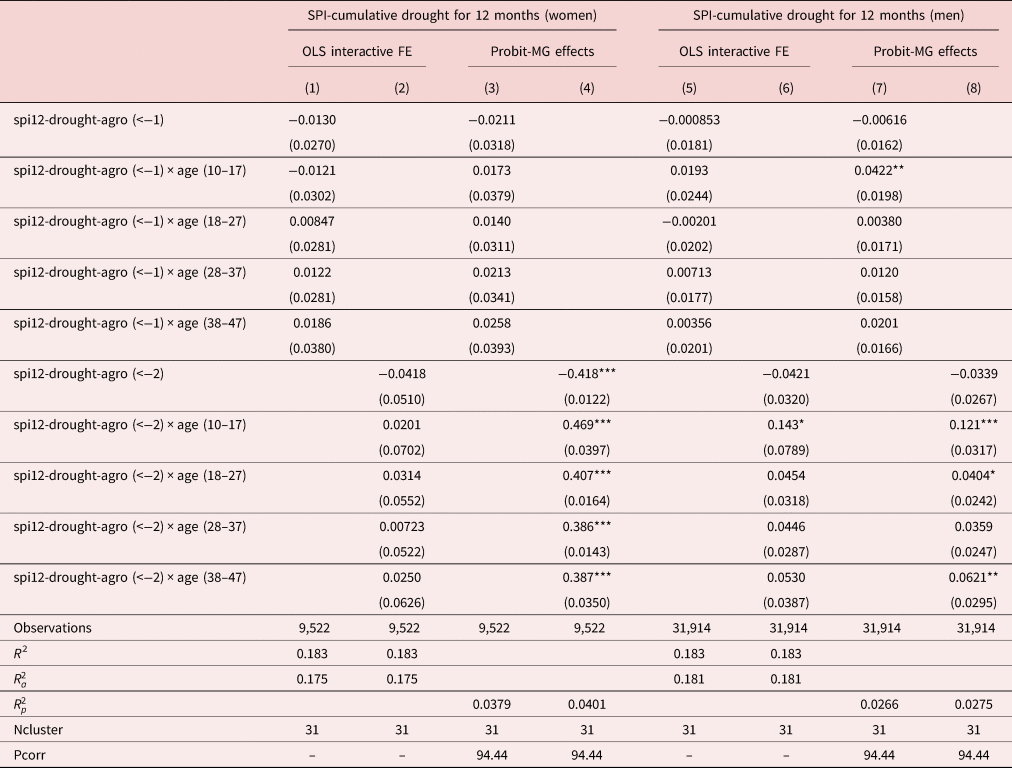
These results should be compared with the effect of drought on women's work-related migration. The sample is now much smaller, since women migrate mainly for marriage. Table 9 shows that only severe drought increases women's work-related migration [column (4)]. The marginal net effect for girls in the age interval 10–17 is a 5.1 percentage point increase in the probability of work-related migration between districts. For all other age intervals the marginal effect of drought is to reduce the likelihood of migration. This result indicates potential migration of children for work reasons or, possibly, a mix of marriage and work-motivated reasons for women's migration, something we probe further in Table 11.
Between district migration—women and men migrating for work (reason 1)

Standard errors in parentheses.
*p < 0.10, **p < 0.05, *** p < 0.01.
Notes: The table includes dummies for year, district of origin, district of destination, and for survey, as well as controls for education and sex (in the case it is relevant).
spi12-drought-agro ( < −1) is a dummy equal to 1 if the SPI (accumulated over 12 months) takes values below −1 during at least 1 month of the agricultural growing season.
spi12-drought-agro ( < −2) is a dummy equal to 1 if the SPI (accumulated over 12 months) takes values below −2 during at least 1 month of the agricultural growing season.
Agricultural growing season from November to March. Baseline category of age: 48–57. Age <10 and Age >57 are excluded. Distance or Vincenty-distance calculated using geodesic distances between a pair of points on the surface of the Earth. Standard errors clustered at origin-district. Standard deviations in parenthesis.
Table 9 also shows a similar pattern for men's between-district migration for work reasons, which also increases following drought in the youngest age interval [columns (7) and (8)].Footnote 24 Following a moderate drought, the work-related migration of boys increases by 3.6 percentage points, and by 8.7 percentage points following severe drought. The finding of an increase in the migration of children for work reasons following drought adds to the evidence of the negative social consequences of drought. It could potentially indicate that child labor is used as an ex post coping mechanism following drought.Footnote 25
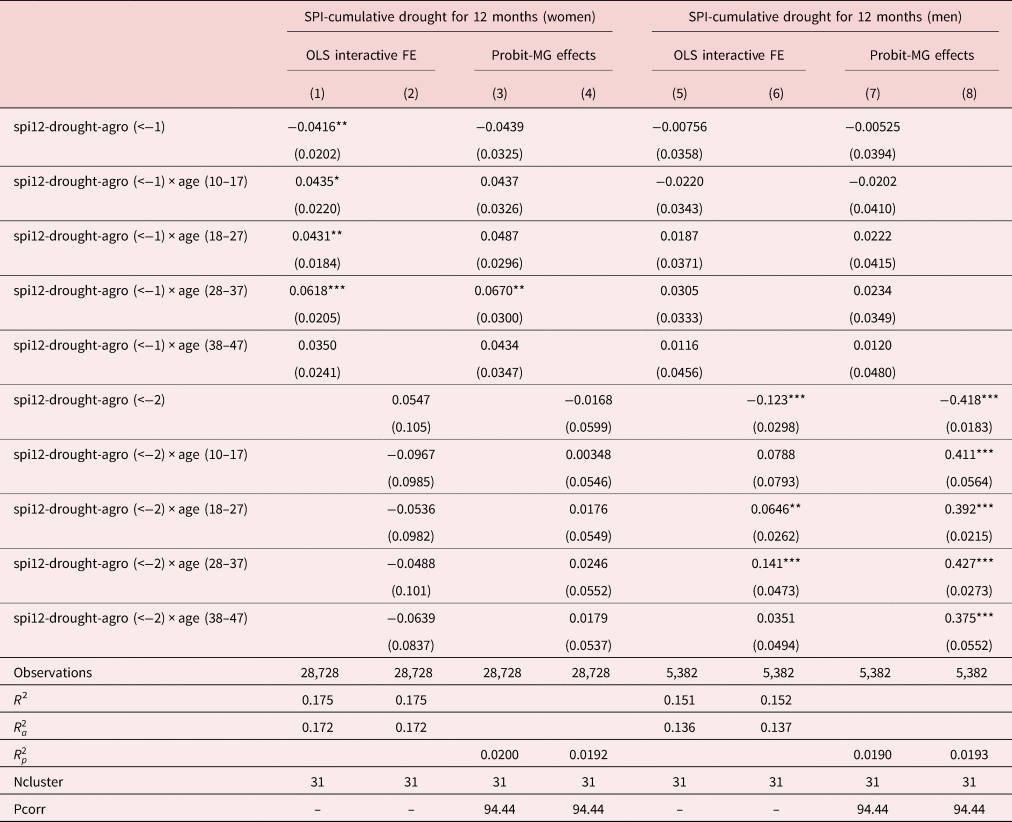
To check that it is mainly women's marriage-related migration that is affected by drought, Table 10 shows that men's marriage-related migration across districts is affected only by severe drought. Note the small sample size, though, for male marriage-related migration between districts (5,382 individuals). These estimations cannot be used to test a marriage-market equilibrium effect either, since they concern male migration for marriage-related reasons, which would not be compatible with patrilocality and bride price customs (under which it is the bride who moves to the groom's family). The small number of men moving between-district for marriage compared to women—as well as within district—reflects the prevalence of patrilocality today in Malawi. Robinson and Gottlieb (Reference Robinson and Gottlieb2021) notes that the Chewa in Northern Malawi and in the Western parts of Central Malawi, despite being matrilineal traditionally, practice patrilocality today. We do note much smaller effects of drought on men's marriage-related migration, though: a net increase of 0.9 percentage points following severe drought in the age interval 28–37 only [column (8)], with drought reducing the probability of marriage-related migration for all other age intervals. The net effect on marriage-related migration of boys in the age interval 10–17 is also close to zero, with a reduction of 0.7 percentage points. Most marriage-related migration occurs within districts, although. Table 27 in the Appendix compares the previous results on women's marriage-related migration within the district of origin to that of men's, and finds no significant effect on men's marriage-related migration within the district of origin.
Between district migration—women and men migrating for marriage (reason 3)

Standard errors in parentheses.
*p < 0.10, **p < 0.05, *** p < 0.01.
Notes: The table includes dummies for year, district of origin, district of destination and for survey, as well as controls for education and sex (in the case it is relevant).
spi12-drought-agro ( < −1) is a dummy equal to 1 if the SPI (accumulated over 12 months) takes values below −1 during at least 1 month of the agricultural growing season.
spi12-drought-agro ( < −2) is a dummy equal to 1 if the SPI (accumulated over 12 months) takes values below −2 during at least 1 month of the agricultural growing season.
Agricultural growing season from November to March. Baseline category of age: 48–57. Age <10 and Age >57 are excluded. Distance or Vincenty-distance calculated using geodesic distances between a pair of points on the surface of the Earth. Standard errors clustered at origin-district. Standard deviations in parenthesis.
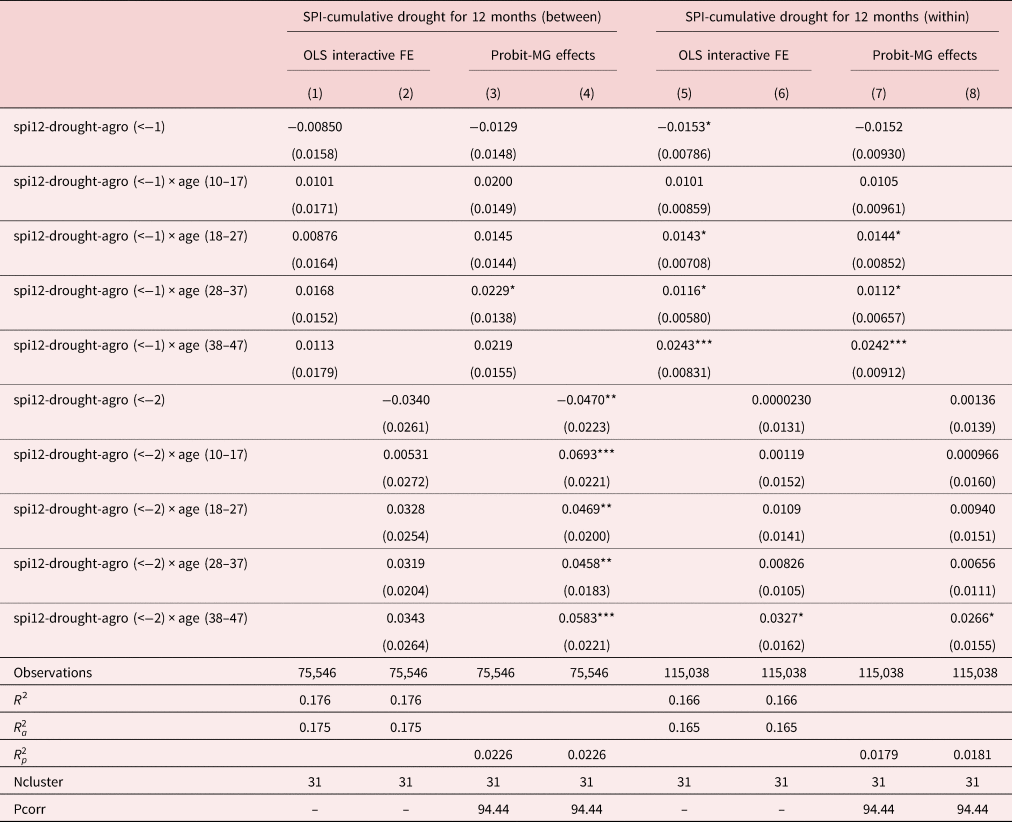
Finally, since the motives for migration may be mixed, and not clearly reported by some household heads (who may be reluctant to give marriage as a reason for under-age children), we do estimations on all female migration related to either marriage or work reasons in Table 11. The estimation results show that severe droughts may increase women's migration for both reasons, but only for between-district migration [column (4)], as expected if a drought-coping mechanism is at work. The effect is large in the age interval 10–17, with a net increase of 2.23 percentage points in the probability of work- and marriage-related between-district migration of women. The only other age interval that displays an increase in the probability of work- and marriage-related migration to another district is the age interval 38–47 years, whereas severe drought reduces the probability of migration for all other age groups. The results could indicate mixed reasons for marriage and work on the husband's farm, but we cannot disentangle the results further. It is thus only when combining the work and marriage-related motives that we find a sizeable increase in the probability of migration of girls aged 10–17 following drought.
Between and within district migration (split sample)—women migrating for marriage (reason 3) and work (reason 1)

Standard errors in parentheses.
*p < 0.10, **p < 0.05, *** p < 0.01.
Notes: The table includes dummies for year, district of origin, district of destination, and for survey, as well as controls for education and sex (in the case it is relevant).
spi12-drought-agro ( < −1) is a dummy equal to 1 if the SPI (accumulated over 12 months) takes values below −1 during at least 1 month of the agricultural growing season.
spi12-drought-agro ( < −2) is a dummy equal to 1 if the SPI (accumulated over 12 months) takes values below −2 during at least 1 month of the agricultural growing season.
Agricultural growing season from November to March. Baseline category of age: 48–57. Age <10 and Age >57 are excluded. Distance or Vincenty-distance calculated using geodesic distances between a pair of points on the surface of the Earth. Standard errors clustered at origin-district. Standard deviations in parenthesis.
6. Robustness tests
In this section, we start by giving descriptive evidence on the marital status of women who migrated, in order to support the use of the self-reported reasons for migration as reflecting actual migration for marriage. To test the robustness of the results, we then present estimations including also drought in the destination district, potential household interaction effects, and the results from a multinomial model of the different migration choices. We also discuss another potential mechanism behind the results, the role of ethnicity as reason for marriage.
6.1 Marital status after migration corroborates the stated reason for migration
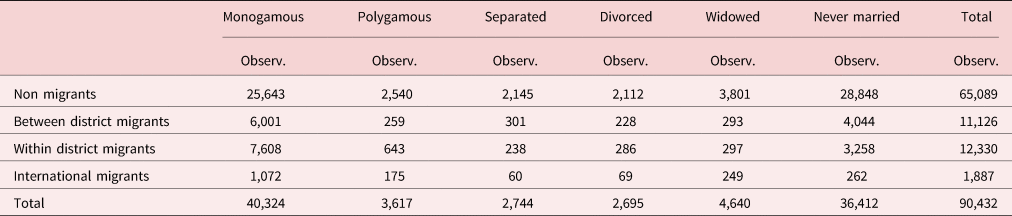
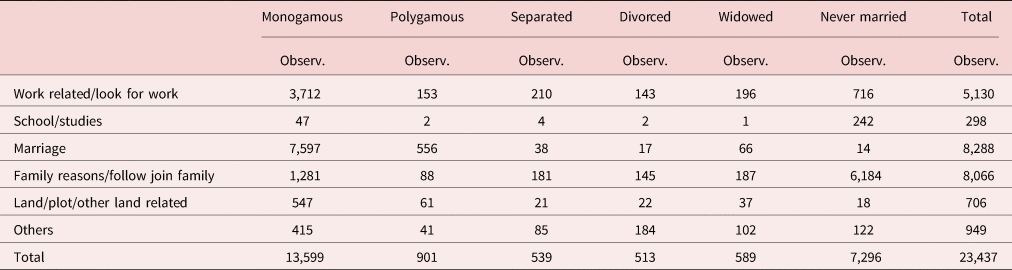
As support of the self-reported data on the reason for migration, the descriptive statistics in Tables 12 and 13 show that the marital status in the destination is monogamous marriage for the majority of migrants (58%), with the second largest category being polygamous marriage (3.8%). For those who declared marriage as reason to migrate, 92% are married in monogamous relationships (Table 13). Compared to non-migrants, migrants are more likely to be married (Table 12).
Marital status in destination—by category

Notes: The table includes only those for whom the information was reported. The question asked is: What is [NAME]'s present marital status?
Marital status in destination—by reason to migrate

Notes: The table includes only those for whom the information was reported. The question asked is: What is [NAME]'s present marital status?
6.2 The influence of drought on the destination district
The main tables relied on drought as a push factor, acting only in the place of origin. Drought in the destination district could deter migration, though, under the assumption that migrants are informed about drought in potential destinations. Table 28 in the Appendix tests the robustness of the main results of women migrating for marriage between-district when including jointly drought in the origin and in the destination districts. Recall that women migrate mainly within district for marriage in Malawi. Since we do not have the location of the villages themselves but use district-level drought data, we can only test this specification on between-district migration, and the sample is thus identical to the between-district migration sample in Table 8. The marginal effects of severe drought are insignificant, just as in the main estimation with drought in the origin district only [column (4) in Table 8]. The effects of moderate drought at origin are similar in terms of statistical significance and also in magnitude for the age group with a significant response (28–37 years). We conclude that the main results are robust to controlling for drought at destination. In addition, we note that drought at destination has the expected net deterring effect on migration for the reference group, and most other age intervals (except for the age group 38–47 years).
As an additional robustness check, we have tested a more general specification including destination district by year fixed effects to control for varying conditions in the destination districts more generally (Table 29 in the Appendix). The results in Table 29 correspond to the main results in Table 7. They are robust for all other age categories, but indicate a very small net increase in the probability of migration of girls (0.04 percentage points).
6.3 Household interaction effects
In the main estimations, we estimate the effect of drought on individual moves, but they could be interrelated if two or more persons in the household move at the same time. In Table 30 in the Appendix, we show estimations with interactions for whether the household head and partner migrated together. For moderate drought, the results show very similar results for women's migration and no significant interaction effect, so compared to Table 7 the main results do not change. For severe drought, though, it is interesting to note that including this control increases the probability of migrating among the older age groups by 1–1.5 percentage points and that the interaction effect with the dummy has a negative effect. There is still no effect on the youngest age category, though.
Other potentially relevant effects could come from the presence of brothers and sisters [Corno et al. (Reference Corno, Hildebrandt and Voena2020)] or the relation of the individual to the household head [Beegle and Poulin (Reference Beegle and Poulin2013)], or characteristics of the household, such as the household wealth or the level of education of the household head. Unfortunately, these interactions could not be investigated on the data used here since such characteristics are recorded in the destination district, and not at origin. A more detailed investigation of such mechanisms and their role in explaining the results found here should be the subject of future research.
6.4 Results from a multinomial model
The different destinations, within and between districts, could be considered outcomes of the same utility maximization problem and dependent on migration costs. To test the robustness of our main results on women migrating for marriage (Table 8), Table 31 in the Appendix presents the results from a multinomial estimation on the same sample adding the non-migrants and accounting for the two migration destination choices simultaneously. As in the main results, it is moderate drought that affects migration for marriage rather than severe drought, and the effects are found only for marriage-related migration within the district of origin. It is only in the age interval 28–37 years that drought decreases also women's between-district migration, but the marginal effects are small, less than 1 percentage point. The main result of a small decrease following drought in the migration propensity for marriage of girls who are between 10 and 17 years old is robust. In fact, the decrease is now even smaller, bordering on zero, indicating no evidence of increases in marriage-related migration following drought. The main tables are not presented with multinomial estimation, since the inclusion of fixed effects for district of origin or survey cause problems of convergence in the estimation and were omitted in the multinomial model. The results in Table 31 in the Appendix should thus be interpreted with caution.
6.5 The role of ethnicity
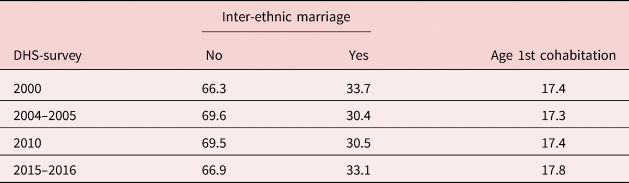
In the context of coping mechanisms for drought, one may wonder whether the patterns of marriage-related migration found here simply reflect a tendency for inter-ethnic marriage, which has been shown to function as an alternative insurance mechanism against shocks [Hotte and Marazyan (Reference Hotte and Marazyan2019)]. Ethnicity may be an important reason for marriage in sub-Saharan Africa, but compared to other countries in sub-Saharan Africa [Crespin-Boucaud (Reference Crespin-Boucaud2020)], we can rule out ethnicity as a major reason for marriage. Table 14 shows that the rates of inter-ethnic marriages in Malawi are relatively low.Footnote 26
DHS Malawi

7. Descriptive evidence on outcomes following migration
Migration for marriage, in particular at an early age, makes the individual—the girl in this case—unable to finish her schooling, less likely to participate in the labor market and potentially, more likely to get unwanted pregnancies when she is younger. This and the following subsections will discuss some of the potential outcomes for the migrants, particularly for those migrating for marriage, based on descriptive statistics.
7.1 School attendance after migration
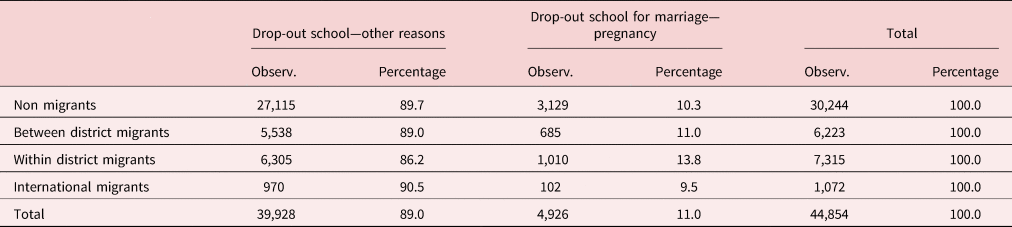
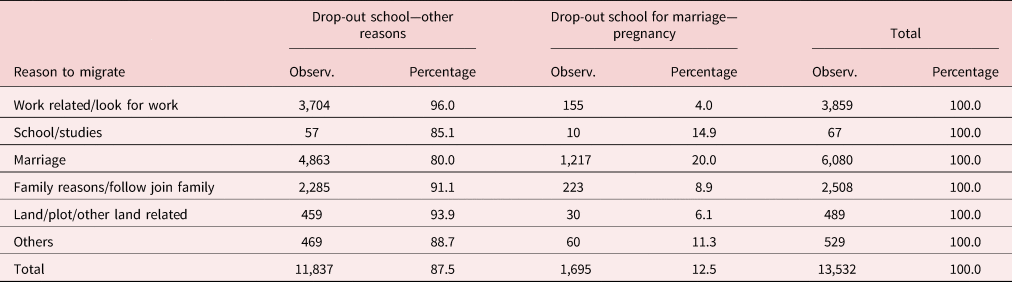
One of the most important consequences of migration for marriage or work is potential drop-out of school. Table 15 shows the drop-out rates in the destination household, by category of migrant status. We see a clear correlation in the data between migration for marriage and drop-out rates from school.Footnote 27 We also note that almost half of the migrant sample dropped out of school, 13,532 (Table 16) compared to the entire sample of migrants in Table 21 in the Appendix. Also, the largest share of those dropping-out of school for marriage or pregnancy is migrants who moved for marriage (Table 16).Footnote 28
Drop-out school in destination—by category

Notes: The table includes only those for whom the information was reported. The question asked is: why did you not continue your education? There are 18 options, among which the option “married-became pregnant.”
Drop-out school in destination—by reason to migrate

Notes: The table includes only those for whom the information was reported. The question asked is: why did you not continue your education? There are 18 options, among which the option “married-became pregnant.”
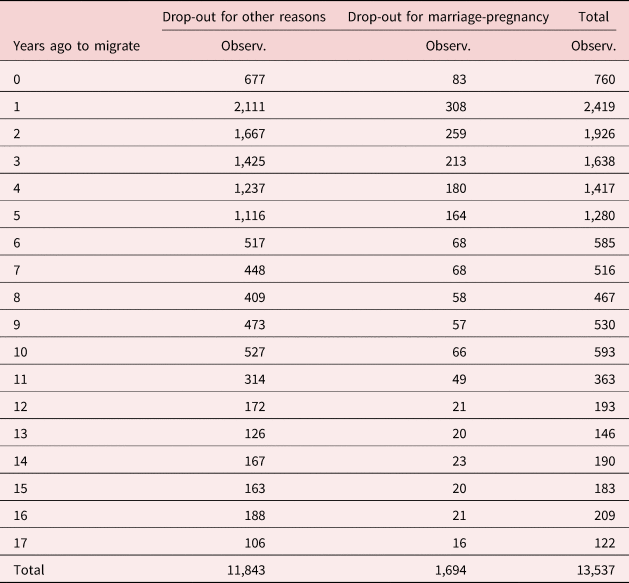
Table 17 shows that a large proportion of such drop-out of school occurs for those migrating recently and up to 5 years ago. Although these are descriptive statistics only, they could be interpreted as an indication of some of the consequences of marriage-related migration.
Drop-out school in destination—years ago to migrate

Notes: The table includes only those for whom the information was reported. The question asked is: why did you not continue your education? There are 18 options, among which married-became pregnant.
7.2 Do female migrants have higher probability of being pregnant after migrating?
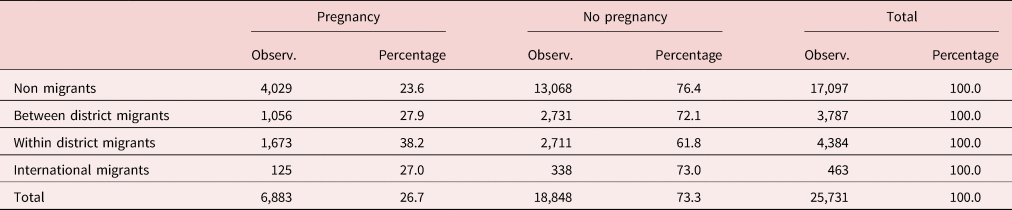
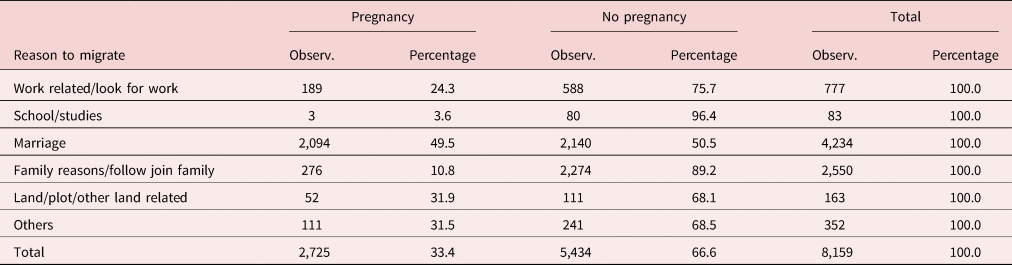
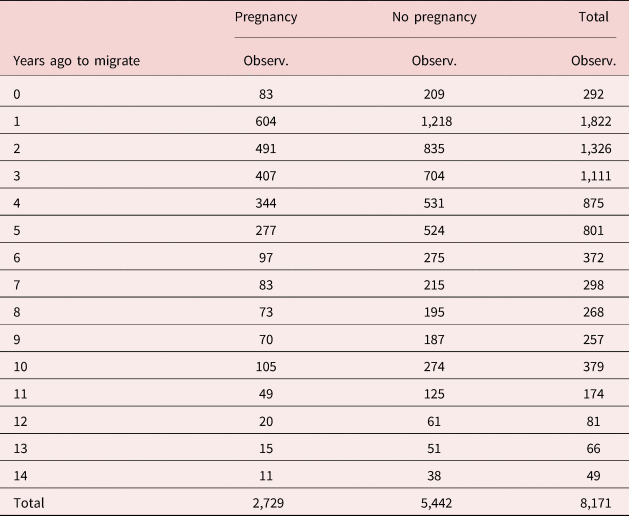
Tables 18–20 show the likelihood of pregnancy among migrant categories. In the main analysis we find a higher probability of marriage-related migration within the district of origin. Table 18 shows that within-district migrants, in particular, followed by between-district migrants have higher likelihood to have been pregnant in the last 24 months compared to non-migrants (both p-values = 0.00). Once they moved, 49.5% of those migrating for marriage were pregnant in the past 24 months (2,094 migrants for marriage compared to the 4,234 marriage migrants in Table 19). This proportion is significantly different from that of the migrants for other motives (p-value = 0.00).
Have a pregnancy in the last 24 months in destination—by category

Notes: The table includes only those for whom the information was reported. The question asked is: In the past 24 months, did you give birth to a child, even if born dead?
Have a pregnancy in the last 24 months in destination—by reason to migrate

Notes: The table includes only those for whom the information was reported. The question asked is: In the past 24 months, did you give birth to a child, even if born dead?
Table 20 shows that most migrants with a pregnancy within the last 24 months are recent marriage-related migrants, having migrated between 1 and 5 years ago.
Have a pregnancy in the last 24 months in destination—years ago to migrate

Notes: The table includes only those for whom the information was reported. The question asked is: In the past 24 months, did you give birth to a child, even if born dead?
We conclude that the descriptive statistics on some migrant outcomes in the destination are indicative that the self-reported migration for marriage reasons does reflect actual marriage-related moves. The statistics also indicate some of the adverse consequences of marriage in terms of dropping out of school because of pregnancy. All these consequences could usefully be investigated in future studies that would need to combine migration data with DHS data on health outcomes, for example.
8. Conclusion
In this paper, we aimed at linking the literature on migration as an adaptation mechanism following drought with the literature on marriage institutions, and provide more evidence on gender-related differences in the response of migration to drought. In a country with bride prices, such as Malawi, one consequence of drought may be an increase in the likelihood of child marriages. Combining data from the LSMS-ISA with satellite gridded weather data over the period 2000–2016, we estimate the probability of migration for reasons of work and marriage for men and women and find significant differences in the response to drought.
The results on marriage-related migration show that women migrate mainly within the district of origin and that the general effect of drought is to constrain migration. But the net migration probability increases after drought in some age intervals, in particular in the age intervals 18–27 and 28–37. We find little evidence of an increase in marriage-related migration in the lowest age category, 10–17. As concerns migration related to work, we see an increase in men's between-district migration, and a particularly large increase of almost 9 percentage points in the age interval 10–17 following severe drought. The between-district migration for work of girls in the same age interval also increases following severe drought, by 5 percentage points. On the one hand, the paper thus shows evidence of an optimistic result indicating no large changes in the probability of child marriages following drought in Malawi. On the other hand, we also conclude on a pessimistic note in providing evidence of increases in children's migration for work following drought, mainly for boys, and to a lesser extent for girls.
Although the rich data on the district of origin and destination as well as the time of migration is an important advantage of the paper, unfortunately, the lack of household information at origin before moving limits the study. For instance, it would be relevant to investigate the effect of wealth and the level of education of the household head in marriage-related migration decisions. Observing the majority of the information at the destination does not allow us to check whether or not household composition, such as the number of siblings, or the presence of sisters in particular, might reduce such migration.
Future research directions include investigating in more detail potential interrelations in different household members' migration, and exploring further the migrants moving for family reasons or to join family. It is possible that such moves of older individuals constitute another coping strategy of rural households. Also, although we cannot reject the null hypothesis that drought does not increase the probability of marriages in the lowest age category—which is a positive result—the indication of potential increases in work-related migration in the lowest age groups should be investigated further, since it would go in line with existing evidence on the use of child labor following income shocks [Edmonds and Shrestha (Reference Edmonds, Shrestha, Constant and Zimmermann2013)]. Finally, the consequences of marriage-related migration need to be investigated further in order to find causal effects on the outcomes. The choice of Malawi for the case study was motivated by the large droughts that the country has suffered during the time period studied. In consequence, the evidence here only stems from one country and could be extended by further work on social outcomes of drought-induced migration for marriage in other countries.
Supplementary material
The supplementary material for this article can be found at https://doi.org/10.1017/dem.2021.8.
Acknowledgements
We thank two anonymous referees for their insightful comments. We also thank participants at the AFD Workshop on Climate Migration for useful comments, in particular, Anda David, and the participants in the 13th Migration and Development Conference of the World Bank and AFD, especially our discussant Frédéric Docquier. We have also benefitted from useful discussions with Simone Bertoli, Martín Fernández-Sánchez, and Valerie Mueller. We acknowledge support of a French government subsidy managed by the Agence Nationale de la Recherche under the framework of the Investissements d'avenir program reference ANR-17-EURE-001. Both authors are fellows of the French Collaborative Institute on Migration (IC Migrations).