Introduction
Antarctic climate is characterized by two well-defined regions: the interior of the continent, with an extremely cold and dry climate, and the coast to the east and north of the Antarctic Peninsula, which is the warmest region of Antarctica (King & Turner Reference King and Turner1997). The low-pressure systems produce a ring of windy and wet conditions in the coastal regions. These are formed over the ocean and move towards the coast in a south-easterly direction. Except on the coast, the air is extremely dry. Research on the Antarctic climate is complicated by technical difficulties and by its dependence on multiple and interrelated physical processes (Schwerdtfeger Reference Schwerdtfeger1984).
The climate in the South Shetland Islands and the north-western Antarctic Peninsula is clearly different from that of the rest of the continent. It is the mildest area all year round due to the moderating influence of ice-free sea between October and June, according to the National Snow and Ice Data Center (NSIDC) maps. The location of the region, just south of 60°S, determines the characteristics of the atmospheric pressure field, with an area of high cyclogenesis (Simmonds et al. Reference Simmonds, Keay and Lim2003, Turner et al. Reference Turner, Colwell, Marshall, Lachlan-Cope, Carleton, Jones, Lagun, Reid and Iagovkina2004). The region is north of the low-pressure circumpolar belt, which is on average around 66°S. The annual mean atmospheric pressure is 987 hPa due to the constant movement of cyclones. Precipitation is usually frontal and in the form of snow (Turner et al. Reference Turner, Lachlan-Cope, Thomas and Colwell1995, Braun Reference Braun2001). During the summer, when temperatures often exceed 0°C, precipitation may be in liquid form. Cloud cover is very high due to the abundance of water vapour and the frequency of cyclones sweeping the region giving us an annual mean cloudiness of c. 80% (King & Turner Reference King and Turner1997).
Data from the British Antarctic Survey and the READER project (Reference Antarctic Data for Environmental Research) show a clear warming trend in the Antarctic Peninsula and South Shetland Islands (Turner et al. Reference Turner, Colwell, Marshall, Lachlan-Cope, Carleton, Jones, Lagun, Reid and Iagovkina2004). Other studies, such as Rau & Braun (Reference Rau and Braun2002) or Kejna (Reference Kejna2003), confirm the increase of temperature on the Antarctic Peninsula. Quintana & Carrasco (Reference Quintana and Carrasco2004) and King & Turner (Reference King and Turner1997) detected slight increasing trends in precipitation in the Antarctic Peninsula and South Shetland Islands, with a greater number of days of liquid precipitation during the summer and slight decrease of days with dry snow during the winter. Calvet et al. (Reference Calvet, García-Sellés and Corberá1999) estimated that the glacier surface on Livingston Island (South Shetland Islands) has fallen 4.31% between 1956 and 1996. Molina et al. (Reference Molina, Navarro, Calvet, García-Sellés and Lapazarán2007) estimated that the ice volume decreased 10.0±4.5% during the period 1956–2000.
LIMNOPOLAR is the name of a multidisciplinary research programme on Byers Peninsula since 2001 with the objective of conducting an ecological study of the inland water bodies on Byers Peninsula (Livingston Island) to assess the sensitivity of these ecosystems to climate change. It seems clear that environmental variations are of sufficient magnitude to induce fundamental changes in the structure and dynamics of Antarctic ecosystems (Huiskes & Quesada Reference Huiskes and Quesada2002). Studies of bio-sensitivity to climate change require long periods of observation or, alternatively, to combine information on organisms’ responses at different latitudes. Therefore, one of the priorities of the limnological study on Byers Peninsula was to record meteorological data in situ with a new weather station associated with the network of stations operating with the same purpose in other Antarctic regions. For this analysis it is particularly important that the stations’ features and programming follow the established standards for meteorological observations.
The purpose of this paper is to establish the baseline climatology in the area to underpin the related ecological papers. A detailed study of the local meteorological data is useful for estimating the duration of biological activity throughout the year and to increase knowledge of the dynamics and functioning of these ecosystems outside the sampling periods in summer. Here we provide a quite different perspective to the climate point of view typically found in other papers, including the lake's freezing and thawing data in direct relation with the lake's ecology. This article characterizes the weather and climate of Byers Peninsula, and compares it with the data for the same period at the nearby Spanish Antarctic Station Juan Carlos I (BAEJCI), as well as comparing the temperatures with Bellingshausen Station (King George Island) and Deception Island. The automatic weather stations (AWS) have similar characteristics and the geographical proximity between BAEJCI and Byers Peninsula stations, located 40 km apart on the same island, suggests that records should be highly correlated.
Materials and methods
Study site
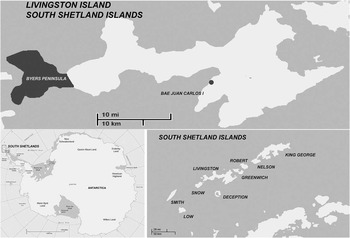
Byers Peninsula lies at the western end of Livingston Island (62°34′35′′–62°40′35′′S, 60°54′14′′–61°13′07′′W), which is the second largest island in the South Shetland Islands in Maritime Antarctica (Fig. 1). The peninsula has a surface area of 60.6 km2 and a maximum altitude of 265 m (Start Hill). The central area comprises a plateau of gently undulating relief around 105 m a.s.l. (Toro et al. Reference Toro, Camacho, Rochera, Rico, Bañón, Fernández-Valiente, Marco, Justel, Avendaño, Ariosa, Vincent and Quesada2007). Palaeoclimatic records and boulders, probably carried by ice movement, suggest glacial expansion in the area in colder periods (Martínez de Pisón et al. Reference Martínez de Pisón, Serrano, Arche and López-Martínez1996). During summer the snow melts, leaving a well-developed drainage network with many lakes and streams. The rest of the island, with an area of c. 1100 km2, is permanently covered by glaciers, with 5% ice-free in summer (Serrano Reference Serrano2001).
Maps of Antarctica, South Shetland Islands and Livingston Island.

Approximately 50 km east of Byers Peninsula on the same island is Mount Friesland, with an altitude of 1770 m. To the west and south-west of the island, very close to Byers Peninsula, is Snow Island, a glacier dome of less than 300 m in altitude. Somewhat more distant in the same direction is Smith Island, a mountain 2012 m high that emerges from the ocean. Deception Island is located about 40 km south.
The meteorological observatory on Byers Peninsula is located at 62°38′50′′S, 61°6′37′′W and an altitude of 70 m, between Lake Somero and Lake Limnopolar on a plain open to all directions and 2 km from the sea.
BAEJCI is located at 62°39′46′′S, 60°23′20′′W and an altitude of 12 m, c. 50 m from the eastern shore of South Bay. The bay is open to the SSW. Behind the station there is a mountain barrier 300 m high near the station which rises to meet Mount Friesland about 10 km away.
Meteorological data
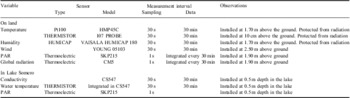
The AWS station was designed to operate continuously powered by a wind generator and solar panel that require annual maintenance (Bañón Reference Bañón2004). The station recorded several weather variables with a CR10X datalogger (Campbell Ltd) following the standards of the World Meteorological Organization (WMO 2008) and those outlined in Huiskes & Quesada (Reference Huiskes and Quesada2002) (Table I) measuring both boundary layer variables. Precipitation was not measured because it is usually in solid phase and the area is very windy, making any automatic records very imprecise. The pressure was not included because this variable was already recorded in the nearby BAEJCI (Bañón Reference Bañón2004) and no significant differences in atmospheric pressure were expected between these locations other than due to differences in elevation.
Measurements made by the automatic weather station located on Byers Peninsula. Data were logged every 30 minutes. Daily mean, maximum, minimum and integrated values were calculated and logged every 24 hours from data registered every 30 seconds. PAR = photosynthetically active radiation.

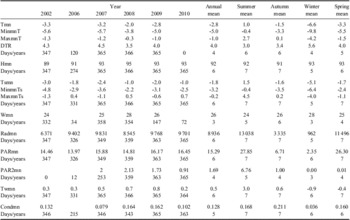
The station operated properly from December 2001–April 2003. Winter records in 2003, 2004 and the complete year 2005 were lost by station malfunctions. In February 2006 a vertical axis wind generator (Windside WS-0.15B) was installed to ensure the energy supply. Data for different variables were collected for more than 75% of the time. From 2007 to February 2011, 98% of the data on all variables except those related to the wind were successfully collected. The station records data every half hour and provides summary values every 24 hours. Daily mean minimum and maximum statistics were calculated for different meteorological variables from data measured every 30 s and stored every 30 min. In Tables II and III these statistics are denoted as mn, Min and Max (mean, minimum and maximum, respectively). Days with < 80% of recorded half-hourly data were discarded. This is a compromise between not losing too much information by occasional missing data and not introducing any important bias in the statistics since the failures tend to occur in consecutive hours caused by power failure, usually during night and in winter. Monthly statistics were calculated when > 80% of daily statistics were recorded. Annual statistics were calculated only for years with all twelve valid monthly statistics. The number of years meeting this requirement varies from four, for the wind-related variables, to seven for air at 0.1 m above the ground and water temperatures and PAR (Table II). Similarly, to calculate seasonal statistics, only years without flaws were used. Summer comprises December, January and February; autumn comprises March, April and May; winter comprises June, July and August; and spring comprises September, October and November.
Annual statistics for the meteorological variables recorded on Byers Peninsula. Years 2003, 2004 and 2005 have been rejected because they only recorded 192, 165 and 0 days, respectively, which would bias the accuracy of the analyses.

Days/years = number of available diary data for yearly estimations and number of available years for the annual and seasonal mean calculations. Tmn = mean of daily temperature at 1.70 m above the ground, in °C. MinmnT = mean of daily minimum temperature at 1.70 m above the ground, in °C. MaxmnT = mean of daily maximum temperature at 1.70 m above the ground, in °C. DTR = mean of daily temperature range at 1.70 m above the ground, in °C. Hmn = mean of daily relative humidity at 1.70 m above the ground. Tsmn = mean of daily temperatures at 0.1 m above the ground, in °C. MinmnTs = mean of daily minimum temperatures at 0.1 m above the ground, in °C. MaxmnTs = mean of daily maximum temperatures at 0.1 m above the ground, in °C. Wmn = mean of daily wind speeds, in km h-1. Radmn = mean of accumulated total daily global radiation, in kJ m-2. PARmn = mean of accumulated total daily photosynthetically active radiation (PAR), in mol m-2. PAR2mn = mean of accumulated total daily PAR in the bottom lake, in mol m-2. Twmn = mean of daily lake water temperatures, in °C. Condmn = mean of daily lake water conductivity, mS cm-1.
From an ecological point of view, the ice and snow cover are crucial. However, their measurement was not possible using an ultrasonic sensor because of maintenance and power problems that appeared after its installation. A snow cover proxy was developed consisting of analysing the annual time series of daily standard deviations of the temperature at 0.1 m above the ground, which is defined as follows:
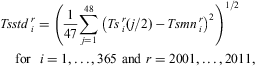 $$ {Tsstd\,_{i}^{r} \: &= \:{{\left( {\frac{1}{{47}}\mathop{\sum}\limits_{j\: = \:1}^{48} {{{{\left( {Ts\,_{i}^{r} ({j \mathord{\left/ {\vphantom {j 2}} \right. \kern-\nulldelimiterspace} 2})\,{\rm{ - }}\,Tsmn\,_{i}^{r} } \right)}}^2} } } \right)}^{1/2}} \,\cr &\!\!\!\!\!\!\!\!\!{\rm{for}}\,\,\,\,i\: = \:1, \ldots, 365\ {\rm{and}}\ r\: = \:2001, \ldots, 2011, \eqno\rm$$
where Tsi r(j) and Tsmni r are temperature at time j and daily mean, respectively, at 0.1 m above the ground on day i of year r. Whenever the sensor is covered with snow it is more protected from temperature changes dependent on air mass changes, and therefore, a decrease in this parameter indicates that the soil is covered with snow.
Linear regression analysis applied to daily mean data was used to compare the main weather variables between different stations in the South Shetland Islands. The relations were validated with P-values and with squared correlation coefficients.
Results and discussion
Annual cycle
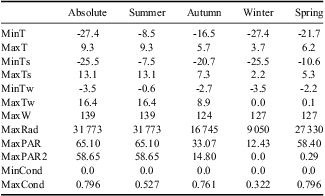
The average annual mean temperature of the air at 1.70 m above the ground is -2.8°C during the period from 2002–2010 (Table II). The minimum and maximum temperatures recorded were -27.4°C and 9.3°C, respectively (Table III). Usually, temperatures are below 0°C, although positive temperatures are possible at any time of year. The average annual mean daily temperature range (DTR in Table II), defined as the difference between daily maximum and minimum, is 4°C. Temperatures at 10 cm above the ground are higher because of the tempering effect of winter snow cover. Average annual mean temperature at this height is -1.8°C, the lowest temperature recorded is -25.5°C and the maximum is 13.1°C (Table III).
Extreme values for meteorological variables registered on Byers Peninsula from 2002–10.
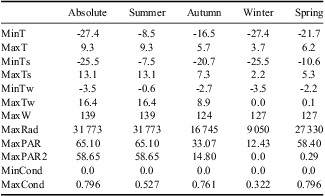
MinT = minimum temperature at 1.70 m above the ground, in °C. MaxT = maximum temperature at 1.70 m above the ground, in °C. MinTs = minimum temperature at 0.1 m above the ground, in °C. MaxTs = maximum temperature at 0.1 m above the ground, in °C. MinTw = minimum lake water temperature, in °C. MaxTw = maximum lake water temperature, in °C. MaxW = maximum wind speed, in km h-1. MaxRad = maximum of accumulated total daily global radiation, in kJ m-2. MaxPAR = maximum of accumulated total daily photosynthetically active radiation (PAR) in mol m-2. MaxPAR2 = maximum of accumulated total daily PAR in the bottom lake in mol m-2. MinCond = minimum lake water conductivity, mS cm-1. MaxCond = maximum lake water conductivity, mS cm-1.
The average relative humidity is very high (above 90% most years) probably due to the proximity of the sea and lakes.
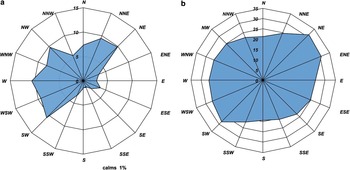
Wind speed is moderate, with an average speed of 26 km h-1 (Fig. 2b). There are frequent storms throughout the year with wind gusts exceeding 100 km h-1. The highest gust registered is 139 km h-1 (Table III). Winds from north-east to south-west, passing through south, are rarely observed (Fig. 2a). The wind speed is fairly uniform in all directions, with slightly stronger winds blowing from the north-east. Calms are rare, only 1.4% of the records. No differences in speed and direction throughout the year were recorded.
Wind roses representing a. wind frequencies as percentages, and b. mean wind speeds in km h-1. Data registered on Byers Peninsula between December 2001 and February 2011.

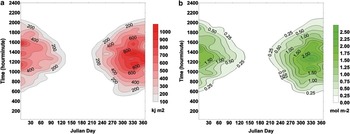
Despite the intensive cloudiness, global radiation is high (Fig. 3a). The average accumulated daily global radiation is 8936 kJ m-2 and the maximum daily record near the summer solstice is 31 773 kJ m-2. The average accumulated daily PAR is 15.29 mol m-2, with a maximum record of 65.10 mol m-2. It is observed that higher values are reached before the summer solstice (Fig. 3b), in late spring or early summer, when low pressures are still not established and sunny days are predominant. In September daily global radiation values above 1000 kJ m-2 and PAR above 1.00 mol m-2 start to appear. These usually peak a short time past noon, between 12h00 and 16h00.
a. Mean global radiation, and b. mean photosynthetically active radiation (PAR), as a function of Julian day and hour, on Byers Peninsula from December 2001–February 2011.

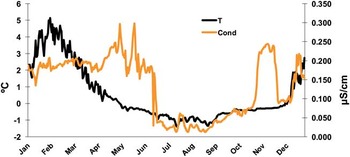
The lake variables, water temperature and conductivity at 0.5 m deep, indicate when the lake freezes (Fig. 4), which typically occurs in late autumn. It remains below freezing point until early summer (Rochera et al. Reference Rochera, Justel, Fernandez-Valiente, Bañón, Rico, Toro, Camacho and Quesada2010). Complete freeze-up of Lake Somero takes place around Julian day 170, at the end of June. Lake Somero remains frozen solid about 80 days a year (until about Julian day 250, early September) after which the bottom water starts thawing and remains liquid until next winter. By early summer the sudden increase in conductivity is probably due to thawing of the frozen brine formed under the ice that is quickly diluted by the complete thawing of the ice and snow both in the lake and in the watershed. In winter and spring, when Lake Somero is ice-covered and water column irradiance decreases dramatically, some radiation could reach the lake bottom even at mid-winter because of its shallowness. The PAR sensor installed at 0.5 m depth in the lake recorded daily averages of 1.69 mol m-2 (Table II). After the summer ice thaw, maximum PAR reaches 58.65 mol m-2 (Table II), similar to the air sensor reading. The organisms inhabiting the lake bottom are surrounded by liquid water during long periods of the year, with reasonable amounts of PAR available, although they are exposed to variable conductivity due to the salt exclusion during the ice formation process (Hawes et al. Reference Hawes, Safi, Sorrell, Webster-Brown and Arscott2011).
Mean lake water temperature (T) and conductivity (Cond) for every day in the year in Lake Somero, Byers Peninsula, from December 2001–February 2011.

Regarding interannual variation, data from Table II show low disparity between mean values of some weather parameters such as wind or humidity. However, air temperatures at 1.7 m and at 0.1 m above the ground and radiation differed from one year to another (Table II). There was a difference of 1.3°C for air temperature at 1.70 m above the ground between 2002, which was the coldest year, and 2008, the warmest (Table II), which is in line with the high interannual variance previously recorded in the area (King Reference King1994, Quintana & Carrasco Reference Quintana and Carrasco2004, Rochera et al. Reference Rochera, Justel, Fernandez-Valiente, Bañón, Rico, Toro, Camacho and Quesada2010).
Seasonal cycle
Summer
Average summer mean temperature at 1.70 m above the ground is 1.0°C, and frosts are quite common (Table II). The mean minimum and maximum temperatures are -0.4°C and 2.7°C, respectively (Table II), with lowest and highest temperatures recorded at -8.5°C and 9.3°C (Table III), respectively. The mean daily temperature range is 3.0°C. The mean temperature at 0.1 m above the ground is 1.5°C, which is 0.5°C higher than that recorded at 1.7 m. However, this sensor is ice-free most of the season, reaching mean, maximum and minimum temperatures of 4.5°C and -0.4°C, respectively. The temperature values ranged from -7.5°C to 13.1°C (Table III). Wind is moderate, with average speed 24 km h-1, showing similar wind roses to those observed for the annual cycle. Frequent storms occur in summer, and a maximum wind gust of 139 km h-1 was recorded during one such storm. Global radiation reaches the highest annual values in summer, with days of up to 20 hours of daylight in the region. Average daily radiation is 13 038 kJ m-2, occasionally exceeding 31 000 kJ m-2. PAR follows a similar pattern, with a mean value of 27.85 mol m-2 and maximum record of 65.10 mol m-2 (Table III).
Water in Lake Somero is liquid most of the summer, occasionally reaching temperatures up to 16°C. The minimum temperature registered is -0.6°C when the lake is frozen in early summer (Rochera et al. Reference Rochera, Justel, Fernandez-Valiente, Bañón, Rico, Toro, Camacho and Quesada2010). Mean PAR in the water is 6.76 mol m-2 and the maximum radiation registered is 58.65 mol m-2. The difference is due to partially frozen conditions during some summer days.
Autumn
During the autumn temperatures start dropping rapidly. The average daily temperature is -1.5°C, the average maximum value is 0.1°C and the minimum -3.3°C (Table II). The mean daily temperature range is 3.4°C. Temperatures reach up to 5.7°C and drop to -16.5°C (Table III). Temperature at 0.1 m above the ground is -1.6°C, with a maximum of 0.2°C and a minimum of -3.5°C (Table II). The most extreme values are -20.7°C and 7.3°C (Table III). The autumnal wind roses do not vary relative to the annual wind rose. Mean wind speed is higher than in summer, at 26 km h-1. The average global radiation decreases fourfold from that in summer, with an average value of 3335 kJ m-2 and a maximum record of 16 745 kJ m-2 in early March (Table III). PAR also decreases in the same proportion. The mean value is 6.71 mol m-2 and the maximum 33.07 mol m-2 (Table III).
The average of daily mean lake water temperatures decreases to 0.6°C in autumn, but from May on the temperature is under the freezing point. Ice formation on the surface takes place between April and May (Rochera et al. Reference Rochera, Justel, Fernandez-Valiente, Bañón, Rico, Toro, Camacho and Quesada2010), although liquid water could remain at the bottom until June (Fig. 4). Mean daily accumulated PAR in the lake is 1 mol m-2 and the maximum 14.80 mol m-2.
Winter
At the beginning of winter, air temperature falls severely, simultaneously with the sea ice formation in the region, according to the NSIDC maps. Mean daily temperature at 1.7 m above the ground is -6.6°C (Table II), with mean maximum and minimum values of -4.2 and -9.8°C, respectively (Table III). The most extreme temperatures are 3.7 and -27.4°C, which shows that 0°C temperatures can be exceeded in all seasons (Table III). The mean daily temperature range is 5.6°C and is the widest in the year. Temperatures close to the ground are milder, most probably influenced by the snow and ice cover, with a mean value of -5.1°C, although the minimum and maximum temperatures are -25.5 to 2.2°C (Table III). Wind maintains the same behaviour through the year, with a highest mean speed of 28 km h-1. In winter, solar radiation reaches values near darkness, with less than three hours of sunlight. The shortage of radiation during winter is compensated by the abundance of daylight hours during the summer. Mean global accumulated daily radiation is 962 kJ m-2, reaching a maximum in September of 9050 kJ m-2 (Table III). Average PAR is 2.35 mol m-2 with a maximum value of 12.43 mol m-2 (Table III). In addition, mean lake water temperature is -0.9°C, with extreme values of -3.5 and 0°C (Tables II & III).
Spring
Daily temperature rises in spring, although it remains below freezing on most days. Mean daily temperature at 1.7 m above the ground is -3.3°C and mean minimum and maximum records are -5.5 and -1.5°C, respectively (Table III). There are some records over 6°C and under -21°C. The mean daily temperature range is 4°C. Temperature near the ground is milder in this season probably due also to ice and snow cover conditions. The mean daily temperature is -1.7°C and the mean of the extreme daily records are -2.4 and -1.1°C. The minimum and maximum records are -10.6°C and 5.3°C (Table III). Average wind speed is 25 km h-1, near the annual mean values, with gusts reaching 127 km h-1. Global radiation reaches maximum values of 27 330 kJ m-2 in November (Table III), with a mean accumulated daily radiation of 11 496 kJ m-2 (Table II). These maximum values are due to incremented solar radiation and also a decrease in the number of overcast days during this period. The average accumulated daily PAR is 26.30 mol m-2 and the maximum record is 58.40 mol m-2 (Tables II & III).
The lakes remain frozen most of the time in spring and the average temperature of the water is -0.4°C, with extreme values ranging from -2.2 to 0.1°C (Table III). PAR into the lake reaches 0.29 mol m-2, while the mean value is 0.01 mol m-2, probably due to the presence of ice cover.
Relations between weather variables
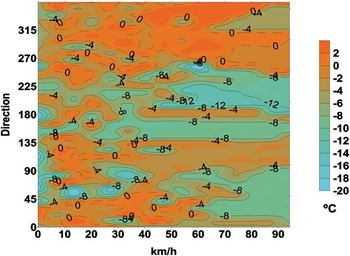
The warmest temperatures are related to north-west winds for all wind speeds and to north winds when the speeds are below 60 km h-1 (Fig. 5). The cooler temperatures occur with strong winds from the south and SSW and weak winds from the east and south.
Mean daily temperature at 1.7 m above the ground as a function of the average daily speed and direction of the wind.

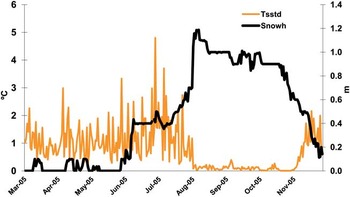
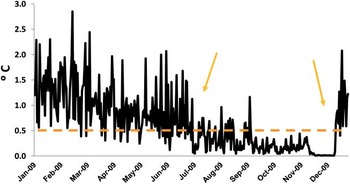
Figure 6 shows the relation between Tsstd 2005, daily standard deviation of the temperature at 0.1 m above the ground, and snow height in BAEJCI for 2005. Tsstd 2005 decreases rapidly to levels approaching zero when the sensor is covered by 0.5 m of snow. Tsstd 2005 is a good indicator of the periods in which the ground is still covered by snow, probably because in these conditions the sensor is protected from air temperature variations. Applying this result to the Byers Peninsula records, a similar behaviour is observed in Fig. 7, where Tsstd 2009 is represented. The catchment area is therefore thought to be snow covered between the first days of July and mid-December in 2009, since Tsstd 2009 is below 0.5°C. This relationship is confirmed by independent data from De Pablo et al. (Reference De Pablo, Blanco, Molina, Ramos, Quesada and Vieira2013).
Daily standard deviation of the temperature at 0.1 m above the ground (Tsstd) and snow height (Snowh) at the Spanish Antarctic Station Juan Carlos I (BAEJCI) throughout 2005.

Daily standard deviation of the temperature at 0.1 m above the ground (tsstd) on Byers Peninsula throughout 2009. Arrows indicate the estimated period in which the ground would have been covered by 0.5 m of snow.

Comparison of Byers Peninsula and surrounding meteorological stations
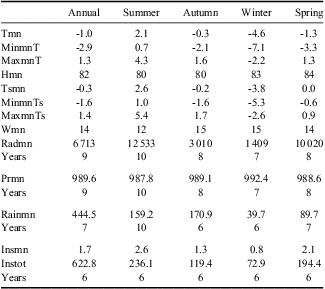
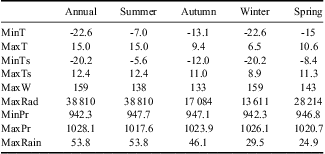
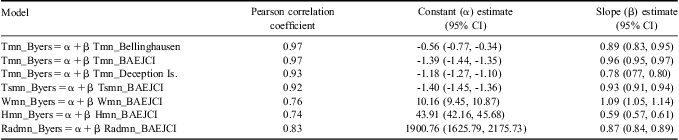
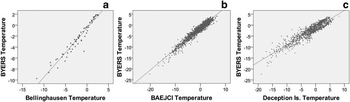
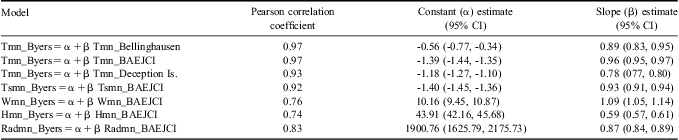
Our data when clear differences are found (Table VI) are compared with BAEJCI (Bañón Reference Bañón2001) (Tables IV & V), or the Bellingshausen and Deception Island stations. Monthly temperature data from Byers Peninsula are highly correlated with temperatures in Bellingshausen Station (r = 0.97), and daily mean temperatures are also highly correlated with Deception Island (r = 0.93) and BAEJCI (r = 0.97) (Table VI & Fig. 8). Although the mean annual data from all stations are similar, temperature values seem to be lower on Byers Peninsula than the other three nearby stations, although the precise location of each station can influence the values. Other more southerly stations such as Rothera, Faraday-Vernadsky and Palmer show lower annual mean temperatures (-4.4, -3.7 and -3.1 respectively vs -2.8°C on Byers Peninsula) influenced by latitude and local characteristics. In the east of the Antarctic Peninsula, at Marambio Station the mean annual temperature decreases to -9°C influenced by the Weddell Sea. Other variables, such as relative humidity, were quite similar at the four stations in the South Shetland Islands (from 89% at Bellingshausen Station to 92% on Byers Peninsula).
Statistics for the meteorological variables registered in BAEJCI (the Spanish Antarctic Station Juan Carlos I).
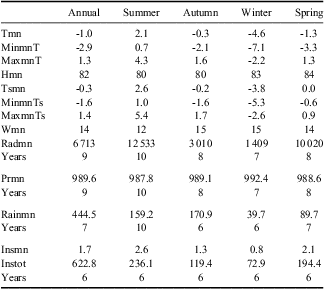
Abbreviations as in Table II, and Prmn = mean of daily pressure, in hectopascals, Rainmn = mean of precipitation, in mm, Insmn = mean of daily sun hours, in hours, and Instot = mean of sun hours throughout the year/season, in hours.
Extreme values for the meteorological variables registered in BAEJCI (the Spanish Antarctic Station Juan Carlos I).
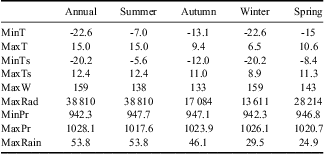
Abbreviations as in Table III, and MinPr = minimum pressure, in hectopascals, MaxPr = maximum pressure, in hectopascals, and MaxRain =maximum precipitation in 24 hours, in mm.
Pearson correlation coefficient and linear regression coefficient estimates with 95% confidence intervals (CI). Abbreviations as in Tables II and IV. BAEJCI = the Spanish Antarctic Station Juan Carlos I.
Scatterplots for relations between Byers Peninsula and Bellingshausen, BAEJCI (the Spanish Antarctic Station Juan Carlos I) and Deception Island temperatures at 1.7 m above the ground, in °C, between a. & b. December 2001 and December 2009, and c. December 2005 and December 2009. a. represents monthly mean temperatures, b. & c. represent daily mean temperatures.

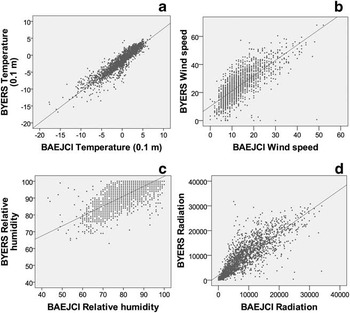
Regression analysis based on the daily average data indicates that all meteorological variables recorded on Byers Peninsula show high correlation with BAEJCI with P-values < 0.05 (Table VI & Fig. 9). Temperature records at 1.7 m above the ground have the highest Pearson correlation coefficient. Relative humidity, which is very much locally influenced, showed the lowest Pearson correlation coefficient (0.74). Comparing air temperature records from Byers Peninsula and BAEJCI showed Byers to be 1.4°C colder (estimated constant term in the linear regression model). This divergence cannot be explained by the altitude difference of only 60 m between both locations, although BAEJCI on Hurd Peninsula might be more sheltered than the station on Byers Peninsula. Divergences in near ground temperature (0.1 m above the ground) reach -1.4°C. In the case of relative humidity, the annual mean value is 10% higher on Byers Peninsula. Wind speed data also show a considerable difference, with an annual average of 14 km h-1 at BAEJCI compared to 26 km h-1 on Byers Peninsula. The dominant wind directions at BAEJCI come from South Bay (Fig. 1), NNE and SSW, and the frequency of calm periods is 5%, compared with 1% on Byers Peninsula. Annual average accumulated global daily radiation recorded on Byers Peninsula is 33% higher than at BAEJCI, about 2200 kJ m-2. BAEJCI is located near a mountain range that leads to increased cloudiness. This proximity to the mountains and more snow covering the hills around the station may cause higher peaks of global radiation from light reflection.
Scatterplots for relations between Byers Peninsula and BAEJCI (the Spanish Antarctic Station Juan Carlos I) weather parameters, between December 2001 and December 2009. a. Daily mean temperatures at 0.1 m above the ground in °C, b. daily mean wind speeds in km h-1, c. daily mean relative humidity, and d. accumulated total daily global radiation in kJ m-2.

Comparisons are made with the aim of filling in missing data and extrapolating time series for historical reconstruction on Byers Peninsula. In addition, we will assume some non-measured parameters on Byers Peninsula, such as atmospheric pressure, from those obtained by the weather station at BAEJCI. In relation to precipitation, higher differences were found since precipitation is known to change on small spatial scales. Summer precipitation at BAEJCI ranges between 100 and 230 mm, with a mean value of 159 mm. The annual precipitation was held to be higher than 500 mm, on the grounds that nearby meteorological stations such as Great Wall or President Eduardo Frei Montalva (King George Island) show precipitation levels ranging from 500–800 mm or, at Arturo Prat (Greenwich Island) 600 mm (Turner & Pendlebury Reference Turner and Pendlebury2004). Precipitation and rainy days are usually predominant features in the area, with liquid precipitation throughout summer. There are two unusual records of intense rainfall events in BAEJCI, one in February 1999 with values of 30 mm in two hours and another in February 2003 with more than 50 mm registered in less than six hours. During the first field seasons, 1987–88 to 1992–93, when meteorological observations were carried out by a meteorological observer following WMO standards (WMO 2008), precipitation events were observed on over 80% of days. Most of these precipitations are not recorded by the AWS since they are slight snowfalls strongly influenced by wind. Annual pressure patterns follow those of other Antarctic coastal stations, especially those on the northern tip of the Antarctic Peninsula (King & Turner Reference King and Turner1997). Records show that Livingston Island exhibits a marked maximum pressure in July and a minimum in April. Moreover, the amplitude of recorded pressures ranges from 1028–942 hPa. Commonly, the frequency of depressions, especially in summer, cause large atmospheric pressure variations, reaching values of 20 hPa in 12 hours.
Concluding remarks
The outcomes from the LIMNOPOLAR project are of great interest for the area, which is one of the areas most affected by global changes on Earth (Steig et al. Reference Steig, Schneider, Rutherford, Mann, Comiso and Shindell2009). Although the meteorological time series from Byers Peninsula AWS is short, the study of its relationship to weather variables at nearby stations such as BAEJCI and others deployed on South Shetland Islands can help extend this record. Given the trends found in the meteorological stations on the South Shetland Islands (Turner et al. Reference Turner, Colwell, Marshall, Lachlan-Cope, Carleton, Jones, Lagun, Reid and Iagovkina2005) and the indirect effects as glaciers retreat (Calvet et al. Reference Calvet, García-Sellés and Corberá1999), this dataset is particularly important as the baseline for future projects evaluating climate change in the region and also its consequences for the terrestrial, freshwater and coastal ecosystems.
From a climatic point of view, the area is characterized by a warm summer with temperatures above 0°C and liquid water precipitation. The interannual variability of temperature and precipitation records is very high. Byers Peninsula is about 1°C colder on average than the BAEJCI while extreme values span a wide range. Average wind speed is twofold higher on Byers Peninsula but maximum gusts are in the same range. Predominant winds come from north-east through south-west, passing through north at both locations, but the mountain range at BAEJCI deflects the wind resulting in lower average wind speed. The daily air temperature amplitude is about 4°C. For global solar radiation, it is significant that the maximum is usually reached before the summer solstice (late November to the beginning of December), probably due to the increased frequency of low-pressure events during mid- and late summer compared to those registered during spring. Our results also indicate that the lakes in the region remain liquid at the bottom for most of the year and the shallower basins freeze solid for only approximately 80 days a year. Sunlight is able to penetrate the lake during most of the ice-covered period, which has important implications for organisms living on the lake bottom.
Acknowledgements
This work was funded by the Ministerio de Ciencia e Innovación (Spanish Ministry of Science and Innovation) through grants REN2000-0435, CGL2005-06549 and POL2006-06635. We are extremely grateful to all the members of the LIMNOPOLAR team who helped with the deployment and maintenance of the AWS. The Agencia Estatal de Meteorología (Spanish National Meteorological Agency) provided invaluable assistance in the skilful maintenance of the station and kindly provided detailed data from BAEJCI. This project could not have been done without the generous help provided by the Unidad Técnica Marina (Technical Marine Unit) and the Spanish Navy crew of Las Palmas. This paper was published with the financial support of the Spanish Ministry of Science and Innovation, grant number CTM2011-12973-E. The constructive comments of the reviewers are also gratefully acknowledged.