I. INTRODUCTION
Recently, a new type of alloy, i.e., high entropy alloy (HEA) or multi-principal-element alloy, has become a new research hotspot in the metallic materials community. HEA, a novel concept different from conventional alloy system, was first introduced by Yeh et al. Reference Yeh, Chen, Lin, Gan, Chin, Shun, Tsau and Chang1 Meanwhile, Cantor et al. Reference Cantor, Chang, Knight and Vincent2 named this category of alloy as multi-component elements. Yeh Reference Yeh3 summarized mainly four core effects for HEAs, including high entropy effect, sluggish diffusion effect, severe lattice distortion effect, and cocktail effect. Due to the existence of these four effects, HEA makes it possible to own some unique characteristics, such as novel microstructures Reference Wang, Li, Ren, Yang and Fu4–Reference He, Wang, Niu, Wu, Li, Wang, Liu and Dang8 and excellent properties. Reference Dong, Gao, Lu, Wang and Li9–Reference Stepanov, Yurchenko, Sokolovsky, Tikhonovsky and Salishchev11
With years’ of investigations, researchers have further understood the characteristics of HEAs. Though the mix entropy is a significant feature of HEAs with ideal solutions, the studied alloys Reference Maiti and Steurer12–Reference Lee and Shun16 were far from them and there is no point in over emphasizing the definition of HEAs. That’s why various HEAs with different components were designed. Reference Wang, Ma, Jiang, Li, Shi, Dong and Liaw17–Reference Niu, Zaddach, Koch and Irving24 So far there have been mainly two series of HEAs which are widely investigated: the refractory HEAs like TaMoWNbZr and regular HEAs like AlCoCrFeNi. As the most mature HEA system, AlCoCrFeNi owns the matrix of [Cr, Fe] and ordered NiAl. Besides, Co-rich phase could also be found at the matrix of alloy. Reference Rao, Ocelik, Vainchtein, Tang, Liaw and De Hosson15 In the system of AlCuCrFeNi, researchers found that the only difference of phase composition was the Cu-rich phase. Reference Zhang, Zuo, Tang, Gao, Dahmen, Liaw and Lu20 In 2014, Lu et al. Reference Lu, Dong, Guo, Jiang, Kang, Wang, Wen, Wang, Jie, Cao, Ruan and Li19 proposed a novel strategy to design HEAs according to the eutectic alloys. With double-phase strengthening, AlCoCrFeNi2.1 showed excellent combination of mechanical properties at room and high temperature. This work provides us a way to carry out the research of Al–Cr–Fe–Ni alloy system. Without the effect of Co/Cu, whether AlCrFeNi can form eutectic structures composed of [Cr, Fe] and NiAl phase?
The potential for the application of HEAs in high temperature field is immense, and thermal properties of HEAs have been widely investigated, such as mechanical properties at elevated temperatures Reference Guo, Wang, Luo, Li, Su, Guo and Fu25,Reference Chen, Kauffmann, Gorr, Schliephake, Seemuller, Wagner, Christ and Heilmaier26 and thermal stabilities. Reference Huang, Zhang, Shen and Vilar27,Reference Pickering, Muñoz-Moreno, Stone and Jones28 As a significant part of the thermal performances, high temperature oxidation resistance of HEAs should have attracted much attention. However, the more components alloy contains, the more complex oxidation behaviors would be led to. An understanding of oxidation behaviors and effective models to explain multi-component alloys’ behaviors are lacking. Reference Yang, Tsai and Kuo29–Reference Liu, Wang, Zhang, Tang and Zhang34 It is well known that elements like Al and Cr can promote the formation of dense, continuous oxidation scales to inhibit the oxidation of alloys. But for alloys containing Fe, the oxidation resistance is limited compared to the Fe-free alloys. Unfortunately, most HEAs, such as AlCoCrFeNi, AlCrFeMnNi, and CoCrFeNiTi, have equal molar quantities of elements with opposite effects on oxidation. Besides, under the effect of sluggish diffusion kinetics, non-protective transient oxides could be inhibited. Reference Butler and Weaver31 Meanwhile, the formation of protective oxidation scales is also delayed. Reference Holcomb, Tylczak and Carnery33 In a word, the oxidation behaviors of HEAs are influenced by interactions of different aspects and different factors in each aspect. Therefore, it is necessary for HEAs to carry out systemic researches of oxidation behaviors. This is because oxidation resistance is a significant part of thermal properties of alloys. Also, an understanding of four-component alloy oxidation mechanisms at elevated temperatures will provide some insights into the oxidation behaviors of multi-component alloys system.
Based on the analysis above, four-component Al1.3CrFeNi alloy was designed. In this paper, the microstructure and oxidation behavior of this alloy were investigated with two purposes. One was to verify whether this alloy could form EHEA-like mixture of solid solutions and intermetallics. The other was to analyze the oxidation mechanism and describe the effective oxidation model of the Al–Cr–Fe–Ni alloy system. Through the investigation of Al1.3CrFeNi alloy, we can offer some references of systematically studying oxidation mechanisms of multi-component alloys. This may promote the studies and developments of HEAs’ thermal applications.
II. EXPERIMENTAL PROCEDURES
Al1.3CrFeNi alloy ingots were prepared by arc-melting a mixture of pure metals (all in 99.9 wt% purity) under high-purity argon atmosphere. To absorb the oxygen remained, high-purity titanium was first to be melted as getter. The prepared ingots were flipped and remelted at least five times in a water-chilled copper mold to ensure the chemical homogeneity of the alloy.
The crystal structure of the matrix was identified by X-ray diffraction (XRD; D8 Advance, Bruker Corporation, Karlsruhe, Germany) with Cu Kα radiation operated in the condition of 40 kV, 30 mA. The scanning angle (2θ) ranged from 20° to 105° with a scanning rate of 12°/min. Samples were polished and etched with aqua regia for observation under scanning electron microscope (SEM; Nova Nano SEM 430, FEI Company, Hillsboro, Oregon) equipped with back-scattered electron (BSE). The chemical composition of different phases was analyzed by SEM energy-dispersive X-ray spectroscopy (EDS).
These multi-component alloy specimens for oxidation were cut by electrical discharge machining with an approximate dimension of 15 × 15 × 3 mm. Discontinuous isothermal oxidation of the as-cast alloys was conducted at 1000 °C under ambient laboratory air in a box furnace (KSL 1400X A3, Hefei Kejing Materials Technology, Hefei City, China) and the accuracy of the temperature in the hot area was 1 K. Tests were carried out with the exposure times of 5, 10, 15, 20, 40, 60, 80, and 100 h. Prior to the start of testing, samples were ground to a 1200 grit surface finish using SiC abrasive paper, cleaned with ethyl ethanol and placed into individual annealed alumina crucibles. Specimens were removed from furnace at regular intervals. After being remained for 1 h in a dryer, the crucibles with samples which had cooled down to room temperature (∼25 °C) were measured by an electronic microbalance (FA 1004, 1 × 10⁻⁵ g sensitivity). The oxidation products were characterized to evaluate their surface topography by XRD (40 kV, 30 mA, 20°–90°, 4°/min) and SEM (FEI QuantaTM 250, FEI Company). Transverse section of the representative specimen was observed at high magnifications.
III. RESULTS AND DISCUSSION
A. Microstructure and phases
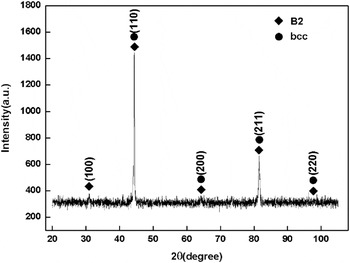
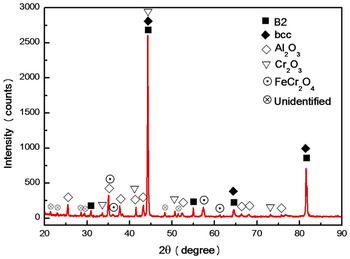
The XRD pattern of the quaternary Al1.3CrFeNi alloy is presented in Fig. 1. A bcc/B2 dual-phase constitution was detected from the XRD pattern. The existence of (100) peak at low angle region (2θ ≈ 31°) indicates the formation of ordered B2 phase with superlattice diffraction peaks and there is a superposition of two series of peaks at higher angle regions. This phenomenon is mainly resulted by spinodal decomposition which is well known for multi-component alloys, as is shown in previous studies. Reference Dong, Lu, Kong, Zhang and Li35,Reference Singh and Subramaniam36 This superposition means that the two phases own the same crystal structure and their diffraction peaks are nearly the same. From Fig. 1, it can be calculated that lattice parameters of bcc and B2 phase are 2.888 Å and 2.876 Å.
XRD pattern of Al1.3CrFeNi alloy.

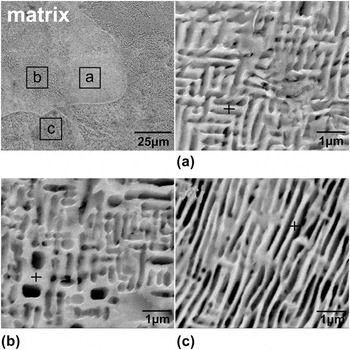
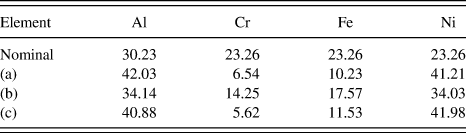
SEM images of Al1.3CrFeNi alloy etched with aqua regia are shown in Fig. 2. There are three types of reticular structures in the matrix in Fig. 2(a), 2(b) and 2(c) are the magnified images of zone a, b, and c. EDS results of these three areas are presented in Table I and indicates that all these reticular structures contain much more Al and Ni than Cr and Fe. In Fig. 2(a), it is indicated that the reticular structure is similar to the dual rectangular shape. In Fig. 2(b), there are many irregular cavities in the matrix and the sizes of the cavities are less than 1 μm. Different from Fig. 2(b), regular structures are detected in Fig. 2(c). Long lamellar phases are connected with each other, which form many slit-shaped pores. The thickness of the lamellar phase is about 200 nm and the thinnest boundary can even reach up to 100 nm or less.
SEM images of Al1.3CrFeNi alloy etched with aqua regia: (a), (b) and (c) three different parts shown in the matrix.

EDS determined compositions (in at.%) of alloy skeletons.

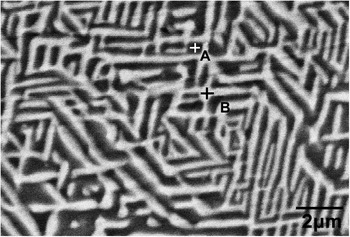
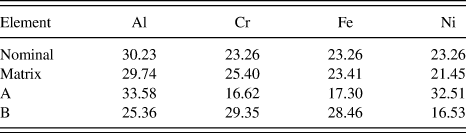
To obtain better comparison, the BSE image of Al1.3CrFeNi alloy with polishing is shown in Fig. 3. There are obviously two phases of the HEA. Both phases have strip structures in scattered distribution. EDS results in Table II show that the overall compositions of the matrix are similar to the nominal compositions of Al1.3CrFeNi alloy. But the phase revealed in zone A of Fig. 3 contains more Al and Ni than the matrix, and the atomic ratio of Al:Ni is close to 1:1. This is consistent with the results shown in Table I. Combined with the analysis of the XRD pattern in Fig. 1, we therefore conclude that the phase enriched with Al and Ni is NiAl phase with ordered B2 structure. EDS analysis of zone B in Fig. 3 shows that the phase is enriched with Cr and Fe and the atomic ratio of Cr:Fe is also close to 1:1. According to the XRD results in Fig. 1, we can infer that solid solutions with [Cr, Fe] is formed in this area.
The BSE image of non-etched Al1.3CrFeNi alloy.

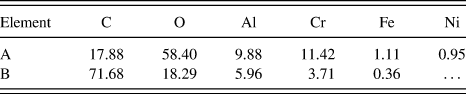
EDS determined compositions (in at.%) of non-etched Al1.3CrFeNi alloy.

As is shown in Figs. 2 and 3, the significant difference between the two is the existence of slit-shaped pores, cavities, and skeletons. This phenomenon can be explained by the results of EDS in Tables I and II. The chemical composition of the alloy was listed in Table I, and the SEM images are shown in Fig. 2. It presents that the contents of Cr and Fe are much less than those of other two elements compared to the nominal composition of Al1.3CrFeNi. But in Table II, the phase in zone B contains more Cr and Fe. Therefore, we can infer that the loss of Cr and Fe is corroded by aqua regia. For aqua regia, NiAl phase has higher corrosion resistance than [Cr, Fe]. That’s why the alloy skeletons are mainly composed of Al and Ni. In addition, in Fig. 2(b), the contents of Cr and Fe are more than those in Figs. 2(a) and 2(c), which may be led to the lack of sufficient corrosion.
B. Oxidation behavior
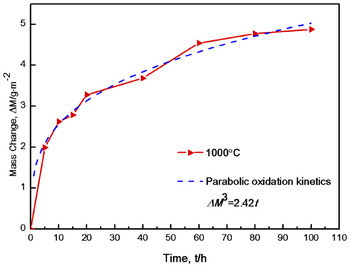
Figure 4 shows the oxidation dynamic curve of Al1.3CrFeNi alloy at 1000 °C. Before 20 h, the weight change of the specimen increases heavily and the alloy has a high oxidation rate in this period. During 20–100 h, the oxidation rate decreases slowly. At the initial stage of the oxidation, the kinetics for Al1.3CrFeNi alloy doesn’t conform to the parabolic rate law very well. This is mainly because the existence of transient oxidation. As the transient period converts to the steady-state conditions, oxidation kinetics for this multi-component alloy eventually obeys the parabolic rate law. The parabolic oxidation rate index n for Al1.3CrFeNi alloy is calculated by Reference Wagner37
 $$\Delta {M^n} = kt\quad .$$
Here ΔM is the weight change of the specimen per area, k is the oxidation rate constant, and t is the exposure time. For Al1.3CrFeNi, the n is 3, which means that the oxidation of this alloy at 1000 °C follows a cubic parabolic rate law. In addition, from the dynamic curves in Fig. 4, it can be seen that the whole mass change of this alloy is less than 5 g/m. Reference Cantor, Chang, Knight and Vincent2 This indicates Al1.3CrFeNi has a relative oxidation resistance at 1000 °C.
Oxidation dynamic curve of Al1.3CrFeNi alloy at 1000 °C for 100 h.

Figure 5 shows the XRD pattern of the alloy surface after oxidation at 1000 °C. In the oxidation process, matrix, oxides, and spinel diffraction peaks are observed. Ordered B2 and bcc diffraction peaks of the matrix are still the strongest, indicating that the oxides scale formed at 1000 °C may not be very thick. According to the XRD pattern in Fig. 5, the predominant oxides are Al2O3 and Cr2O3. There is also FeCr2O4 spinel. In addition, some weak diffraction peaks couldn’t be identified what phases these peaks virtually represent. This may be resulted by the lacking volume of oxidation products.
XRD pattern of the oxidation surface of Al1.3CrFeNi alloy oxidized at 1000 °C for 100 h.

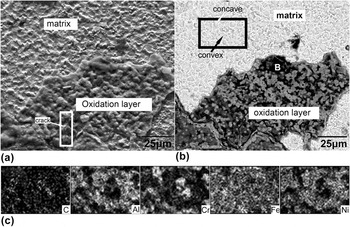
The SEM morphology of oxidation surface of Al1.3CrFeNi alloy is shown in Fig. 6. In Fig. 6(a), the dark zone is obviously the oxidation scale and the light zone is the matrix exposed beneath the oxidation layer. Besides, cracks are also found on the oxidation film. More detailed information can be detected in Figs. 6(b) and 6(c). Combined with the EDS results in Fig. 6(c), the concave area of the matrix is enriched with Al and Ni, and Cr gathers in the convex area. In Fig. 6(b), gray and black parts are marked with A and B. Table III shows the chemical compositions of these two areas. Either in zone A or zone B, the contents of Fe and Ni are very poor. A large amount of C is observed on the external scale. It is inferred that the element of C is adhered due to the elemental pollution in processing.
Surface SEM morphology and EDS results of Al1.3CrFeNi alloy oxidized at 1000 °C for 100 h: (a) secondary electron (SE); (b) BSE; (c) EDS.

Elemental distribution of the oxidation layer after 1000 °C oxidation.

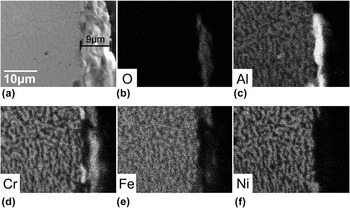
Figure 7 presents the morphology and distribution of elements in the whole oxidation scale. As is shown in Fig. 7(a), the thickness of the oxidation layer is approximately 9 μm. Little cavitations are detected at the metal–oxide interface, which means that the cracks mentioned in Fig. 6(a) are not caused by cavitations between the matrix and oxidation film. Depending on the elemental distribution in Figs. 7(b)–7(f), the constitution of oxidation scale can be identified clearly. This scale is mainly divided into two layers. The subscale precipitate is mainly aluminum oxides and the outer scale consists of chromium oxides, which are shown in Figs. 7(b)–7(d). In Fig. 5, the predominant oxidation products has been identified as Al2O3 and Cr2O3. For this multi-component alloy, the chromium and aluminum are selectively oxidized to form an external scale of Cr2O3 and an internal subscale of Al2O3. Especially, a dense and continuous layer of Al2O3 can be clearly recognized. Besides, very few iron oxides can be found in the oxidation layer in Fig. 7(e). Considering the results of XRD in Fig. 5, the iron oxides were identified as FeCr2O4 spinel.
Cross-sectional micrographs and scattergram of oxide scale on Al1.3CrFeNi alloy oxidized at 1000 °C for 100 h: (a) cross-sectional SEM image; (b)–(f) distribution of different elements.

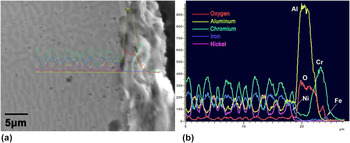
To describe the constitution of the oxidation scale in detail, a representative transverse section of the complete oxide scale was chosen and Fig. 8 is the magnifying photomicrograph. Dense oxide scale is obviously observed. According to the analysis above, this scale mainly owns a duplex oxide layer and Fig. 8 presents the similar results. Combined with the analysis of XRD in Fig. 5, EDS results in Fig. 8(b) show that the outer scale is Cr2O3 while the subscale precipitate is mainly composed of Al2O3. Both thickness of Al2O3 and Cr2O3 layer are approximately 5 μm. And a 2 μm mixing layer was also observed between these two oxide scales. In addition, iron oxides like FeCr2O4 were also found in the oxide scales.
EDS of cross-section elements of Al1.3CrFeNi alloy oxidized at 1000 °C for 100 h: (a) location of EDS, (b) EDS results.

C. Oxidation mechanism
According to the Ellingham Diagrams of metallic oxidations, at 1000 °C,
 $\Delta {G^\theta }_{{\rm{A}}{{\rm{l}}_2}{{\rm{O}}_3}} \lt \Delta {G^\theta }_{{\rm{C}}{{\rm{r}}_2}{{\rm{O}}_3}} \lt \Delta {G^\theta }_{{\rm{FeO}}} \lt \Delta {G^\theta }_{{\rm{F}}{{\rm{e}}_3}{{\rm{O}}_4}} \lt \Delta {G^\theta }_{{\rm{NiO}}} \lt \Delta {G^\theta }_{{\rm{F}}{{\rm{e}}_2}{{\rm{O}}_3}} \lt 0$
. This means that all oxidation reactions of metal elements in Al1.3CrFeNi alloy can proceed spontaneously. The lower the Gibbs free energy is, the better affinity with oxygen the metal element has. Therefore, among those probable oxidation products, Al2O3 is the most stable oxide based on thermodynamic considerations.
However, kinetics of oxidation also plays a significant role in the oxidation mechanisms of all alloys and kinetic contributing to the oxidation behavior of multi-component alloys couldn’t be neglected.
According to some fundamental studies of multi-component alloy oxidation, Reference Giggins and Pettit38,Reference Kear, Pettit, Fornwalt and Lemaire39 for all alloys, before steady-state conditions of oxidation is established, transient oxidation will first be carried out in the initial several hours. In this very short period, the fast uptake of oxygen by the alloy leads to the localized, nonuniform oxides including spinel. This can affect the oxidation behaviors in the initial oxidation period. As shown in Fig. 4, the oxidation curve doesn’t follow the parabolic rate law in the ∼5 h period. It is very important to emphasize the transient oxidation. However, due to the short period of oxidation (usually less than 1 h), oxides formed in this transient period could not be observed after 100 h due to their too small amounts. In addition, these oxide phases also can dissolve in the continuous oxide scales along with the oxidation.
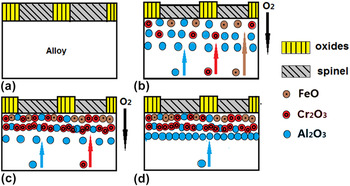
Combined with all the results that have been obtained above, the following simplified model can be built to describe the oxidation behavior of Al1.3CrFeNi. At the initial stage of oxidation, interfacial reaction plays a leading role because of the high oxygen partial pressure on the surface of the alloy. The rapid uptake of oxygen converts the surface layer of the alloy to oxides. In this transient oxidation, all elements contained are able to oxidize forming localized oxides including spinel because of little diffusion. As illustrated in Fig. 9(a), the predominantly oxides are probably oxides/spinel.
The simplified model of 1000 °C oxidation for Al1.3CrFeNi alloy: (a) transient oxidation; (b) diffusions of aluminum, iron and chromium; (c) formation of mixing scale composed of Al2O3 and Cr2O3; (d) dense Al2O3 scale.

As the oxidation is carrying on, diffusional processes start to influence the reaction. Because of the external scale of oxides/spinel, the oxygen activity of oxidizing chromium and aluminum is not sufficient. So oxygen moves into the alloy. It is known that the oxygen activity required to oxidize chromium is larger than that required to oxidized aluminum. Thus aluminum in deeper locations also can be oxidized. Meanwhile, further diffusion of iron occurs in the discontinuous oxide scales. In the external mixture scale of Al2O3 and Cr2O3, possible substitution of Cr cations by Fe cations occurs and spinel of FeCr2O4 is formed. As is shown in Fig. 9(b), FeCr2O4, Cr2O3 and Al2O3 precipitates are formed: the outer scale contains all these three precipitates and mixture oxides of Cr2O3 and Al2O3 is beneath the external one. This can be identified by the XRD pattern in Fig. 5 and SEM morphologies in Fig. 6. In addition, the incompact internal Al2O3 scale is also formed at the same time.
As the oxidation reaction continues, the combined precipitated Cr2O3 and Al2O3 in the middle scale inhibit the diffusion of oxygen from the outer scale into the alloy. The internal diffusion of aluminum and chromium promotes to form the additional subscale of Al2O3 and Cr2O3 as illustrated in Fig. 9(c). After several hours, precipitated Al2O3 begins to transform to a continuous scale at the outer edge as shown in Fig. 9(d). By that time, the oxidation reaction is controlled by transport of aluminum through the internal scale of Al2O3. At last, the oxide products are formed and distribute in the respective locations as illustrated in Figs. 7 and 8.
IV. CONCLUSION
In this paper, the microstructure of Al1.3CrFeNi eutectic HEA and its oxidation behavior at 1000 °C were investigated.
The Al1.3CrFeNi alloy has double bcc/B2 structure. Both NiAl and [Cr, Fe] solid solution distributed alternately in the matrix of the EHEA. Typical eutectic structure is composed of these two phases.
In the oxidation process at 1000 °C for 100 h, oxidation kinetics for this multi-component alloy eventually obeyed the cubic parabolic rate law. The oxidation products are mainly composed of Al2O3 and Cr2O3. Besides, FeCr2O4 spinel was also observed in the outer oxide scale. During the oxidation period, some transient oxides were formed first and then chromium was oxidized. At the same time, Al2O3 was formed internally and began to transform to a continuous scale at the outer edge. By that time, further diffusion of Fe occurred and FeCr2O4 spinel was formed by substitution of cations. Finally a simplified model of the oxidation behavior was obtained to describe the oxidation mechanism of Al1.3CrFeNi eutectic HEA at 1000 °C.
ACKNOWLEDGMENT
This research was financially supported by the National Natural Science Foundation of China (No. 51671214).