


INTRODUCTION
The term infectious intestinal disease (IID) is used to describe gastrointestinal symptoms (diarrhoea, vomiting and abdominal pain) due to microorganisms or their toxins. It is one of the leading causes of morbidity and mortality worldwide [Reference Farthing1–Reference Todd3]. In developed countries, improvements in hygiene and treatment of disease have radically reduced the number of deaths. The clinical course of IID is often self-limiting, however, the morbidity remains high [Reference Mead4].
In Malta, surveillance of IID relies on statutory notification from general practitioners (GPs), hospital physicians and laboratories. Such routine sources of information provide important information. However, they underestimate the burden of this condition due to under-reporting, and do not capture cases who do not seek medical care. This indicates that there must be a significant gap in information describing the magnitude of IID, especially at the population level. The use of representative population studies is one way to measure the magnitude and distribution of IID more accurately. Malta embarked on a series of studies from 2003 to identify the gaps in the surveillance of IID at community, GP, hospital and laboratory levels. This paper describes the population study which was designed to study the magnitude and distribution of IID in Malta at community level.
METHODS
The study was a retrospective cross-sectional study of a random sample of persons. It was designed as an age-stratified sample to have equal representation of the sample to the general population with respect to age structure. The number of participants required per defined age group was calculated based on population estimates of December 2003, which in turn were based on the Malta 1995 census. The telephone interviews were administered between April 2004 and December 2005. The study population consisted of all Maltese residents (residing in Malta and Gozo for more than 6 months) and included all age groups (population of approximately 400 000). The sample was drawn from the general population database which is based on all registered persons in Malta [5].
The questionnaire was developed by modifying questions from validated tools used in UK cohort IID study [6] the Centers for Disease Control and Prevention (CDC) FoodNet (A. Banerjee, personal communication), Australian Oz FoodNet study (M. Kirk, personal communication, 2003), Canadian Study (J. Flint, personal communication, 2001), Ireland (E. Scallan, personal communication, 2001) and The Netherlands study (Y. Van Duynhoven, personal communication, 2001). The questionnaire was also back-translated into the Maltese language. The telephone interviews were conducted by specifically trained public health doctors. Participants were asked about symptoms of IID and were defined as cases or non-cases based on the following case definitions.
Case definition for cases
Inclusion criteria
Individuals who reported at least three episodes of diarrhoea (defined as loose stools) within 24 h or vomiting at least three times in 24 h, or suffered diarrhoea or vomiting with two or more additional symptoms in 24 h over the previous 28 days. Additional symptoms sought included abdominal cramps, abdominal pain, fever, nausea, blood in stool or mucus in stool.
Exclusion criteria
Individuals reporting any pre-existing illness or non-infectious conditions diagnosed by a medical doctor in which vomiting/diarrhoea was a symptom or who were concurrently taking any medications which could cause diarrhoea/vomiting as side-effects.
A pilot study on an age-stratified sample of 100 persons was set up to establish the basis of the sample size calculations, to test the survey instrument and methodology, and to identify operational problems in the study [Reference Gauci7]. These interviews were conducted over a 3-month period from August to October 2003. During this period, 5·0% [95% confidence interval (CI) 9·27–1·73] of people were estimated to have suffered from IID in the previous 28 days. This estimate was used to calculate the sample size for the population study. The target sample size of 2652 was required to allow for the frequency of IID to be estimated to within a 95% CI of ±0·83%.
The data obtained from the study was analysed using Microsoft Excel 2000 (Microsoft Corporation, Washington, USA) and SPSS version 14 for Windows (SPSS Inc., Chicago, IL, USA). In order to adjust for any possible differences between the sample and the general population, weighting was applied in SPSS so that any of these differences will be accounted for and result in more precise observations. Results given are adjusted using these weights. Period prevalence was defined as the number of respondents who met the case definition of IID divided by the total number of respondents. The occurrence of IID per person per year can be calculated as (365/28)×(period prevalence) since the period of observation was 28 days. Since the questionnaire did not ask how many episodes of IID occurred in the 28-day period, the exact rate cannot be directly calculated. However, once the mean number of separate episodes of IID per person per year is known, the probability of observing a particular number of episodes in a time period can be estimated using the Poisson distribution. This distribution is appropriate for describing the number of occurrences of an event during a period of time. If one assumes that IID episodes occur independently of each other and that they occur at random, then IID will follow a Poisson distribution. The number of events has a Poisson distribution with parameter λ if the probability of observing x events is equal to:

where λ is the mean number of episodes in a time period, e is the base of the natural logarithm, 2·7183, and x is the number of episodes.
For statistical purposes, Malta is divided into six main regions including the South Harbour district; North Harbour district; South Eastern district; West district; Northern district and Gozo and Comino. Differences in rates between each area was analysed using logistic regression analysis.
The study was approved by the University of Malta Research Ethics Committee.
RESULTS
Response rate
An initial sample of 3710 persons was selected. Of these, 197 could not be traced, therefore a total of 3513 persons (94·7%) were contacted over a 21-month period from April 2004 to December 2005. Of the persons with whom contact was made at any point in time, 3504 participated, giving a response rate of 99·7%.
Representativeness
It was not technically feasible to interview the exact required numbers within the defined age groups although the total sample size required was still attained. On comparison of the sample which was interviewed with the general population structure, there was no significant difference in terms of age and gender structure.
Period prevalence of IID
Of the 3504 persons interviewed, a total of 99 respondents met the case definition of IID. This gives a period prevalence of 99/3504=2·83% (95% CI 2·24–3·42). The adjusted number of cases according to gender and age group are shown in Table 1.
Expected number of cases in the general population per year per age group and gender based on at least estimate rate (assuming only one episode occurred in the 28-day retrospective period)

CI, Confidence interval.
Overall there are 12 430 persons expected at any point in time who say they had at least one episode of IID in the previous 28 days in the general population (95% CI 2995–22 423) with a rate of 3181·74/100 000 population (95% CI 766·56–5739·62) or 3·18% (95% CI 0·7–5·74).
The total number of expected male cases in the general population is 7335 (95% CI 1952–13 072). A total general population of 193 917 males, gives a rate of 3781·07/100 000 population (95% CI 1006·21–6738·96) or 3·78%. For females, the expected number of cases in the general population is 5098 (95% CI 1044–9355) and with a total general population of 196 752 gives a rate of 2591·05/100 000 population (95% CI 530·37–4754·7) or 2·59%.
Rate of IID per person per year
The estimate of 3·18% is the percentage of persons in the population who, at any point in time in the year, could report having had at least one episode of IID in the previous 28 days. The occurrences per person per year is (365/28)×(3·18/100)=0·415. However, in the study, there were 16 respondents who reported more than one episode of IID in the previous 28 days. Hence the rate of 0·415 episodes per person per year is an underestimate.
Using the Poisson distribution, a mean rate of 0·421 (95% CI 0·092–0·771) separate episodes of IID per person per year is obtained. When this figure is extrapolated to the general population, it corresponds to 164 471 (95% CI 35 941–301 205) episodes of IID per year in the Maltese Islands or an equivalent of 450 (95% CI 98–825) episodes of IID each day.
Geographical distribution
In defining the percentage of cases per geographic area, it is apparent that there is a higher percentage of cases in the North region than in other areas, although this is not statistically significant.
Seasonal distribution
By plotting the data on the percentage of cases out of the total persons interviewed per week of study over 2004–2005, and looking at the moving average, peaks were observed in week 24 in 2004 (June) and week 26 in 2005 (July). The peak in IID in July 2005, was found to be correlated with the peak in temperature by logistic regression analysis. A high plateau was also seen in weeks 40–47 (October–November 2005) (Fig. 1).
Frequency of weekly reporting IID in 28 days prior to interview during study period 2004–2005 and mean temperature, with 5-week moving averages. - - - -, Percent cases; , mean temperature;
 , 5-week moving average (% cases); —, 5-week moving average (mean temperature).

Socio-demographic characteristics of cases
When weighted for age gender differences, of the 99 cases which fit the case definition, there was a male:female ratio of 50·8:49·2 in IID. However, this difference was not significant (χ2=0·243, P=0·242).
On the other hand, age was statistically significantly associated with developing IID (P=0·002). The greatest prevalence of IID occurred in the <5 years age group. For the younger age groups aged up to 1 year, males predominated (Fig. 2).
Percentage prevalence of IID in study population per age and gender. ■, Male; □, female.

The highest proportion of cases had completed education up to Form 5 without continuing further education indicating that the majority of cases were of a lower educational level. With respect to the highest education attained by anyone in the household, the highest level attained was a year less than full education.
Duration of illness
Cases were asked for the duration of symptoms, and 18·2% of cases were still symptomatic at the time of interview. Thus, the exact duration of illness in these cases was not known. Overall (excluding the 18 cases who were still symptomatic), using weighted data, the mean duration of illness was 4·14 days (95% CI 2·21–6·07) with a median duration of 3 days. If the cases who were still symptomatic were to be included in the analysis (duration taken up to the time of interview), the mean duration of illness was 4·57 days (95% CI 3·54–5·60) yet the median duration remains at 3 days. This still gives an underestimate, since the duration of illness for cases who were still having symptoms may be longer.
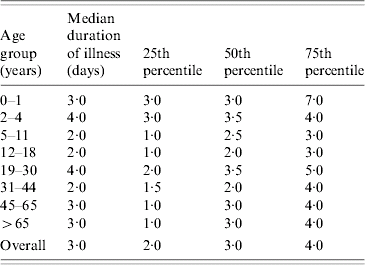
A more accurate estimate can be worked out using Kaplan–Meier life tables. Using the life-table method, the mean and median duration of symptoms can be estimated utilizing the duration of symptoms for the cases who are still symptomatic (censored cases) up to the time of interview. Using this method, the mean duration of symptoms was 6·79 days (95% CI 4·21–9·37) with a median of 3 days. The data for the duration of illness is skewed with a few cases experiencing lengthy duration of illness. The three methods used for calculating the duration of illness all resulted in a 3-day median hence it seems that this is the most useful for describing the population experience. The median duration of illness with IID per age group is shown in Table 2.
Median duration of illness with IID by age group
Predisposing factors
Cases were asked about the use of medications with potential gastrointestinal consequence taken prior to their illness. Overall, 7% had taken antibiotics, 3·2% antacids and 0·8% took immunosuppressive agents. None of the cases had taken laxatives or other medications that directly cause vomiting or diarrhoea.
Reporting on the suspected source of their illness, 64·24% suspected person-to-person transmission, whilst 18·54% of cases suspected that consumption of contaminated food was the cause of their illness. Of those suspecting food as a cause for their illness, 30·95% indicated their own home as the suspected source.
Other cases in household
Forty percent of cases reported that at least one other person living in the same household had suffered from IID in the previous 28 days. In 16·6% of cases, the case interviewed was the index case.
Travel-related illness
Of the cases, 4·2% were related to travel abroad including Ireland, Canada, Russia and the United Kingdom in the 7 days prior to onset of illness.
DISCUSSION
This was the first epidemiological study of IID in Malta at community level. In designing the study, the options for different methodologies were carefully studied and consideration was given to performing either a cohort or a cross-sectional study. Various factors were assessed including the feasibility, costs, limited human resources, time limitations and also the inherent biases, which exist with each type of study [Reference Gauci7].
The main aim of the study was to describe the epidemiology of IID in the community hence the general population database, was used for the extraction of the sample. Many studies have shown that IID, like most infectious diseases, is age-dependent. Therefore, a representative sample stratified by age groups was selected. The age groups were defined according to particular categories of persons who have different risk factors in different stages of life. Interviews were conducted by telephone, which has been recommended as a viable alternative to costly face-to-face surveys in cross-sectional studies of the general population [Reference Marcus and Crane8]. It also allowed interviews to be carried out from one central location so they could be supervised. Persons who did not own a telephone were contacted by postal mail. However, these persons were still at a disadvantage due to reduced accessibility to contact the interviewers. This group may be slightly underrepresented and it is known that predominantly individuals from the lower social class do not own a telephone. Omission of non-telephone owners has been shown to introduce only minor bias into estimates for the population [Reference Freeman9]. Another possible option for sampling would have been by using the random digit dialling method which has been used in other studies [Reference Scallan10, Reference Majowicz11]. However, this would not give the required age-structure distribution of the general population which an age-stratified sample would.
The high response rate was an encouraging sign for the validity of the study which may be explained by the fact that the questionnaire was quite short. Also the interviews were carried out by trained doctors whom most people in Malta regard highly.
The study showed that IID is a potentially important public health problem causing a relatively large burden of illness in the community. The estimated rate of IID in Malta is comparable to a similar retrospective study conducted in Ireland with 0·6 episodes of acute gastroenteritis each year [12, Reference Scallan13]. Other retrospective studies showed different rates: 1·4 per person per year in the United States [Reference Herikstad14]; 3·8% in Sweden [Reference Lidqvist15]; 0·55 per person per year in the United Kingdom in 1994 [Reference Feldman and Banatvala16, Reference Palmer17]; 1·3 per person per year in Canada [Reference Majowicz11]; 1·63 per person per year in adult cases and 2·27 per person per year in children in Queensland [18] and 1·21 per person per year in Norway [Reference Kuusi19]. However, these retrospective studies were carried out a number of years before the study in Malta and from reported statistics, there has been a decline in enteric illness over this period [Reference Rocourt20]. Therefore the lower rate estimated from the study in Malta is expected. In fact, the rate in Ireland which is the most recent study is closest to the rate in Malta.
Prospective cohort studies tend to give lower rates with a rate of 0·28 episodes per person per year in The Netherlands [Reference de Wit21] and a rate of 0·194 in the United Kingdom [Reference Wheeler22, Reference Tompkins23]. Comparison between countries is very difficult since the study designs are different and the studies also utilized different case definitions, which have been shown to have a large impact on the estimated rates [Reference Majowicz and Stacey24]. Higher prevalence of IID in children is similarly found in other international studies [Reference Herikstad14, Reference Kuusi19–Reference Wheeler22, Reference Monto and Koopman25]. This may be due to relatively underdeveloped immune systems; small infectious dose required in children; close contact with other children in nurseries and contact with pets. Of the cases, a high percentage was females aged 31–44 years; this has also been seen in other studies [12, Reference Kuusi19, Reference Monto and Koopman25]. These groups of females are usually at the child-rearing age so they may have greater exposure to pathogens from their children and via food preparation in the kitchen. Contrary to other studies [12, Reference Kuusi19, Reference Hoogenboom-Verdegaal26], this study found no specific gender at higher risk of IID. The picture of a greater number of cases in lower educational levels is in contrast to that seen in some [12, Reference Herikstad14, Reference de Wit21, Reference Bytzer27] but not all international studies [Reference Feldman and Banatvala16].
The higher rate of IID in the North region of Malta could be due to the increased predominance of food outlets in the area leading to a riskier behaviour. The first peak among cases found in 2005 coincided with a peak in ambient temperature. Temperature rise has been associated with bacterial foodborne illnesses in international studies [Reference Patz, Engelberg and Last28, Reference Kovats29]. The other peak found is typically associated with community viral gastroenteritis [Reference Mounts30, Reference Cook31].
The mean duration of illness was slightly higher than that reported in Ireland (4 days) [12] and the United Kingdom (3·9 days) [6]. The high suspicion of person-to-person transmission is known to be one of the major routes of transmission. Of the cases reporting suspected foodborne illness, the home was the most suspected source which is in line with data from national surveillance [32]. However, this is based on people's perception of the cause of illness and may not be accurate.
The substantial number of people reporting the use of antibiotics in the previous 28 days may increase the likelihood of infection upon exposure to foodborne pathogens [Reference Braza and Travers33].
Of the many cases reporting other persons in the household with IID, this may be the result of a common food item causing illness or person-to person transmission. In some of the cases, travel abroad within the incubation period was reported, indicating the importation of IID in Malta from other countries. In fact, of the IID cases reported during 2005, 0·85% were imported [34].
The main limitation in this study is recall bias, which may arise because individuals with a particular condition are likely to remember their experiences differently from those who are not similarly affected. One form of recall bias called ‘telescoping’ is especially important in this type of study (the tendency for people to displace events in time). This would tend to give an overestimate of the frequency of IID [Reference Van den Brink, Bandell-Hoekstra and Abu-Saad35]. Attempts were made to reduce this bias by asking the actual date of onset, which gives more accurate results. Another bias is observer bias which can be systematic. The reduction of this type of bias was attempted by intensive training of the interviewers.
This study provides the first Maltese population-based estimate of the magnitude and distribution of IID in the general population. IID poses a significant health burden in the community with higher rates in the 31–44 years age group and those aged <1 year. Overall, the temporal distribution was bimodal with peaks in June–July and October–November. The data were provided from a representative sample of the population with respect to age and gender and, hence the results are generalizable to the population.
ACKNOWLEDGMENTS
We thank our colleague doctors working at the Disease Surveillance Unit, within the Department of Public Health for their professionalism and diligence in carrying out the interviews and the respondents for their cooperation. We also thank Dr Christopher Barbara, Consultant Virologist; staff at Public Health Laboratory, Pathology Department, St Luke's Hospital and at Istituto Superiore di Sanita; Dr Malcolm Micallef, Director of Public Health; Dr Karen Vincenti, Consultant in Public Health; Dr Shannon Majowicz, Epidemiologist at Health Canada and Dr Elaine Scallan, Epidemiologist at CDC Foodborne Diseases Active Surveillance Network (FoodNet) for their invaluable help.
DECLARATION OF INTEREST
None.



