


Introduction
Mosquitoes are an important public concern because of their nuisance and their ability to transmit pathogens. Life history traits of mosquitoes strongly depend on environmental factors. Meteorological parameters, such as temperature or relative humidity, affect the duration of larval development, the adult life span, the adult behavior, etc. (Clements, Reference Clements1999). Immature stages are aquatic and their dynamics are driven by the persistence and quality of their habitats. These attributes also determine adult emergence and population abundance (Becker et al., Reference Becker, Petric, Zgomba, Boasse, Dahl, Lane and Kaiser2003). Thus, relating the meteorological inputs with mosquito abundance is essential to predict the population dynamics with the aim to focus, in time and space, on nuisance or vector-borne disease control programs (Shaman et al., Reference Shaman, Stieglitz, Stark, Le Blancq and Cane2002; Bicout & Sabatier, Reference Bicout and Sabatier2004; Shone et al., Reference Shone, Curriero, Lesser and Glass2006). In addition, this is also the first step for vectorial capacity models and further risk map. Both nuisance and vector-borne disease risk are real threats in the Camargue region.
The Camargue, the Rhone River delta, is the main wet area of southern France, covering 150,000 hectares. This area hosts numerous ecosystems, among which are marshes offering large breeding sites for Aedes caspius, the most abundant floodwater mosquito species, which is active from March to November (Rioux et al., Reference Rioux, Croset, Corre, Simoneau and Gras1968). In this region, marshes are flooded occasionally by anthropogenic irrigations and, mainly, by rainfall that, thus, control the associated mosquito population dynamics. Spring rainfall allows the egg hatching followed by emergence waves of adults. Due to the Mediterranean weather, rainfall occurs as rare events during the summer, leading to accumulation of laid eggs. In autumn, abundant rainfall floods large surfaces, leading to massive and synchronous adult emergences. Due to their large dispersal capabilities and feeding habits (mammals including humans), Ae. caspius is the main nuisance species in the Camargue (Rioux et al., Reference Rioux, Croset, Corre, Simoneau and Gras1968). For instance, in September 2005, the nuisance was so great that schools were closed and football matches canceled in and around the Camargue, where a one-night trapping collected about 250,000 mosquitoes with a single CO2 trap (EID Méditerranée, unpublished data).
According to virus isolation from field-collected mosquitoes, experimental infections and their feeding habits, Ae. caspius is probably the main Tahyna virus vector in the Camargue (Hannoun et al., Reference Hannoun, Panthier and Corniou1966; Moreau et al., Reference Moreau, Bihan-Faou and Sinègre1976). Tahyna virus is a Bunyavirus, belonging to the California group, causing febrile illness with potential meningitis in humans (Lundström, Reference Lundström1999). In the Camargue region, serological prevalence reached 99% in horses and rabbits, and 50–80% in humans in the 1960s (Rodhain & Hannoun, Reference Rodhain, Hannoun, Vesenjak-Hirjan, Porterfield and Arslanagic1980). Moreover, Ae. caspius populations from the Camargue appeared to be susceptible to infection with Rift Valley fever (RVF) and Chikungunya viruses (Moutailler et al., Reference Moutailler, Krida, Schaffner, Vazeille and Failloux2008; Vazeille et al., Reference Vazeille, Jeannin, Martin, Schaffner and Failloux2008); and, thus, Ae. caspius should be considered a suggested vector of these viruses in France.
Our aim is to develop a comprehensive model relating the Ae. caspius abundance as a response to rainfall and temperature. We used a simple mechanistic model to describe the population dynamics of Ae. caspius by solvable deterministic differential equations. The laboratory development data of larvae and pupae were used to determine model parameters and their functional dependence with temperature. Finally, the model was used to fit field data from a two-year CO2 trapping survey and determine the model parameter values.
Material and methods
Model
Floodwater mosquitoes, like some Aedes species, lay their eggs in the moist soil at the base of glasswort and of rush plants (Rioux et al., Reference Rioux, Croset, Corre, Simoneau and Gras1968). Eggs can resist desiccation until the flooding of breeding sites that triggers egg hatching and onset of aquatic stages (Becker et al., Reference Becker, Petric, Zgomba, Boasse, Dahl, Lane and Kaiser2003). Aquatic stages involve four successive larva stages plus a pupa with the duration of aquatic immature development, which clearly depends on the temperature (Clements, Reference Clements1999). Successive to the aquatic phase, adults emerge and mate, and females start cycles of host-seeking, egg maturation and oviposition. Adults disappear from the area under observation because of both mortality and dispersion. Mosquito abundance results from the successive waves of adult emergences due to different flooding of the breeding sites.
As only females take blood-meals, the following model will deal only with the female population (see table 1 for parameter definitions). Let t 0 be the onset date of immature aquatic stage, i.e. the date of the breeding site flooding resulting in the hatching of E 0 eggs. After the duration of aquatic development (three moltings and pupation), the first female mosquito will emerge at t=t 0+t dev, where t dev denotes the time duration from egg hatching to female emergence onset. Instead of detailing the dynamics of all aquatic stages, we rather used an emergence rate function f(t) that recasts all the historical dynamics from egg hatching to emergence. We assume that at any time, t, the time variation of the total number of Aedes females M(t) following a single flooding event can be described as:

where α is the depletion rate, resulting from the combination of both mortality rate αm and dispersion rate αd, with α=αm+αd, and f(t) the emergence rate function of adult mosquitoes, defined as:

where  denotes the total number of emerged females (M 0 is a function of E 0, the aquatic survivals and the sex-ratio at the emergence) and
 is half of the mean elapsed time between the first and last emergence of the M 0 mosquitoes. The duration 1/α can also be regarded as the mean time of mosquito persistence in the area of observation. The solution of the equation 1 is:
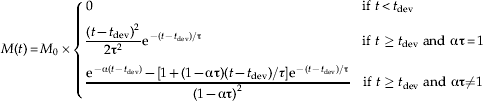
Figure 1 illustrates the M(t) and f(t) profiles following the flooding of the breeding site.
Parameters used in the model.

Illustration of the profiles of f(t) and M(t) following the flood of a Aedes caspius breeding site, with M 0=1000, t dev=20 days, τ=4 days, and α=0.2 per day (—, M(t); - - - - -, f(t)).

As defined, this model can be used to describe population dynamics of floodwater mosquitoes, such as Ae. caspius, Aedes vexans or Aedes detritus, in the Camargue. In the rest of the paper, the model will be applied to Ae. caspius population dynamics to reproduce the observed abundances in response to flooding events (rainfall or irrigation) as model inputs.
Laboratory data
Temperature dependence of parameters t dev and τ were determined from previous laboratory data (Sinègre, Reference Sinègre1974). Experiments consisted of batches of 100 newly emerged larvae of Ae. caspius, from the Camargue, that were reared to the adult stage at ten different temperatures ranging from 4.5 to 33°C. Larvae were bred in plastic pans (20×30×7 cm) with one litre of water steadily ventilated and were fed with 1 mg per larva per day of pet food. After the appearance of the first pupa, the emerged males and females were counted every 12 h. From these data, t dev was assessed for each temperature and τ was estimated by fitting the observed data with the function f(t) defined in equation 2. The fit accuracy was assessed by calculating the Pearson correlation coefficient between the observed and simulated data (Zar, Reference Zar1999).
Field data
Two sites in the western Camargue were studied: Mourgues (MO; 4°15′52″E; 43°30′45″N) and Pont de Gau (PDG; 4°23′34″E; 43°30′04″N). One-night CO2 trapping was carried out weekly from 18 May to 26 October 2004 and from 13 April to 25 October 2005 to determine the field abundances of Ae. caspius females. In each site, one trap was installed, ≈1.5 m above the ground, from between 3 pm and 9 am the following day. Collected individual adults were brought to the laboratory, frozen, sorted by species and counted. Dates of flooding events were recorded during the two years of survey. A flooding event was defined as a rainfall of more than 15 mm or anthropogenic irrigation of the study areas reported by the EID Méditerranée. Rainfall was recorded daily by the MeteoFrance station at the Saintes-Maries-de-la-Mer located 7 km and 14 km from PDG and MO sites, respectively.
For each flooding event, the emergence date was calculated as described above. The value of t dev was estimated from the temperature dependence equation, based on laboratory data, and from the mean temperatures recorded by the MeteoFrance station (precisely the mean of daily temperatures during t dev days after the flooding event). Aedes caspius abundances were simulated from the equation 3 and the algorithm ‘lsqcurvefit’ (from the optimisation toolbox of Matlab version 7: Matlab, 2008) was used, for each emergence, to determine the M 0, τ and α which best fitted the observed data. During the optimization process, the variation boundaries for parameters to be determined were set as (0; 15,000) for M 0, (0.01; 0.5) day−1 for α, and (0; 10) days for τ. The accuracy of the model was assessed as described above for the laboratory data. Correlation between estimated values of M 0 or α and environmental parameters was assessed by calculating the Pearson correlation coefficient (Zar, Reference Zar1999).
Results
Laboratory data
The emergence flux function in equation 2 turns out well adapted in reproducing experimental data for each temperature (fig. 2a); the tests of Pearson correlation coefficients between the observed and the simulated data gave r 2=0.82 for 14°C, 0.67 for 16°C, 0.87 for 18°C, 0.64 for 20°C, 0.78 for 22°C, 0.76 for 24.5°C, 0.59 for 28°C and 0.58 for 30°C, with df=11 and P<0.01 for all. The duration of the immature development t dev (assessed directly from experimental data) and emergence time scale τ (assessed by fitting the experimental data) both exhibit Arrhenius behaviour as a function of temperature,
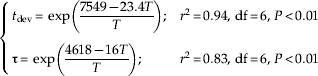
where t dev and τ are in days and T (in Kelvin degrees=Celsius degree plus 273) is the rearing temperature (fig. 2b). Accordingly, t dev equals one day with a temperature of 49.6°C and τ equals to one day for temperature of 15.6°C.
Accuracy of the emergence function and dependence of the aquatic development parameters t dev and τ on temperature. (a) Number of emerged females at 18°C with a 12 h time step; observed data (black histogram) and best fit to data (grey) based on equation 2 with t dev=11.9 days and τ=0.725 days (▪, observed data;  , simulated data). (b) Immature development parameters t dev and τ as a function of the temperature. Straight lines though the experimental data (symbols) represent linear regression in equation 4.

Field data
During the two years of survey, most flooding events (20 of 22) were caused by rainfall with five flooding events in 2004 and seven in 2005 recorded at the MO site in contrast with two in 2004 and seven in 2005 at the PDG site (table 2).
Dates of the flood events, temperatures and calculated duration of aquatic development and emergence dates, and parameters M 0, α and τ estimated by the optimization algorithm for each emergence at both sites (Mourgues and Pont de Gau) in 2004 and 2005.

a These two flood events were due to anthropogenic irrigation; the others were due to more than 15 mm of rainfall.
b Mean of the daily temperatures during the number of days necessary for the emergence in degrees Celsius.
c See text for the calculation method.
d Parameter values were underlined in grey if the estimated value of α was the upper boundary of variation range for the parameter fitting (see text).
Dates of the flooding events and mean temperatures during these events allowed us to calculate the duration of the aquatic development t dev using equation 4 and, thus, assess the emergence date. The parameters M 0, α, and τ were estimated for each emergence (table 2), and the mosquito dynamics was computed and displayed (fig. 3a).
Example of model outputs and dependence of the mean presence time (1/α) on temperature. (a) Number of Ae. caspius females collected per CO2 trap and per collection at the Pont de Gau site in 2005; experimental data (symbols), and simulated data (abundance per emergence, dashed line; and total abundance, solid line). (b) Relation between the mean presence time (1/α days) and the temperature (in Kelvin degrees), with experimental data (symbols) and quadratic regression (line).

The model simulations reproduced the observed Ae. caspius abundances very well. Tests with the Pearson correlation coefficients gave, at the MO site, r 2=0.95 (df=19) in 2004 and r 2=0.83 (df=21) in 2005 and, at PDG site, r 2=0.95 (df=4) in 2004 and r 2=0.87 (df=19) in 2005, with P<0.01 for all.
Note that, during the CO2 trap collections, some of the increases of mosquito caught could not be associated with any flooding event and, thus, with any emergence, such as between the end of July and the beginning of August 2005 at the PDG site (see fig. 3a). These peaks of mosquito abundance could be considered as originating from Ae. caspius immigrations from neighbours areas. Such features were not included in our modelling for simplicity.
Table 2 shows limitations of the optimization algorithm in some cases. When successive flooding events are close in time, as in April and May 2005 at MO site, the fitting procedure predicts only one abundance peak with M 0=855, with the two others being M 0=4 and 0. Moreover, when Ae. caspius abundances exhibit very quick changes, as in September 2005 at the PDG site (fig. 3), the optimization algorithm returns high values for M 0>8000 and α≈0.5 per day. This latter value is close to the upper boundary of variation range and corresponds to a mean presence time of two days for newly emerged female mosquitoes in the site. When the upper boundary of α is increased (up to one per day which, by definition, is the highest value), the optimization always retains the boundary value (data not shown). Thus, these values are clearly optimization artefacts and, thus, were not used to assess the correlation between depletion rates, α, and the mean temperatures. In these two situations (successive flooding events close in time and rapid changes in abundance), an increase of the trapping frequency may avoid these optimization artefacts.
No correlations were found between values of M 0 and rainfall level. Tests with the Pearson correlation coefficients gave r 2=0.31 (df=3, P=0.33) and r 2=0.01 (df=5, P=0.80) at the MO and PDG sites, respectively. We found that the depletion rate, α, exhibits a concave quadratic behaviour with the mean temperatures recorded by the MeteoFrance station (fig. 3b):

where T (in Kelvin degrees) is the mean of the daily temperatures during 1/α days after the emergence. Lower and higher are unfavourable to the depletion as a whole. The minimum presence time was two days for temperature of about 22.5°C.
Discussion
The emergence rate function described in this paper appears to be very adapted to reproducing laboratory data for Ae. caspius and allows us to quantify the dependence of the aquatic development duration on temperature. Moreover, our approach appears useful to fit seasonal field abundances of Ae. caspius solely from two most accessible meteorological data (rainfall and temperature) as inputs. With this model, the depletion rate α, an important parameter for transmission of vector-borne pathogens, is assessed from a simple and widely used entomological technique, a weekly CO2 adult trapping.
Strictly speaking, if the simulated abundances M(t) represent all mosquito females which have emerged from a given breeding site, the CO2 trap does collect only the host-seeking part of that population. In the case where the proportion of trapped female mosquitoes is constant over the time (e.g. because of constant duration of the trophogonic cycle, assuming a constant temperature at this time scale, and constant trap attractiveness), the mosquito abundance from field data is proportional to the true population of female mosquitoes. Therefore, predicting mosquito abundances only from meteorological data as model inputs simply requires computing a priori values of parameters τ, M 0 and α.
Values of τ estimated from experimental data varied between τ=1.33 days at 14°C and τ=0.47 days at 33°C and were lower than those τ estimated from field data, for instance τ=4.77 days at the PDG site in June 2005, whereas the mean temperature was 26°C (table 2). This can be understood as follows. First, freshly emerged females need to mate before seeking hosts, and be potentially collected by the CO2 trap. Thus, the τ estimated from field data includes the mating duration and is larger than that calculated from laboratory data. Second, the flooding of large breeding sites, such as marshes, are progressive; and the disseminated eggs might not hatch at the same time. Moreover, the aquatic development duration depends on other factors besides temperature, such as larval density or food availability, which are not homogenous in the whole breeding site (Becker et al., Reference Becker, Petric, Zgomba, Boasse, Dahl, Lane and Kaiser2003). Finally, the CO2 trap attracts mosquitoes from an area which could cover more than one breeding site. The observed abundance peak could be the result of emergences in several breeding sites with different flooding histories or the result of a migration of mosquitoes from different breeding sites with the same flood history but located at different distances from the trap. This effect of ‘multi-breeding and heterogeneous sites’ obviously increases the value of τ estimated from the field compared to that from laboratory. This version of the model will need improvements to incorporate the multi-breeding site effect in the a priori computation of τ by mechanistically modelling the immature development and their dependence on climatologic data (Fouque & Baumgärtner, Reference Fouque and Baumgärtner1996; Ahumada et al., Reference Ahumada, Lapointe and Samuel2004).
The total number of emerged females, M 0, is obviously correlated with the number of eggs hatched triggered by the flooding event, and thus indirectly correlated with the flooded surface of the breeding site and then with the rainfall level. Nevertheless, the estimated values of M 0 are not correlated with the level of rainfall at both sites, suggesting a more subtle relationship between rainfall and flooded surface. Indeed, flooded surfaces depend not only on rainfall level, but also on the breeding site, i.e. the topography, soil composition and flooding history (presence/absence of water, dry/wet soil). In addition, the Ae. caspius eggs are not homogenously distributed in the breeding site, and their number varies over the season as that number depends on the amount of eggs laid by previous generations of female mosquitoes (Rioux et al., Reference Rioux, Croset, Corre, Simoneau and Gras1968; Gabinaud, Reference Gabinaud1975). Some authors have developed a mechanistic model, which includes physical parameters of the breeding site to link rainfall with the flooded surface and number of hatched eggs (Porphyre et al., Reference Porphyre, Bicout and Sabatier2005; Schaeffer et al., Reference Schaeffer, Mondet and Touzeau2008). Such an approach could be necessary to obtain predictive values of M 0 in our context.
The mosquito lifespan is a key component of the ability of a mosquito species to transmit pathogens. Field estimation of the longevity is very difficult. Main techniques dealing with business are either classical and simplistic (Davidson, Reference Davidson1954; Detinova, Reference Detinova1963) or more sophisticated (Ndiaye et al., Reference Ndiaye, Bicout, Mondet and Sabatier2006), deriving from the parous rate and mark-release-recapture techniques (Service, Reference Service and Service1993). Survival rate can be estimated from the parous rate only with a population showing a relative stable age distribution (Service, Reference Service and Service1993), which is not the case of the explosive population dynamics of Ae. Caspius; mark-recapture methods are quite demanding as they require the release of a large number of marked adults due to the relatively low recapture rates (Service, Reference Service and Service1993). Our approach allows assessing the depletion rate from a CO2 trapping survey, which is by far considerably easier to implement than mark-recapture methods. Nevertheless, like with mark-recapture methods, we are not able to distinguish, in the depletion rate, the part due to mortality from that due to dispersion, which cannot be neglected with a species such as Ae. caspius which is capable of dispersing 20 km (Juminer et al., Reference Juminer, Kchouk, Rioux and Ben Osman1964).
We found that depletion rate was correlated with the temperature following a quadratic relation. Few laboratory studies on the longevity of Ae. caspius populations from Egypt were conducted under different conditions of temperature, relative humidity and diet (Abdel-Malek & Adham, Reference Abdel-Malek and Adham1978). These values of longevity were compatible with longevity data of Ae. caspius populations from the Camargue, assessed for a given temperature and relative humidity (Carron et al., Reference Carron, Bichaud, Platz and Bicout2008). Adel-Malek & Adham (Reference Abdel-Malek and Adham1978) showed that the longevity was linearly correlated with the temperature for a given relative humidity. If, as defined above, the depletion rate is equal to the mortality rate plus the dispersion rate, and assuming that the mortality rate of Ae. caspius is linearly correlated with temperature, the dispersion rate is found quadratically correlated with temperature. Dispersion, thus, seems maximal for a range of moderate temperatures and minimal in low (decrease of activity) and high (risk of desiccation) temperatures (fig. 3).
Mosquito population dynamics, obviously, are driven by environmental conditions (Ahumada et al., Reference Ahumada, Lapointe and Samuel2004; Schaeffer et al., Reference Schaeffer, Mondet and Touzeau2008). Predicting mosquito abundances would be helpful in order to focus on nuisance or vector-borne disease control programs. The relationship between meteorological parameters and mosquito densities could be established by a statistical (Shone et al., Reference Shone, Curriero, Lesser and Glass2006), mechanistic (Shaman et al., Reference Shaman, Stieglitz, Stark, Le Blancq and Cane2002; Schaeffer et al., Reference Schaeffer, Mondet and Touzeau2008) or mixed (Bicout & Sabatier, Reference Bicout and Sabatier2004) approach. It is already very interesting to see that the population dynamics of this kind of mosquito species can be easily reproduced from a simple model using only meteorological data (temperature and rainfall) as inputs. This approach sounds very promising because important parameters for transmission of vector-borne pathogens, such as the depletion rate α, could be assessed from a simple and widely used entomological technique, a weekly CO2 adult trapping. However, the approach developed here will need some embellishments, such as including the multi-breeding site effect to improve the a priori assessment of parameter values for prediction of Ae. caspius abundance and, therefore, vectorial capacity and associated risk maps.
Acknowledgements
We dedicate this paper to the memory of our friend and entomologist colleague Alexandre Carron who passed away at the age of 32 from a cancer disease. Many of us will miss him.
TB received a grant from the ACCIES project (Analyse du Changement Climatique et de ses Impacts sur l'Eau et la Santé) and from the Office National de la Chasse et de la Faune Sauvage (ONC 2002/07/6171). The authors thank Gérard Duvallet (UM3), Christophe Lagneau (EID Méditerranée) and Jean-Pierre Hervé (IRD) for their critical reading.



