INTRODUCTION
Terrestrial carbon cycling largely depends on the contribution of tropical forests, and quantifying this contribution has proven challenging despite over 40 years of active research (Golley & Lieth Reference GOLLEY and LIETH1972). Estimates of tropical forest carbon stocks vary widely among studies, and this variation contributes largely to the uncertainty in estimates of carbon flux. Recent estimates of carbon pools in South America range from 150 to 200 MgC ha−1 for above-ground carbon in old-growth forests, and exceed 250 PgC for total carbon (Brown & Gaston Reference BROWN and GASTON1995, Dixon et al. Reference DIXON, BROWN, HOUGHTON, SOLOMON, TREXLER and WISNIEWSKI1994, Houghton et al. Reference HOUGHTON, LAWRENCE, HACKLER and BROWN2001, Malhi et al. Reference MALHI, WOOD, BAKER, WRIGHT, PHILLIPS, COCHRANE, MEIR, CHAVE, ALMEIDA, ARROYO, HIGUCHI, KILLEEN, LAURANCE, LAURANCE, LEWIS, MONTEAGUDO, NEILL, NÚÑEZ VARGAS, PITMAN, QUESADA, SALOMÃO, SILVA, TORRES LEZAMA, TERBORGH, VÁSQUEZ MARTÍNEZ and VINCETI2006, Saatchi et al. Reference SAATCHI, HOUGHTON, DOS SANTOS ALVALÁ, SOARES and YU2007). All of these estimates made important assumptions in order to convert permanent forest tree datasets into estimates of above-ground biomass (henceforth AGB) and then carbon stocks. These include an inadequate coverage of sampling sites, poorly validated methods for extrapolating site-based studies to continental-scale estimates, and rough assumptions about the below-ground contribution to the carbon pools of tropical forests (Cairns et al. Reference CAIRNS, BROWN, HELMER and BAUMGARDNER1997, Chave et al. Reference CHAVE, CONDIT, AGUILAR, HERNANDEZ, LAO and PEREZ2004, Clark et al. Reference CLARK, BROWN, KICKLIGHTER, CHAMBERS, THOMLINSON and NI2001a, Houghton et al. Reference HOUGHTON, LAWRENCE, HACKLER and BROWN2001).
The estimation of tropical forest net primary produc-tivity (NPP) is even more difficult than estimating carbon stocks. Current estimates based on standard field protocols suggest values larger than 10 MgC ha−1 y−1 (Clark et al. Reference CLARK, BROWN, KICKLIGHTER, CHAMBERS, THOMLINSON, NI and HOLLAND2001b), and tropical forests may contribute to up to a third of the net primary productivity of terrestrial ecosystems (Field et al. Reference FIELD, BEHRENFELD, RANDERSON and FALKOWSKI1998). A large number of studies have attempted to combine field measurements, remote-sensing data and ecophysiological models to produce world maps of NPP, but these estimates remain prone to a considerable amount of uncertainty in the tropics (Field et al. Reference FIELD, BEHRENFELD, RANDERSON and FALKOWSKI1998, Schuur Reference SCHUUR2003, Turner et al. Reference TURNER, RITTS, COHEN, MAEIRSPERGER, GOWER, KIRSCHBAUM, RUNNING, ZHAO, WOFSY, DUNN, LAW, CAMPBELL, OECHEL, KWON, MEYERS, SMALL, KURC and GAMON2005).
At the ecosystem scale, NPP is balanced by carbon loss through heterotrophic respiration, Rh. If the difference between NPP and Rh, or net ecosystem exchange (NEE) is positive, then the carbon stocks of tropical forests are increasing. It has been observed in several empirical studies that tropical forests are currently acting as an atmospheric carbon sink (Lugo & Brown Reference LUGO and BROWN1992, Phillips et al. Reference PHILLIPS, MALHI, HIGUCHI, LAURANCE, NUÑEZ, VÁSQUEZ, LAURANCE, FERREIRA, STERN, BROWN and GRACE1998). Not only would this explain the atmospheric carbon sink currently unaccounted for in global carbon models (Grace Reference GRACE2004), but this would also reinforce the conservation value of tropical forests, as they contribute to buffer current C emissions due to the burning of fossil fuels (Malhi et al. Reference MALHI, ROBERTS, BETTS, KILLEEN, LI and NOBRE2008). Although a great deal of recent work has been devoted to improve the quantification of NEE in the tropics (Chave et al. Reference CHAVE, CONDIT, MULLER-LANDAU, THOMAS, ASHTON, BUNYAVEJCHEWIN, CO, DATTARAJA, DAVIES, ESUFALI, EWANGO, FEELEY, FOSTER, GUNATILLEKE, GUNATILLEKE, HALL, HART, HERNÁNDEZ, HUBBELL, ITOH, KIRATIPRAYOON, LAFRANKIE, LOO DE LAO, MAKANA, NUR SUPARDI NOOR, RAHMAN KASSIM, SAMPER, SUKUMAR, SURESH, TAN, THOMPSON, TONGCO, VALENCIA, VALLEJO, VILLA, YAMAKURA, ZIMMERMAN and LOSOS2008, Grace Reference GRACE2004, Lewis et al. Reference LEWIS, PHILLIPS, BAKER, LLOYD, MALHI, ALMEIDA, HIGUCHI, LAURANCE, NEILL, SILVA, TERBORGH, TORRES LEZAMA, VÁSQUEZ, BROWN, CHAVE, KUEBLER, NÚÑEZ and VINCETI2004, Loescher et al. Reference LOESCHER, OBERBAUER, GHOLZ and CLARK2003, Malhi et al. Reference MALHI, ROBERTS, BETTS, KILLEEN, LI and NOBRE2008, Saleska et al. Reference SALESKA, MILLER, MATROSS, GOULDEN, WOFSY, DA ROCHA, DE CAMARGO, CRILL, DAUBE, DE FREITAS, HUTYRA, KELLER, KIRCHHOFF, MENTON, MUNGER, HAMMOND PYLE, RICE and SILVA2003, Stephens et al. Reference STEPHENS, GURNEY, TANS, SWEENEY, PETERS, AOKI, MACHIDA, INOUE, VINNICHENKO, LLOYD, JORDAN, HEIMANN, SHIBISTOVA, LANGENFELDS, STEELE, FRANCEY and DENNING2007), Amazonian forests remain severely understudied (Baker et al. Reference BAKER, PHILLIPS, MALHI, ALMEIDA, ARROYO, DI FIORE, HIGUCHI, KILLEEN, LAURANCE, LAURANCE, LEWIS, LLOYD, MONTEAGUDO, NEILL, PATIÑO, PITMAN, SILVA and VÁSQUEZ MARTÍNEZ2004, Bonal et al. Reference BONAL, BOSC, GORET, BURBAN, GROSS, BONNEFOND, ELBERS, PONTON, EPRON, GUEHL and GRANIER2008). For instance, the total area covered by forest census plots is still very limited in tropical South America, with no more than 78 ha of forest where trees were measured at least twice (Baker et al. Reference BAKER, PHILLIPS, MALHI, ALMEIDA, ARROYO, DI FIORE, HIGUCHI, KILLEEN, LAURANCE, LAURANCE, LEWIS, LLOYD, MONTEAGUDO, NEILL, PATIÑO, PITMAN, SILVA and VÁSQUEZ MARTÍNEZ2004).
In a previous study, we published the first AGB estimates for the forest surrounding the Nouragues Research Station, central French Guiana, as deduced from a 22-ha network of permanent tree plots surveyed in 1992–1994 (Chave et al. Reference CHAVE, RIÉRA and DUBOIS2001). Here, we study the dynamics of this carbon pool, based on data from a second census, and improved methods. We provide the first estimate of AGB change for a period of c. 8 y, and the first estimate of above-ground net primary productivity (ANPP). Due to the design of our experimental setup at the Nouragues Research Station, the effect of the geological substrate on AGB estimates could also be appraised. Finally, we discuss our results in light of other study sites in the region.
MATERIALS AND METHODS
Study site
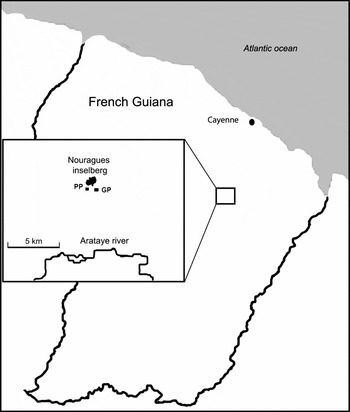
Our study was carried out at Nouragues Research Station (4°05′N, 52°40′W), located 120 km South of Cayenne, in the lowland rain forest of French Guiana (Bongers et al. Reference BONGERS, CHARLES-DOMINIQUE, FORGET and THÉRY2001, http://www.cnrs.fr/nouragues, Figure 1). This station was established in 1986, near an inselberg (granitic outcrop) that reaches 430 m asl. The landscape is a succession of small hills, between 60–120 m asl. Rainfall is 2960 mm y−1 (average 1987–2001), with a dry season that averages 73 d, from late August to early November, and a shorter dry season in March. Daily temperature ranges between 20 °C and 33 °C (annual mean 27 °C). Wind is never strong (maximum <14.2 m s−1 between 1999 and 2002, mean = 0.11 ± 0.07 m s−1). No hurricanes or cyclones reach French Guiana. Human activity is unlikely to have induced major disturbances in the recent history: the Nouragues Indians are reported to have inhabited this area during the 18th century, but departed at least 200 y ago.
Map of the study area (PP = petit plateau plot, GP = grand plateau plot). The coordinates of the inselberg top are 4°05′31″N, 52°40′43″W.

The research station is located on the west bank of a small river, called ‘crique Nouragues’, that flows on a fault separating two geomorphological entities (Grimaldi & Riéra Reference GRIMALDI, RIÉRA, Bongers, Charles-Dominique, Forget and Théry2001). The west bank has a weathered granite parent material, with sandy soils of variable depth, on which a 400 × 300-m plot called Petit Plateau (PP) has been established (van der Meer & Bongers Reference VAN DER MEER and BONGERS1996a). The east bank is on a metavolcanic rock parent material of the Paramaca formation, with clayey soils rich in ferruginous nodules, typical of the decomposition of a laterite crust. On the east bank, and c. 500 m from PP, a 1000 × 100-m plot, called Grand Plateau (GP), has been established on a uniform and gentle slope toward the creek. Permanent sampling plots are delineated by a grid of trails every 100 m on two plateaux along a compass bearing of 137° either sides of crique Nouragues.
The forest around the station harbours a diverse tree and liana flora (Poncy et al. Reference PONCY, SABATIER, PRÉVOST, HARDY, Bongers, Charles-Dominique, Forget and Théry2001, Sabatier & Prévost Reference SABATIER and PRÉVOST1990), with over 1700 angiosperm species recorded in the Reserve (http://www.nouragues.cnrs.fr/plantspecies2.html). To the south of the GP, patches of forest with an overabundance of lianas of unknown origin are encountered (Chave et al. Reference CHAVE, RIÉRA and DUBOIS2001, Schnitzer & Bongers Reference SCHNITZER and BONGERS2002, Schnitzer et al. Reference SCHNITZER, DEWALT and CHAVE2006
Plot censuses
The two plots were first established and censused between 1992 and 1994. In both the GP and the PP plots all woody stems (trees and lianas) ≥10 cm dbh (diameter at 130 cm above ground, or c. 50 cm above buttresses, if present) were inventoried. All stems were mapped, tagged, and measured with a cloth tape (Chave et al. Reference CHAVE, RIÉRA and DUBOIS2001, Olivier unpub. data, van der Meer & Bongers Reference VAN DER MEER and BONGERS1996a, Reference VAN DER MEER and BONGERSb). The first census took place between March 1992 and November 1994 in the GP plot, and in July–August 1992 in the PP plot.
Between August 2000 and October 2002, we recen-sused a total of 12 630 trees and lianas with dbh ≥10 cm in the 22 ha of the GP and PP plots. Plots were subdivided into 10 × 100-m lines using 100-m strings tagged every 10 m. For dead trees, the type of mortality was noted (fallen trees, standing dead, snapped trees). We also documented missing stems. Stem circumference was measured to the nearest mm rounding down. We then converted this value into diameter assuming a circular stem. In some cases, mostly for big trees with buttresses or with irregular boles, diameter was not directly measured, but estimated using a relascope technique (DeWalt & Chave Reference DEWALT and CHAVE2004). Specifically, we took a digital photograph of the stem and of a ruler positioned at a specified height, and estimated the diameter at that height using image-processing software such as Photoshop (Adobe, San Jose, USA). The accuracy of this method for trunk diameter estimation was found to be of 5% (DeWalt & Chave Reference DEWALT and CHAVE2004). Data were digitized and checked carefully on a computer while in the field, and obvious errors, such as anomalous dbh changes or missing stems, were rechecked the following day.
During the second census, we paid special attention to irregular-shaped stems for which an accurate measure-ment was difficult. We carefully estimated the stem basal area at breast height, assuming that the stem cross section has the shape of a polygon. Then, we converted basal area into a theoretical dbh value, as if the trunk were cylindrical in shape. The stem diameter of the palm species Astrocaryum sciophilum (Miq.) Pulle could not be measured with great precision because of the presence of leaf scars on the trunk (Charles-Dominique et al. Reference CHARLES-DOMINIQUE, CHAVE, DUBOIS, RIÉRA and VEZZOLI2003). For multi-stemmed trees or forked stems, we counted genets as one individual, and calculated the total cross-sectional area of the ramets. The dbh was estimated rather than directly measured for 7.7% of the stems. For the first census, we could not correct possible errors of measurement on these stems, and if the measurements appeared to be in error, we corrected it using the procedure explained below.
We discovered that the dbh of many of the large trees (typically, trees ≥70 cm) had been overestimated in the first census. Since our second census was more accurate, we used a trimming method to correct for this bias (Baker et al. Reference BAKER, PHILLIPS, MALHI, ALMEIDA, ARROYO, DI FIORE, HIGUCHI, KILLEEN, LAURANCE, LAURANCE, LEWIS, LLOYD, MONTEAGUDO, NEILL, PATIÑO, PITMAN, SILVA and VÁSQUEZ MARTÍNEZ2004, Chave et al. Reference CHAVE, CONDIT, LAO, CASPERSEN, FOSTER and HUBBELL2003, Reference CHAVE, CONDIT, AGUILAR, HERNANDEZ, LAO and PEREZ2008; Sheil Reference SHEIL1995). Any dbh decreases of 5 mm y−1 or more, or increases of 35 mm y−1 or more were assumed to be anomalous, if the trees did not belong to one of the families with fast-growing species (Cecropiaceae, Vochysiaceae), and the first measurement was declared to be incorrect. We then corrected the value by assuming that the dbh growth was equal to the average dbh growth of trees in the same dbh class (Chave et al. Reference CHAVE, CONDIT, LAO, CASPERSEN, FOSTER and HUBBELL2003).
Wood density measurement
Wood specific gravity is an important variable in the estimation of tree above-ground biomass (Baker et al. Reference BAKER, PHILLIPS, MALHI, ALMEIDA, ARROYO, DI FIORE, HIGUCHI, KILLEEN, LAURANCE, LAURANCE, LEWIS, LLOYD, MONTEAGUDO, NEILL, PATIÑO, PITMAN, SILVA and VÁSQUEZ MARTÍNEZ2004). In most previous studies, wood density was estimated for each stem from the information of the species by assuming a species mean wood density. In many cases, however, the lack of reliable taxonomic identification for the censused trees makes this procedure difficult. In our plots, for instance, only 50% of the stems were identified to the species. Moreover, the procedure assumes that there is no intraspecific variability in wood density, and that wood density values from the literature are accurate. We therefore assessed its validity.
We obtained a plot-averaged wood specific gravity from available species abundances in two 1-ha subplots where all the stems had been identified to species (Poncy et al. Reference PONCY, SABATIER, PRÉVOST, HARDY, Bongers, Charles-Dominique, Forget and Théry2001, Sabatier & Prévost Reference SABATIER and PRÉVOST1990), combined with a large database of mean specific gravity for neotropical tree species (Chave et al. Reference CHAVE, MULLER-LANDAU, BAKER, EASDALE, TER STEEGE and WEBB2006). We also tested for a potential bias related to this assumption, namely, that large trees do not have a lower wood specific gravity than small ones, as it is the case in the BCI forest (Chave et al. Reference CHAVE, CONDIT, AGUILAR, HERNANDEZ, LAO and PEREZ2004). We found no difference in mean wood density between small and large trees in the forest around the Nouragues Field Station.
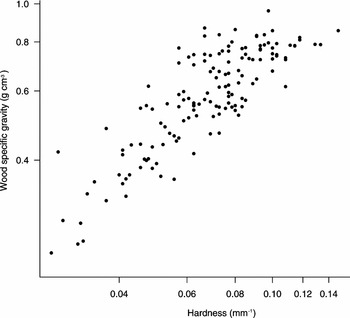
We also developed a different strategy to estimate the wood specific gravity of the trees in our plots. We used a wood tester, the Pilodyn 6J (Proceq USA, Aliquippa PA, USA), a tool commonly used to measure wood hardness in plantation trees and construction wood. This device is pressed firmly onto the stem surface. The impact pin is shot into the wood by pressing a trigger, and the depth of penetration can be read immediately on a scale mounted on the tester. We calibrated the instrument on 144 trees (dbh range: 9–130 cm), that were also cored using a forestry wood increment borer (Suunto, Vantaa, Finland). For these trees, wood specific gravity measured from cored wood samples varied between 0.21 and 0.96 g cm−3 (Figure 2). We found that wood density correlated strongly with the wood hardness as measured by the Pilodyn (Figure 2). Running a stepwise selection linear model on our dataset, we found that the best model predicting wood density ρ used both the Pilodyn hardness h and the stem dbh, as follows:

Here, h is defined as one over the penetration depth of the pin into the wood (measured in mm). The coefficient of correlation is of this regression was r2 = 0.79. We applied this model on all censused trees in two 1-ha subplots (n = 1044 trees), one in the GP plot, the other in the PP plot, for which we measured the Pilodyn-hardness. Finally, we compared our new estimate of plot-mean wood density with the one obtained through literature values.
Calibration of the wood specific gravity estimation based on the Pilodyn. Wood specific gravity (g cm−3), and Pilodyn hardness (defined as the inverse of the Pilodyn 6J reading, expressed in mm) were estimated for 144 trees, belonging to 98 different tree species. Sampled trees were 9–130 cm in dbh, and wood specific gravity ranged from 0.21 g cm−3 to 0.96 g cm−3.

In most studies on the carbon sequestration of tropical rain forests, it has been assumed that above-ground biomass in live trees contains 50% carbon (Clark et al. Reference CLARK, BROWN, KICKLIGHTER, CHAMBERS, THOMLINSON and NI2001a). Although the wood carbon fraction may exhibit some variation as faster-growing trees may have fewer of the more reduced and stable carbon compounds than do slower-growing ones (Elias & Potvin Reference ELIAS and POTVIN2003, Malhi et al. Reference MALHI, BAKER, PHILLIPS, ALMEIDA, ALVAREZ, ARROYO, CHAVE, CZIMCZIK, DI FIORE, HIGUCHI, KILLEEN, LAURANCE, LAURANCE, LEWIS, MONTOYA, MONTEAGUDO, NEILL, NUNEZ, PATIÑO, PITMAN, QUESADA, SILVA, LEZAMA, VASQUEZ MARTINEZ, TERBORGH, VINCETI and LLOYD2004), we also used the convention of 50% carbon in dry biomass here.
Litterfall monitoring
We measured litterfall separately for leaves, twigs (typically <1 cm in diameter), and reproductive organs (flowers and fruits), using a network of litterfall traps, each 0.5 m2 in size. We initially installed 100 traps on the GP plot, and 60 traps on the PP plots, following a randomized location procedure. Traps were made of square pieces of large-mesh polyethylene fabric tied by ropes to four neighbouring live trees, at about 1.5 m above ground to avoid disturbances by large mammals. When a trap was damaged by the fall of woody debris, the corresponding data were discarded (0.7% of the measurements). The content of the 160 traps was collected twice a month from February 2001 to July 2003. At this time, we analysed the data and selected 15 representative traps in the PP plot, and 25 traps in the GP plot. Starting in January 2004, we continued the same protocol with this reduced sampling scheme. The content of the traps was separated into leaves, branches, fruits and flowers when wet, then oven-dried at 70 °C for up to 48 h, and weighed with an electronic balance (precision 0.1 g). Averages were based on the data available from February 2001 to July 2007 (77 mo).
Statistical analyses
Mortality and recruitment were computed using an exponential model. For a cohort with N 1 individuals during the first census, with N S survivors at the second census, the formula is N S = N 1 exp(-m T), where m is the mortality rate and T the census interval. Recruitment rate r was estimated from the number N 2 of individuals present at census 2 and N S, assuming that N 2 = N S exp(r T). In the following, these quantities are reported on an annual basis. Turnover is defined as the mean between recruitment and mortality (Phillips & Gentry Reference PHILLIPS and GENTRY1994). Because the census intervals had a similar span, we did not account for the fact that m should decrease as T increases (Sheil & May Reference SHEIL and MAY1996).
To estimate the stand-level AGB in trees, we used a regression equation based on a large sample size of directly harvested trees. This equation relates the dbh D of a stem in cm and its oven-dry specific gravity ρ in g cm−3, to its AGB in kg (n = 1804 trees, see Chave et al. Reference CHAVE, ANDALO, BROWN, CAIRNS, CHAMBERS, EAMUS, FÖLSTER, FROMARD, HIGUCHI, KIRA, LESCURE, PUIG, RIÉRA and YAMAKURA2005):

Lianas were also taken into account in the total AGB estimation, using a formula based on 424 harvested lianas (see Schnitzer et al. Reference SCHNITZER, DEWALT and CHAVE2006).

To estimate the leaf biomass in our plots, we also used empirical regression methods. We used the dataset of directly harvested trees assembled by Chave et al. (Reference CHAVE, ANDALO, BROWN, CAIRNS, CHAMBERS, EAMUS, FÖLSTER, FROMARD, HIGUCHI, KIRA, LESCURE, PUIG, RIÉRA and YAMAKURA2005), limited to sites in old-growth moist tropical rain forests. A total of 662 trees ranging between 5 cm and 156 cm in dbh were used in this analysis, and the best regression model relating leaf biomass to dbh was found to be:

where LAGB is the leaf biomass measured in kg. Because leaves represent a rapid turnover carbon pool, this equation is only suitable to estimate pools and does not reflect accurately fluxes in and out of this pool.
In the rest of this text we use the following definitions. AGB growth is the biomass increment in the trees ≥10 cm dbh present during the two censuses. AGB recruitment is the gain due to trees into the ≥10 cm dbh size class, that is, trees present in the second census but not in the first one. AGB mortality corresponds to the AGB of the trees that died between the first and the second census. We did not assess the changes due to trees <10 cm dbh. We assessed the magnitude of error in net AGB change due to spatial sampling by a bootstrapping procedure. We evaluated the values of net AGB change in contiguous subplots of size 20 × 20 m, and used these subsamples to estimate the standard error, a procedure described in Chave et al. (Reference CHAVE, CONDIT, LAO, CASPERSEN, FOSTER and HUBBELL2003). We checked that this estimate was not biased by spatial autocorrelation among subplots or by our choice of subplot size.
Most of the forest ANPP is due to the contribution of trunks and large branches (coarse wood productivity; Malhi et al. Reference MALHI, BAKER, PHILLIPS, ALMEIDA, ALVAREZ, ARROYO, CHAVE, CZIMCZIK, DI FIORE, HIGUCHI, KILLEEN, LAURANCE, LAURANCE, LEWIS, MONTOYA, MONTEAGUDO, NEILL, NUNEZ, PATIÑO, PITMAN, QUESADA, SILVA, LEZAMA, VASQUEZ MARTINEZ, TERBORGH, VINCETI and LLOYD2004), and to leaves, twigs and reproductive organs measured by the quantity of litter falling into traps, plus a number of terms we could not measure directly in the field. We do not directly include the productivity of small trees, losses to herbivory, branchfalls and biogenic volatile organic compounds.
RESULTS
Forest structure and demographic patterns
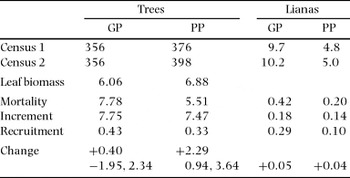
Mean stem density decreased from the first to the second census from 524 trees ha−1 to 501 trees ha−1 (Table 1). The PP plot was less dynamic than the GP plot: in the GP plot, recruitment rate was 1.34% y−1, and mortality rate 2.06% y−1. In the PP plot, recruitment rate was 1.11% y−1, and mortality rate 1.51% y−1. This was in part due to lianas, that represented 21 ind. ha−1 in the GP plot, versus 10 ind. ha−1 in the PP plot only. Lianas were more than twice as dynamic as trees (Table 1). However, restricting the analysis to trees, the GP plot remained more dynamic than the PP plot. Basal area was consistently close to 30 m2 ha−1, and lianas contributed little to the total. The GP plot held slightly less basal area (28.2 m2 ha−1) than the PP plot (31 m2 ha−1).
Stem density in the two census plots (PP = petit plateau plot, GP = grand plateau plot). Mortality rate (m) and recruitment rate (r) are also reported (% y−1). Mean census interval is 7.52 y in the GP plot (10 ha) and 9.60 y in the PP plot (12 ha).

Plot-averaged wood specific gravity
Using species abundances, and species-level wood specific gravity data, we found a mean wood density of ρ = 0.72 g cm−3 across the trees in the two subplots. The alternative method based on a correlation between wood hardness measured by the Pilodyn, and wood density however yielded a different prediction. With this second method, we found that the averaged wood specific gravity was equal to 0.65 g cm−3 in the PP subplot, and to 0.60 g cm−3 in the GP subplot, with an average of 0.63 g cm−3 for both plots combined. Large trees did not have a less dense wood than small trees. We therefore assumed a mean wood specific gravity equal to 0.63 g cm−3 for all the trees in the plots.
Above-ground biomass stock and change
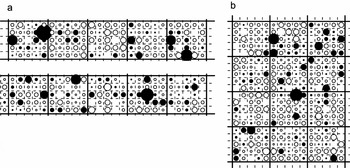
The initial stock of AGB in woody plants, including both trees and lianas, was 365 Mg ha−1 in the GP plot, and 380 Mg ha−1 in the PP plot (Table 2). Stems made by far the largest contribution to AGB, and leaf biomass (measured only in the second census) was 6.47 Mg ha−1, and it represented about 1.7% of tree AGB. Tree AGB increased in both plots between the two censuses. In the GP plot, the increase was small and non-significant (+0.41 Mg ha−1 y−1, 95% confidence limits: −1.95 to 2.34). In the PP plot, the increase was significant (+2.30 Mg ha−1 y−1, 95 CI: 0.94 to 3.64). The spatial pattern of carbon accumulation and loss was uneven across both the PP and the GP plots (Figure 3): a few subplots declined dramatically in AGB, while most plots increased in AGB.
Above-ground biomass (AGB, Mg ha−1 dry mass) for trees and lianas in GP and PP plots during the two censuses (PP = petit plateau plot, GP = grand plateau plot). Estimated leaf biomass for the second census (Mg ha−1 dry mass) is also reported. AGB mortality, increment, and ingrowth, as well as changes in AGB are measured in dry-mass Mg ha−1 y−1. For changes in AGB, 95% confidence intervals are reported.

AGB changes in the plots across 20 × 20-m subplots. Grand plateau plot (a) and petit plateau plot (b). White circles represent an increase of AGB in the corresponding subplot, while black circles represent a decrease. The size of the circles is proportional to the net change in above-ground biomass.

Net primary productivity
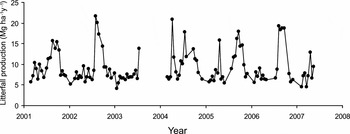
Fine-litter production was variable over the course of the study (Figure 4). While it always exceeded 5 Mg ha−1 y−1, it peaked to values exceeding 15 Mg ha−1 y−1 at the beginning of the dry season, in June–July. No trend was observed for the inter-annual pattern of fine-litter production.
Temporal change in fine litterfall at the Nouragues Station, 2001–2007 (Mg ha−1 y−1, dry mass). The figure corresponds the total fine litterfall (twigs, leaves, fruits and flowers) fallen in 40 seed traps, 0.5 m2 each (15 seed traps in the petit plateau plot, 25 in the grand plateau plot), and measured from 26 February 2001 to 27 July 2007 (n = 119). The interruption of the sequence in the second half of 2004 was caused by a problem in the field.

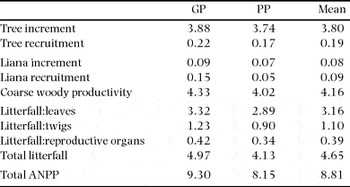
Our estimate of ANPP based on coarse woody pro-ductivity plus litterfall production was 8.81 MgC ha−1 y−1 (Table 3). Coarse-wood productivity contributed less than half of this figure (4.16 MgC ha−1, or 47% of the total). The other half was due to fine litterfall (4.65 MgC ha−1, or 53% of the total): leaves (36%), then twigs (13%), and reproductive organs (flowers and fruits, 4%). ANPP was significantly larger in the GP plot (9.30 MgC ha−1 y−1) than in the PP plot (8.15 MgC ha−1 y−1).
Net primary productivity (MgC ha−1 y−1) in the Nouragues forest (PP = petit plateau plot, GP = grand plateau plot). Coarse woody productivity is the sum of the carbon fixed by trees and by lianas.

DISCUSSION
Revisiting above-ground biomass estimation procedures in tropical forests
Over the past decade, global change research has triggered a renewed interest for census-based biomass estimation procedures (Brown Reference BROWN1997). The debate on the optimal methods to estimate forest biomass has revolved over the accuracy of trunk diameter measurements (Clark Reference CLARK2002), the type of allometric equation used (Brown Reference BROWN1997, Chave et al. Reference CHAVE, ANDALO, BROWN, CAIRNS, CHAMBERS, EAMUS, FÖLSTER, FROMARD, HIGUCHI, KIRA, LESCURE, PUIG, RIÉRA and YAMAKURA2005), the spatial coverage of forest census data (Baker et al. Reference BAKER, PHILLIPS, MALHI, ALMEIDA, ARROYO, DI FIORE, HIGUCHI, KILLEEN, LAURANCE, LAURANCE, LEWIS, LLOYD, MONTEAGUDO, NEILL, PATIÑO, PITMAN, SILVA and VÁSQUEZ MARTÍNEZ2004). Different types of errors, due to measurement, model uncertainty and sampling add up. However, the dominant source of error in scaling up biomass stocks and changes is that selected forest plots may not represent the true regional-scale variability (Chave et al. Reference CHAVE, CONDIT, AGUILAR, HERNANDEZ, LAO and PEREZ2004).
Our data-trimming procedure, corrections for large tree diameters, and a new regression model for estimating AGB based on several recent studies all have contributed to improve our AGB estimation procedure (Chave et al. Reference CHAVE, CONDIT, AGUILAR, HERNANDEZ, LAO and PEREZ2004, Reference CHAVE, ANDALO, BROWN, CAIRNS, CHAMBERS, EAMUS, FÖLSTER, FROMARD, HIGUCHI, KIRA, LESCURE, PUIG, RIÉRA and YAMAKURA2005; Clark et al. Reference CLARK, BROWN, KICKLIGHTER, CHAMBERS, THOMLINSON and NI2001a, Reference CLARK, BROWN, KICKLIGHTER, CHAMBERS, THOMLINSON, NI and HOLLANDb; Phillips et al. Reference PHILLIPS, MALHI, VINCETI, BAKER, LEWIS, HIGUCHI, LAURANCE, NUNEZ, VASQUEZ, LAURANCE, FERREIRA, STERN, BROWN and GRACE2002). These improvements resulted in quite different results from those published in Chave et al. (Reference CHAVE, RIÉRA and DUBOIS2001). The dbh of large trees had been overestimated in the first census, resulting in a potential overestimation of the AGB estimate. However the biomass estimation method used in Chave et al. (Reference CHAVE, RIÉRA and DUBOIS2001) assumed a much smaller contribution of large trees to the overall AGB estimate than the one we used here.
Wood density is used when inventories of bole volume are converted to biomass, and this may entail errors in biomass estimation protocols (Muller-Landau Reference MULLER-LANDAU2004, Nogueira et al. Reference NOGUEIRA, FEARNSIDE and NELSON2005, Wiemann & Williamson Reference WIEMANN and WILLIAMSON2002). We first assumed that the mean plot wood density could be estimated by averaging of all individuals, assuming that their wood density is equal to their species mean, obtained from literature values. This yielded an estimate of 0.72 g cm−3. We then used a direct estimation of the wood density of trees based on the measurement of the hardness using a Pilodyn, and showed that the inferred mean plot wood density was 0.63 g cm−3. This result points to an inconsistency between the two methods. We favoured the latter method because wood density is estimated for the trees in the census. In contrast the first method assumes that wood density is constant within a species, an assumption that is known to be false (Wiemann & Williamson Reference WIEMANN and WILLIAMSON2002).
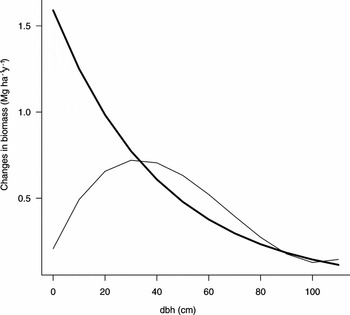
Our study, like most others studies of tropical forest AGB changes based on tree diameter census data, was restricted to trees greater than 10 cm in dbh. We assumed that recruiting trees had a dbh of 0 in the previous census, and that they recruited to 10 cm a few years later. Clark et al. (Reference CLARK, BROWN, KICKLIGHTER, CHAMBERS, THOMLINSON and NI2001a) criticized this assumption because trees recruiting to 10 cm were already present in the plot in the previous census, but their dbh was just below 10 cm. Clark et al. (Reference CLARK, BROWN, KICKLIGHTER, CHAMBERS, THOMLINSON and NI2001a) then advised the following strategy: ‘[for the calculation of ANPP], increments are summed for all trees surviving the interval. This total is then adjusted for ingrowth; the increment of each new tree is calculated as the difference between its estimated biomass at the end of the interval and the biomass of a tree of the minimum measured diameter. The summed increments of the ingrowth are then added to the stand increment.’ We recently reassessed this claim using 12 large plots (16–52 ha) where all trees ≥1 cm dbh had been measured at least twice (Chave et al. Reference CHAVE, CONDIT, MULLER-LANDAU, THOMAS, ASHTON, BUNYAVEJCHEWIN, CO, DATTARAJA, DAVIES, ESUFALI, EWANGO, FEELEY, FOSTER, GUNATILLEKE, GUNATILLEKE, HALL, HART, HERNÁNDEZ, HUBBELL, ITOH, KIRATIPRAYOON, LAFRANKIE, LOO DE LAO, MAKANA, NUR SUPARDI NOOR, RAHMAN KASSIM, SAMPER, SUKUMAR, SURESH, TAN, THOMPSON, TONGCO, VALENCIA, VALLEJO, VILLA, YAMAKURA, ZIMMERMAN and LOSOS2008). ANPP was computed directly by including samplings in the 1–10 cm dbh range, and also ignoring these saplings. In contrast to the claim of Clark et al. (Reference CLARK, BROWN, KICKLIGHTER, CHAMBERS, THOMLINSON and NI2001a), we found that it is more accurate to ignore the recruits than to assume a dbh of 10 cm in the previous census. This counter-intuitive result may be interpreted as follows. The saplings in the 1–10-cm dbh range are not in carbon balance over a short time period: they fix more carbon through photosynthesis than they lose through mortality, as illustrated in Figure 5. Ignoring these saplings leads to an important underestimation of the ANPP, a fact that was overlooked by Clark et al. (Reference CLARK, BROWN, KICKLIGHTER, CHAMBERS, THOMLINSON and NI2001a). The overestimation of ANPP due to assuming a very rapid growth of recruits from 0 to 10 cm dbh between two censuses exactly balances this underestimation in ANPP (Chave et al. Reference CHAVE, CONDIT, MULLER-LANDAU, THOMAS, ASHTON, BUNYAVEJCHEWIN, CO, DATTARAJA, DAVIES, ESUFALI, EWANGO, FEELEY, FOSTER, GUNATILLEKE, GUNATILLEKE, HALL, HART, HERNÁNDEZ, HUBBELL, ITOH, KIRATIPRAYOON, LAFRANKIE, LOO DE LAO, MAKANA, NUR SUPARDI NOOR, RAHMAN KASSIM, SAMPER, SUKUMAR, SURESH, TAN, THOMPSON, TONGCO, VALENCIA, VALLEJO, VILLA, YAMAKURA, ZIMMERMAN and LOSOS2008).
Contribution of dbh classes to AGB growth and to loss of AGB through mortality in a model tropical forest. Total AGB growth due to biomass fixation in the stems is equal to the integral of the thick solid line, while total AGB loss is equal to the integral of the fine solid line. The 1–10-cm dbh class contributes more to AGB growth than to AGB loss, while the 35–80-cm dbh class contributes more to AGB loss than to AGB growth. This figure was obtained by smoothing the data of the Barro Colorado Island 50-ha plot in Panama (Chave et al. Reference CHAVE, CONDIT, LAO, CASPERSEN, FOSTER and HUBBELL2003, Figure 2).

Our estimate of ANPP was 8.81 MgC ha−1 y−1, based on coarse woody productivity and fine litterfall only. As in most literature contributions, we ignored a number of additional terms contributing to ANPP. These include unmonitored biomass losses due to herbivory or tissue decay, branchfalls, and biogenic volatile organic compounds (VOC) lost into the atmosphere. Based on literature values and estimation, we previously reported an overall contribution of 0.4 Mg ha−1 y−1 (dry mass units) lost through herbivory, and an additional 0.25 Mg ha−1 y−1 lost through branchfalls (Chave et al. Reference CHAVE, CONDIT, LAO, CASPERSEN, FOSTER and HUBBELL2003). The contribution of VOC could be as large as 0.3 Mg ha−1 y−1 for lowland tropical forests (Günther et al. Reference GÜNTHER, HEWITT, ERICKSON, FALL, GERON, GRAEDEL, HARLEY, KLINGER, LERDAU, MCKAY, PIERCE, SCHOLES, STEINBRECHER, TALLAMRAJU, TAYLOR and ZIMMERMAN1995). Hence, a more accurate estimate of ANPP may be closer to 8.7 MgC ha−1 y−1 than to 7.75 MgC ha−1 y−1. In the future, it will be important to refine these estimates and their regional variability based on field studies.
Regional perspective
The community-level dynamics of tropical forests has seldom been studied in the Guiana Shield (but see van der Meer & Bongers Reference VAN DER MEER and BONGERS1996a, Reference VAN DER MEER and BONGERSb). We here provide results for two plots differing in floristic composition and parent substrate, and show that the abundance of trees ≥10 cm has declined over the past 15 y, that total AGB has increased, and that liana AGB and abundance has also increased. We expected a clear difference in the structure and biomass between the plots (Laurance et al. Reference LAURANCE, FEARNSIDE, LAURANCE, DELAMONICA, LOVEJOY, RANKIN-DE MERONA, CHAMBERS and GASCON1999), and we did find it: there was a significant difference in stem abundance, turnover, AGB, and AGB changes. The PP plot tends to have trees with deeper root systems due to the nature of the granitic substrate, and this may in part explain the greater stability of this plot. However, part of these differences can also be explained by a larger abundance of lianas in the GP plot, which may have suppressed the growth of trees (Campbell & Newbery Reference CAMPBELL and NEWBERY1993, Schnitzer et al. Reference SCHNITZER, KUZEE and BONGERS2005). The high density of lianas in the GP plot may have been caused by past disturbances, rather than by differences in abiotic conditions.
Is the forest around the Nouragues Research Station representative of the Guianan forests? Remote sensing studies of French Guiana are insufficient to date to answer this (Eva et al. Reference EVA, DE MIRANDA, DI BELLA, GOND, JONES, ACHARD and BELWARD2002, V. Gond, unpubl. data). The only comparable study published to date is that of Favrichon et al. (Reference FAVRICHON, DAMIO, DOUMBIA, DUPUY, HIGUCHI, KOKASI KADIR, MAÎTRE, NGUYEN THE, PETRUCCI and SIST1997), who reported results from the Paracou field station, located in the coastal zone of French Guiana. In three undisturbed plots of 6.25 ha each, the average stem density was 626 stems ha−1, much larger than at Nouragues, and a comparable basal area. A dbh size structure with more small trees suggests a smaller AGB at Paracou than at Nouragues. Favrichon et al. (Reference FAVRICHON, DAMIO, DOUMBIA, DUPUY, HIGUCHI, KOKASI KADIR, MAÎTRE, NGUYEN THE, PETRUCCI and SIST1997) also reported that mortality exceeds recruitment (6.2 vs. 4.8 stems ha−1 y−1) over the 10-y period 1984–1994. Although tree turnover at Nouragues was 40% larger than at Paracou, a similar dynamic of decline in stem density was observed in the two forests. Further cross-plot comparisons are needed in the Guianas.
What is the productivity of Eastern Amazon rain forests?
Malhi et al. (Reference MALHI, BAKER, PHILLIPS, ALMEIDA, ALVAREZ, ARROYO, CHAVE, CZIMCZIK, DI FIORE, HIGUCHI, KILLEEN, LAURANCE, LAURANCE, LEWIS, MONTOYA, MONTEAGUDO, NEILL, NUNEZ, PATIÑO, PITMAN, QUESADA, SILVA, LEZAMA, VASQUEZ MARTINEZ, TERBORGH, VINCETI and LLOYD2004) reassessed the status of our knowledge on wood productivity in neotropical forests, as estimated from permanent census plots. They report data from 104 plots 0.25 to 50 ha in size representing a total area of 208 ha, including the present study site. The four largest plots are the 50-ha plot of Barro Colorado Island (Chave et al. Reference CHAVE, CONDIT, LAO, CASPERSEN, FOSTER and HUBBELL2003), the 18.75-ha Paracou plots (Favrichon et al. Reference FAVRICHON, DAMIO, DOUMBIA, DUPUY, HIGUCHI, KOKASI KADIR, MAÎTRE, NGUYEN THE, PETRUCCI and SIST1997), and our PP and GP plots (22 ha in total, this study). Hence, the sampling effort corresponding to the present study represents a significant fraction of our knowledge on the dynamics of lowland neotropical forests. In the study of Malhi et al. (Reference MALHI, BAKER, PHILLIPS, ALMEIDA, ALVAREZ, ARROYO, CHAVE, CZIMCZIK, DI FIORE, HIGUCHI, KILLEEN, LAURANCE, LAURANCE, LEWIS, MONTOYA, MONTEAGUDO, NEILL, NUNEZ, PATIÑO, PITMAN, QUESADA, SILVA, LEZAMA, VASQUEZ MARTINEZ, TERBORGH, VINCETI and LLOYD2004), 11 plots are located in the Eastern Amazon, including, besides Paracou and Nouragues, four plots in Guyanan Venezuela (El Dorado plots, Phillips et al. Reference PHILLIPS, MALHI, HIGUCHI, LAURANCE, NUÑEZ, VÁSQUEZ, LAURANCE, FERREIRA, STERN, BROWN and GRACE1998), two in Suriname (Celos plots, de Graaf et al. Reference DE GRAAF, POELS and VAN ROMPAEY1999), and two in Brazil (Caixuana plots, Baker et al. Reference BAKER, PHILLIPS, MALHI, ALMEIDA, ARROYO, DI FIORE, HIGUCHI, KILLEEN, LAURANCE, LAURANCE, LEWIS, LLOYD, MONTEAGUDO, NEILL, PATIÑO, PITMAN, SILVA and VÁSQUEZ MARTÍNEZ2004). They reported that coarse wood productivity varied little across these plots, between 2.12 and 3.46 MgC ha−1 y−1. At Nouragues, we found a much higher value at 4.16 MgC ha−1 y−1, larger than the figure reported by Malhi et al. (Reference MALHI, BAKER, PHILLIPS, ALMEIDA, ALVAREZ, ARROYO, CHAVE, CZIMCZIK, DI FIORE, HIGUCHI, KILLEEN, LAURANCE, LAURANCE, LEWIS, MONTOYA, MONTEAGUDO, NEILL, NUNEZ, PATIÑO, PITMAN, QUESADA, SILVA, LEZAMA, VASQUEZ MARTINEZ, TERBORGH, VINCETI and LLOYD2004) for the same plots but using a different method. This value is also larger than their average coarse wood productivity for the lowland Neotropics. Our estimate of 4.65 MgC ha−1 y−1 for litterfall productivity was also in the high end of the figures reported by Clark et al. (Reference CLARK, BROWN, KICKLIGHTER, CHAMBERS, THOMLINSON, NI and HOLLAND2001b) for neotropical forests.
Are Amazonian forest plots increasing in biomass?
Baker et al. (Reference BAKER, PHILLIPS, MALHI, ALMEIDA, ARROYO, DI FIORE, HIGUCHI, KILLEEN, LAURANCE, LAURANCE, LEWIS, LLOYD, MONTEAGUDO, NEILL, PATIÑO, PITMAN, SILVA and VÁSQUEZ MARTÍNEZ2004) reassessed current evidence for the continental-scale increase of biomass in the Neotropics, based on the same dataset as Malhi et al. (Reference MALHI, BAKER, PHILLIPS, ALMEIDA, ALVAREZ, ARROYO, CHAVE, CZIMCZIK, DI FIORE, HIGUCHI, KILLEEN, LAURANCE, LAURANCE, LEWIS, MONTOYA, MONTEAGUDO, NEILL, NUNEZ, PATIÑO, PITMAN, QUESADA, SILVA, LEZAMA, VASQUEZ MARTINEZ, TERBORGH, VINCETI and LLOYD2004). They conclude that tropical forest plots have increased in AGB (trees ≥10 cm) by a magnitude of 0.61 ± 0.22 MgC ha−1 y−1 over the previous decades. We found a value of +0.20 and +1.14 MgC ha−1 y−1 for the GP and PP plots, respectively, consistent with the value reported by Baker et al. (Reference BAKER, PHILLIPS, MALHI, ALMEIDA, ARROYO, DI FIORE, HIGUCHI, KILLEEN, LAURANCE, LAURANCE, LEWIS, LLOYD, MONTEAGUDO, NEILL, PATIÑO, PITMAN, SILVA and VÁSQUEZ MARTÍNEZ2004). We were able to assess the spatial uncertainty on these estimates, and found that only the AGB increase in the PP plot was significant, not that in the GP plot. However, we conclude that our results at Nouragues confirm the hypothesis of an increase in AGB in tropical rain forests (Baker et al. Reference BAKER, PHILLIPS, MALHI, ALMEIDA, ARROYO, DI FIORE, HIGUCHI, KILLEEN, LAURANCE, LAURANCE, LEWIS, LLOYD, MONTEAGUDO, NEILL, PATIÑO, PITMAN, SILVA and VÁSQUEZ MARTÍNEZ2004, Chave et al. Reference CHAVE, CONDIT, MULLER-LANDAU, THOMAS, ASHTON, BUNYAVEJCHEWIN, CO, DATTARAJA, DAVIES, ESUFALI, EWANGO, FEELEY, FOSTER, GUNATILLEKE, GUNATILLEKE, HALL, HART, HERNÁNDEZ, HUBBELL, ITOH, KIRATIPRAYOON, LAFRANKIE, LOO DE LAO, MAKANA, NUR SUPARDI NOOR, RAHMAN KASSIM, SAMPER, SUKUMAR, SURESH, TAN, THOMPSON, TONGCO, VALENCIA, VALLEJO, VILLA, YAMAKURA, ZIMMERMAN and LOSOS2008, Phillips et al. Reference PHILLIPS, MALHI, HIGUCHI, LAURANCE, NUÑEZ, VÁSQUEZ, LAURANCE, FERREIRA, STERN, BROWN and GRACE1998). The causes of this increase are not known, and we have no way to test whether it may be triggered to an increase in primary productivity (Lewis et al. Reference LEWIS, PHILLIPS, BAKER, LLOYD, MALHI, ALMEIDA, HIGUCHI, LAURANCE, NEILL, SILVA, TERBORGH, TORRES LEZAMA, VÁSQUEZ, BROWN, CHAVE, KUEBLER, NÚÑEZ and VINCETI2004). It is possible that an increase in biomass may be due to natural disturbances. Such an historical interpretation can be ruled out only by the comparison with other permanent sampling plots in nearby forests, with detailed palaeoecological studies at the site (Charles-Dominique et al. Reference CHARLES-DOMINIQUE, BLANC, LARPIN, LEDRU, RIÉRA, SARTHOU, SERVANT and TARDY1998), or through the development of a larger sampling strategy. The Nouragues Research Station is an ideal place to conduct such a study, and we hope to readdress this issue in the future.
ACKNOWLEDGEMENTS
We are deeply indebted to D. Bétian, and W. Bétian who undertook most of the labour of the first census. We also thank M. Alexandre, C. Couralet, S. DeWalt, W. Fischer, P. Gaucher, I. Hardy, D. Navarrete, G. Péroz, P. Pétronelli, O. Poncy, M.-F. Prévost, H. Puig, D. Sabatier, S. Schnitzer, C. Thébaud and C. Webb. The manuscript benefited from valuable comments by Stephanie Bohlmann and one anonymous reviewer. It was partly funded by the Ecofit programme, then by the Amazonie programme (Centre National de la Recherche Scientifique).