Fiscal conflict is a hallmark of twenty-first century American politics. While the populist movement against spending that developed in the wake of the Great Recession and inauguration of Barack Obama has become a symbol of contemporary fiscal conservatism, public concern about government spending extends well beyond the Tea Party. Asked by Gallup in 2019 how much they “personally worry” about federal spending and the deficit, 50% of respondents said a “great deal” and 30% said a “fair amount.”Footnote 1 Many people favor spending cuts to address these worries. In every Cooperative Congressional Election Study (CCES) since 2008, large supermajorities have said that cutting spending is the most appropriate way for Congress to balance the budget.Footnote 2 And in 2016, 65% of respondents in the General Social Survey (GSS) supported cuts in government spending even when the question did not mention debt or the deficit.
This may seem like a clear signal—many Americans are anxious about government spending and want their representatives in Congress to reduce it. But what exactly do they mean by this? Conceptually, government spending is abstract; and empirically, it encompasses many things. When people think about government, and especially when they think about its scope—as questions about government spending ask them to do—what comes to mind? What do they think is at stake in raising or lowering spending?
Oddly, we know little about this. The field of American political development (APD) has dedicated thoughtful attention to notions of the “state,” but typically from an institutional perspective. And while public opinion research has identified many predictors of opinion on spending, it has not addressed the substance of such views. We know a lot about what makes people more or less likely to say government spends too much, but little about what they mean when they say this.
The one existing study on this subject argues that opinion on government spending is really opinion on social welfare spending (Jacoby Reference Jacoby1994). But this claim rests on shaky methodological grounds. Because the spending question in this analysis cues social welfare spending, it is impossible to infer with confidence that public views on spending are actually just views on social welfare programs. This claim is also theoretically suspect. In a nation as large and diverse as the United States, it is unlikely that any one type of spending dominates public thinking on government spending in general. And in this era of hyperpartisanship, it is especially unlikely that Republicans and Democrats think about spending in the same manner. We expect to find evidence of what we call substantive divergence along party lines in this area—that is, different images and ideas are likely to come to mind for members of the two major parties, on average, when they consider questions about government spending.
Analyzing the incidence of substantive divergence can help us better comprehend observed differences between the preferences of Democrats and Republicans on matters of government spending, among other issues. Democrats and Republicans might think about the same sorts of things when they think about spending—in which case, the disagreement is about the value of those things—or they might have entirely different associations with spending. Of course, it may also be a mix. Distinguishing between these two types of disagreement can bring partisan conflict into sharper relief, and help scholars, elected officials, and members of the public navigate pathways to cooperation and compromise.
Our analysis of public views on spending, across the population and within partisan camps, has implications for our understanding of Congressional action on matters relating to the public purse. Research demonstrates a strong and robust relationship between public opinion and legislative behavior on a range of policies, including spending (Miller and Stokes Reference Miller and Stokes1963; Page and Shapiro Reference Page and Shapiro1983; Stimson, Mackuen, and Erikson Reference Stimson, Mackuen and Erikson1995; Lax and Phillips Reference Lax and Phillips2009; Krimmel and Rader Reference Krimmel and Rader2014, among others). Learning more about the substance of public opinion on spending sheds light on the incentives and constraints lawmakers face as they engage in fiscal policymaking, a critical topic given the intense and sometimes paralyzing conflict afflicting Congressional action in this area in recent years.
For the normative minded, it also speaks to the question of whether or not members of Congress should consider public preferences in the fiscal arena. Scholars have long questioned whether public opinion on spending is meaningful and sensible. Many have noted tensions in public attitudes toward spending, like the “more for less paradox”: people want higher spending on many programs, but also lower taxes (Sears and Citrin Reference Sears and Citrin1982; Hansen Reference Hansen1998; Ladd et al. Reference Ladd, Potter, Basilick, Daniels and Suszkiw1979; Page and Shapiro Reference Page and Shapiro1992; Welch Reference Welch1985). The public, on the whole, is also “symbolically conservative” but “operationally liberal”, expressing desire for smaller government in the abstract but increases in spending across many specific programs (Free and Cantril Reference Free and Cantril1967; Feldman and Zaller Reference Feldman and Zaller1992; Ellis and Stimson Reference Ellis and Stimson2012; Grossman and Hopkins Reference Grossman and Hopkins2016). These tensions raise questions about the public’s ability to assess government spending writ large, and by extension its appropriate role in fiscal politics. Our analysis contributes to the debate on these questions by revealing what people mean when they say they want more or less spending.
To accomplish this, we do something simple but powerful: we ask them and allow them to use their own words to answer. We began our original survey of American adults by asking them to evaluate the level of government spending, using a neutral question that by design does not cue any particular type of spending. We then ask them if they were thinking about a specific type of spending and, if so, what type.
Belying the conventional wisdom on this subject, we find that opinion on general spending is not reducible to views on social welfare programs. In fact, no one type of spending dominates public thinking on this subject. Most people do have specific associations with government spending; but in the aggregate, public associations span a wide range of government functions. Public opinion is quite reasonable in this sense. However, balance does not necessarily mean harmony. Our analysis uncovers a source of deep discordance in public views on spending obscured by prior work relying on closed-ended survey questions. Democrats and Republicans do not simply disagree about how much government spending is appropriate, they also assign different meanings to this concept, evincing substantive divergence. When they think about spending, members of the two major parties envision different bundles of goods and services, on average. For example, Republicans are more likely than Democrats to think about foreign aid, immigrants, and government employees, while Democrats are more likely to think about defense, education, and infrastructure. Examining associations within subsets of respondents who have similar views on spending, we continue to find evidence of substantive divergence between partisans. Even when Democrats and Republicans say the same thing—government spends too much, for example—they mean something different. These findings contribute to our understanding of fiscal politics and also have broader implications for the conceptualization and measurement of differences across parties as well as other political cleavages.
Revisiting the Substantive Meaning of Public Views on Spending
The substantive meaning of public opinion on government spending has received scant attention in political science, especially in proportion to its importance. This subject falls into a “no man’s land” between APD and political behavior. The behavior literature offers insight into what people think about a wide range of subjects, and what kinds of traits and experiences impact opinion.Footnote 3 But there has been less focus on the substance of opinion, and almost no attention to the images and ideas that come to mind when people think about government spending in particular. And while the APD literature has engaged in substantive examinations of the state, it has tended to do so through an institutional lens. Suzanne Mettler (Reference Mettler2011) shows that policy design has rendered certain parts of the state invisible to many people, to the detriment of public faith in government and democratic accountability. But additional work is needed in order to clarify what does come to mind for people when they think about the state.
The conventional wisdom on the substantive meaning of public opinion on government spending—indeed, the only wisdom, as there is but one existing study—comes from Jacoby (Reference Jacoby1994). Performing a scaling analysis of attitudes about spending using data from the 1984 American National Election Study (ANES), Jacoby finds that opinions about social welfare programs are scalable, while opinions on other kinds of spending are not.Footnote 4 Regressing opinion on government spending generally on a scale of social welfare attitudes and attitudes about each of the non-scalable items, he finds that opinion on social welfare spending is by far the strongest predictor of opinion on spending generally. He concludes that “the popular conception of the government spending issue does not subsume all forms of public expenditures; instead, it focuses on social welfare programs. Non-welfare policy programs are regarded as separate concerns” (Jacoby Reference Jacoby1994, 337).
Further analysis is needed in order to accept this conclusion, however. The general spending question in this analysis is not truly general. Rather, it points out a tradeoff between spending and services, asking people to place themselves on a 7-point scale between “government should provide many fewer services and reduce spending a lot” and “government should provide many more services and increase spending a lot.” It makes sense that people would base their answer to this question on their views on social welfare spending, as they were prompted to do so. This does not necessarily mean that opinion on general spending amounts to opinion on social welfare spending.Footnote 5
We agree with the premise of Jacoby’s analysis, that studying associations with spending can help us better understand opinions on spending. In making assessments in politics, as in other areas of life, people tend to rely on heuristics.Footnote 6 A piece of a whole can serve as a heuristic, simplifying decision making. When asked about spending generally, many people are likely to think about the pool of specific associations they have developed over time.
But better measures of these associations are needed in order to discern the substantive meaning of opinion on spending generally. Relying on the battery of policy questions available in the ANES is limiting. If these questions do not cover the full range of associations people have with spending, certain associations will go unobserved. Even if one were to design a survey for this purpose, closed-ended policy questions require the researcher to decide, ex ante, what associations people are most likely to have. Allowing people to list their own associations in their own words offers a richer picture of the substantive meaning of opinion on spending.
Thus, we measure associations with government spending using an open-ended follow up to a substantively neutral question about spending. In doing so, we expect to find a large range of associations because government spending covers many goods and services. As explained earlier, we also expect to find evidence of substantive divergence across party lines.
The Concept of Substantive Divergence
Scholarly attention to partisan differences has risen over the past few decades. Under the general rubric of polarization, a few concepts have emerged. Each advocates a different measurement technique, but all enhance our understanding of the barriers to communication and cooperation between Democrats and Republicans.
Most prominently, party polarization in the electorate is defined by differences between the parties in terms of ideology (“ideological polarization”) or policy positions (“issue polarization”) (DiMaggio, Evans and Bryson Reference DiMaggio, Evans and Bryson1996; Abramowitz and Saunders Reference Abramowitz and Saunders1998; Layman and Carsey Reference Layman and Carsey2002; Jacobson Reference Jacobson2005; Layman, Carsey, and Horowitz Reference Layman, Carsey and Horowitz2006, and others). The correlation between ideology and partisanship is strong today, having grown substantially since the early 1970s. Over this same period, Republicans have also come to hold more conservative positions than Democrats across many issues (Layman and Carsey Reference Layman and Carsey2002; Layman, Carsey and Horowitz Reference Layman, Carsey and Horowitz2006; Fiorina and Levendusky Reference Fiorina, Levendusky, Nivola and Brady2008). While there is disagreement among scholars about the extent to which these changes constitute polarization, it is clear that Democrats and Republicans have become more distinct in their ideologies and policy positions.
There is also evidence of so-called “affective polarization.” People’s feelings toward their own party have been fairly constant over time, while feelings toward the opposing party have become more negative (Iyengar, Sood and Lelkes Reference Iyengar, Sood and Lelkes2012). Relatedly, a growing sense of partisan team spirit (“social polarization”) has led to inter-partisan discrimination and heightened emotion in the political arena (Mason Reference Mason2015).
We argue that there is another way to think about party difference: substantive divergence. We define substantive party divergence as the incidence of significant differences across the two major parties in the meanings they attach to political concepts or policies. Such differences can be observed empirically by looking at differences in associations. In the case of government spending, Democrats may have one set of programs or issues in mind, while Republicans think of another set. As with other types of partisan differences, the study of substantive party divergence offers a way to compare Democrats and Republicans in a manner that facilitates a better understanding of relationships within and across party lines. We use the term “divergence” because, unlike measures of polarization, differences in meanings and associations cannot be characterized by the distribution of an ordinal measure.
Conceptually, substantive divergence is more similar to issue polarization than affective or social polarization, as measures of substantive divergence focus on people’s views of political things (e.g., policies, concepts) rather than people (e.g., opposing partisans). But there are important differences between substantive divergence and issue polarization. Measures of the latter tell us how much Democrats and Republicans differ in terms of their policy preferences—what they think should be done in certain policy areas. Measures of substantive divergence tell us whether the concepts or policies in question have similar meanings to both groups. While these two things are related, conceptually and probably empirically as well, they are distinct. Either could be present without the other. Conceptualizing and measuring them separately can help us better understand similarities and differences between Democrats and Republicans.
Why do we expect to observe substantive divergence along party lines on government spending? Definitions of issues and problems are politically contested, and politicians and other elites work hard to frame issues in particular ways (Gamson Reference Gamson1992; Gamson and Modigliani Reference Gamson, Modigliani and Braungart1987). Framing can involve “metaphors, catch-phrases, and other condensing symbols that frame the issue in a particular fashion” (Gamson and Modigliani Reference Gamson, Modigliani and Braungart1987, 144). It can also mean emphasizing specific features of an issue or policy (Chong and Druckman Reference Chong and Druckman2007, 106). By routinely mentioning certain types of goods or services in general discussions of government spending, elites can turn them into “condensing symbols.” In theory, substantive divergence could develop across any political cleavage with respect to any issue, so long as condensing symbols on the issue vary significantly across the cleavage. We argue that it’s especially likely to develop along party lines with respect to government spending because party identification plays a particularly important role in shaping views on political issues (Campbell et al. Reference Campbell, Converse, Miller and Stokes1960, among others), and government spending is a core issue dividing the two major parties. Since Democrats and Republicans in the electorate receive different cues from their respective party elites on this issue, they are likely to conjure different images when they think about spending.Footnote 7
This is not to say that substantive divergence at the mass level is caused entirely by elite cues. People may develop associations during the course of their everyday lives. Those living in urban areas may associate government spending with public transportation, older people may associate it with Social Security and the like. Seeing benefits flow to others may also lead to the development of associations. For example, people who live close to public housing complexes may link spending with such institutions even if they live in private single-family homes. Given that Democrats and Republicans differ, on average, in ways that are likely to impact the types of government spending they observe in their everyday lives (e.g., Democrats are more likely than Republicans to live in urban areas, more likely to be younger, etc.), substantive divergence on government spending is likely to develop. In any event, the root of substantive divergence is beyond the scope of this paper. Our argument is simply that this type of party difference is likely to exist and that it can help us better understand opinion on spending, among other issues.
Survey Data and Measurement
We administered an original survey to a sample of 2,421 U.S. adults over the internet from July 7–14, 2015 using Qualtrics.Footnote 8 Survey Sampling International (SSI) recruited participants and directed them to the survey website.Footnote 9 We manage missing values by using list-wise deletion.Footnote 10
The first item in our survey was: “There has been much discussion lately about federal government spending. What do you think—are we spending too little, about the right amount, or too much?” Immediately after this question, we posed an open-ended follow up: “In answering the previous question, were you thinking about any particular type of spending? If so, what type of spending was that?” Respondents were given a blank box in which to write their responses.Footnote 11
This strategy amounts to a compromise between the divergent ways in which political scientists and historians interested in the state have tended to measure public views. Typically, political scientists have employed surveys. Historians, by contrast, have often relied on primary sources and texts, “focusing on ordinary people according to their own words and behavior” (Shapiro Reference Shapiro, Valelly, Mettler and Lieberman2014, 4). Open-ended survey questions offer the benefits of polling with more richness than close-ended questions can capture.Footnote 12
After reading the answers to the open-ended questions, we developed eighteen categories based on the most common types of answers and created a binary indicator for each category.Footnote 13 Eleven are types of “domestic spending”: business, education, general domestic, healthcare, immigrants, infrastructure, other (domestic), research and development, Social Security and Medicare, social services, and welfare. Two relate to “foreign spending”: defense and foreign aid. Four are “other spending”: debt, government employees, taxes, and waste. Finally, we have a “general” category, which includes all responses that do not point to any particular type of spending. Section A.2 in the online appendix provides details on each category, including particular inclusions and exclusions and example answers.
Our coding scheme was non-exclusive. When people listed multiple categories, they were coded 1 for each of them.Footnote 14 For example, the following answer was coded 1 for businesses and 1 for healthcare: “Government spending on corporate bailouts, and healthcare systems.” The answer “education and war” was coded 1 for education and 1 for defense. When people indicated that they were thinking generally and then mentioned a particular type of spending, they were coded 1 for “general” and 1 for whatever specific category or categories they mentioned.Footnote 15 For example, the following statement was coded 1 for “general” and 1 for “elected officials”: “I was not thinking about anything in particular. Maybe the salaries and perks of our leaders and people in office”. Similarly, the following statement was coded 1 for “general” and 1 for “waste”: “Nothing in particular, seen many shows on the government waste!!!!!!!”
A few people listed exceptions, which we treated as associations. For example, the following was coded 1 for “general” and 1 for “defense”: “I was thinking of everything EXCEPT what we spend on wars. I sort of wanted to say ‘spend too [sic] uch’ since the war issue is bad." Some people indicated that they thought spending was too high or too low in certain areas. For our purposes, such references all count as associations. For example, the following was coded 1 for “business” and 1 for “social services”: “To [sic] much on helping big business and not enough on the elderly and working poor.” Our aim is to understand what comes to mind for people in thinking about government spending, regardless of the nature of the association.
Associations with Government Spending
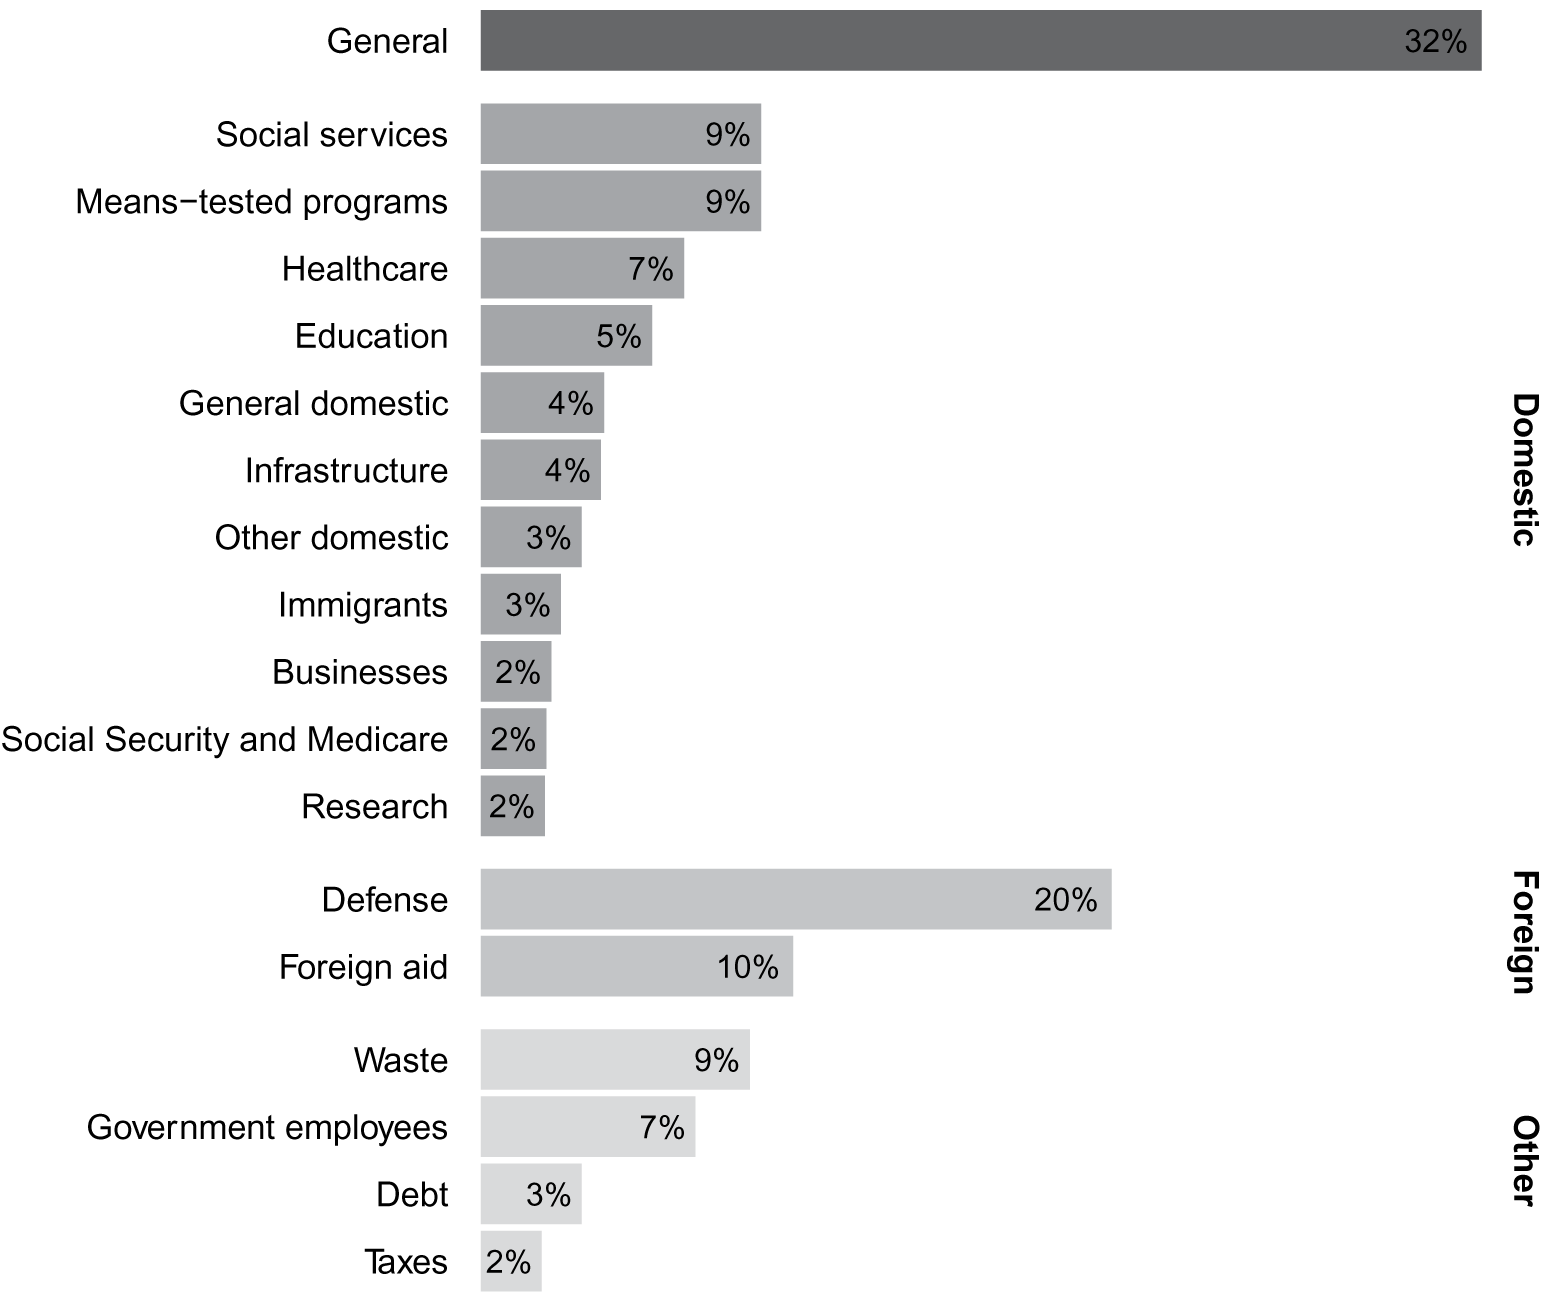
Asked about spending in general, 63% of our respondents said the government was spending too much, 24% said about the right amount, and 13% said too little. Do these answers essentially reflect distaste for social welfare spending, as prior work would suggest? Examining associations with spending, we find that the answer is no—opinion on spending is not so one dimensional. Figure 1 displays responses to our open-ended question, which asked what, if anything, people were thinking about in answering our general question about spending. While the modal category is “general” (32% of respondents gave an answer that fell under this heading), a large supermajority (72%) reported that they had at least one particular type of spending in mind.Footnote 16 Forty-nine percent of people had one specific association, 14% had two, 6% had three, and 3% had four or more.
Associations with government spending
Note: This graph shows the percentage of our sample that mentioned each type of spending.
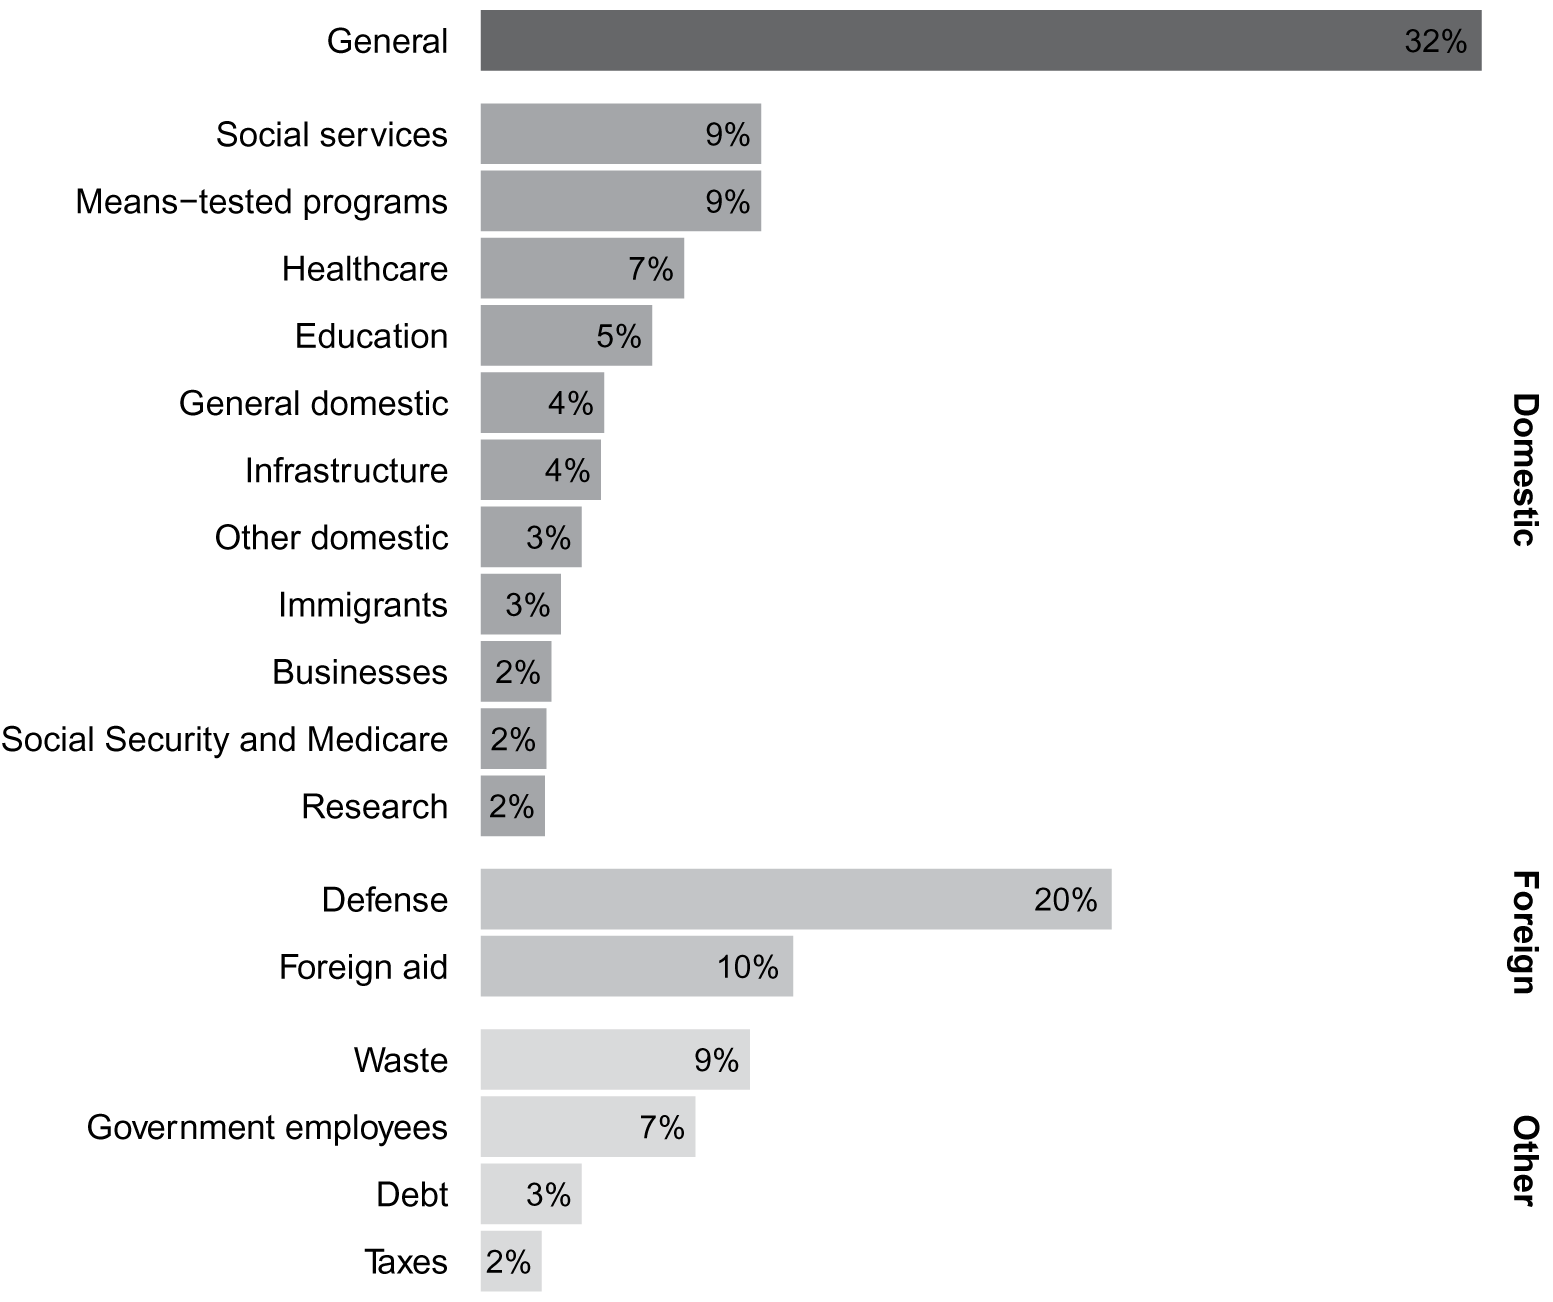
It was common for people to associate general spending with one particular type of spending, but that type varied greatly. In contrast to Jacoby (Reference Jacoby1994), we find there is no clear focal program that people associate with spending. The largest category is defense, but even that was only mentioned by 20% of the sample. No other category was mentioned by more than 10% of respondents. This suggests that, while most people conjure specific images in evaluating spending, no one image or set of images dominates public thinking about federal spending. Even if we lump together all categories identified by Jacoby as social welfare spending (Social Security and Medicare, means-tested programs, and social services), we still find that only 18% of people mention anything in this category. Notably, this includes responses that mention social welfare programs not covered by the specific ANES questions used in Jacoby’s analysis, like programs for children, the elderly, homeless people, veterans, and people with disabilities.
These findings have nuanced implications for the question of whether public opinion on spending represents a broad assessment of spending across the board. At the individual level, most people have one or two specific types of spending in mind when they think about spending writ large. Together, however, people cover a wide range of categories. En masse, the governed have a reasonably good sense of the state, at least in broad strokes.
On the other hand, this aggregate sense of the state is distorted relative to the actual size of federal budget items. It is clear, for example, that fiscal conflict is not about Social Security and Medicare, even though these items account for approximately 39% of the federal budget, cause real fiscal challenges, and directly affect most people at some point in their lives. And foreign aid, mentioned by 10% of respondents, plays an outsized role in fiscal conflict relative to its impact on the budget (it accounts for less than 1% of federal spending) and people’s everyday lives.Footnote 17 In the aggregate, fiscal conflict is not about one thing, but it is not all about major budget items either.
Analyzing Substantive Divergence
We argued that associations with spending were likely to be diverse, and that they should vary systematically across party lines. Examining associations with spending among the whole population, we found support for the first part of this argument. We turn now to the second part.
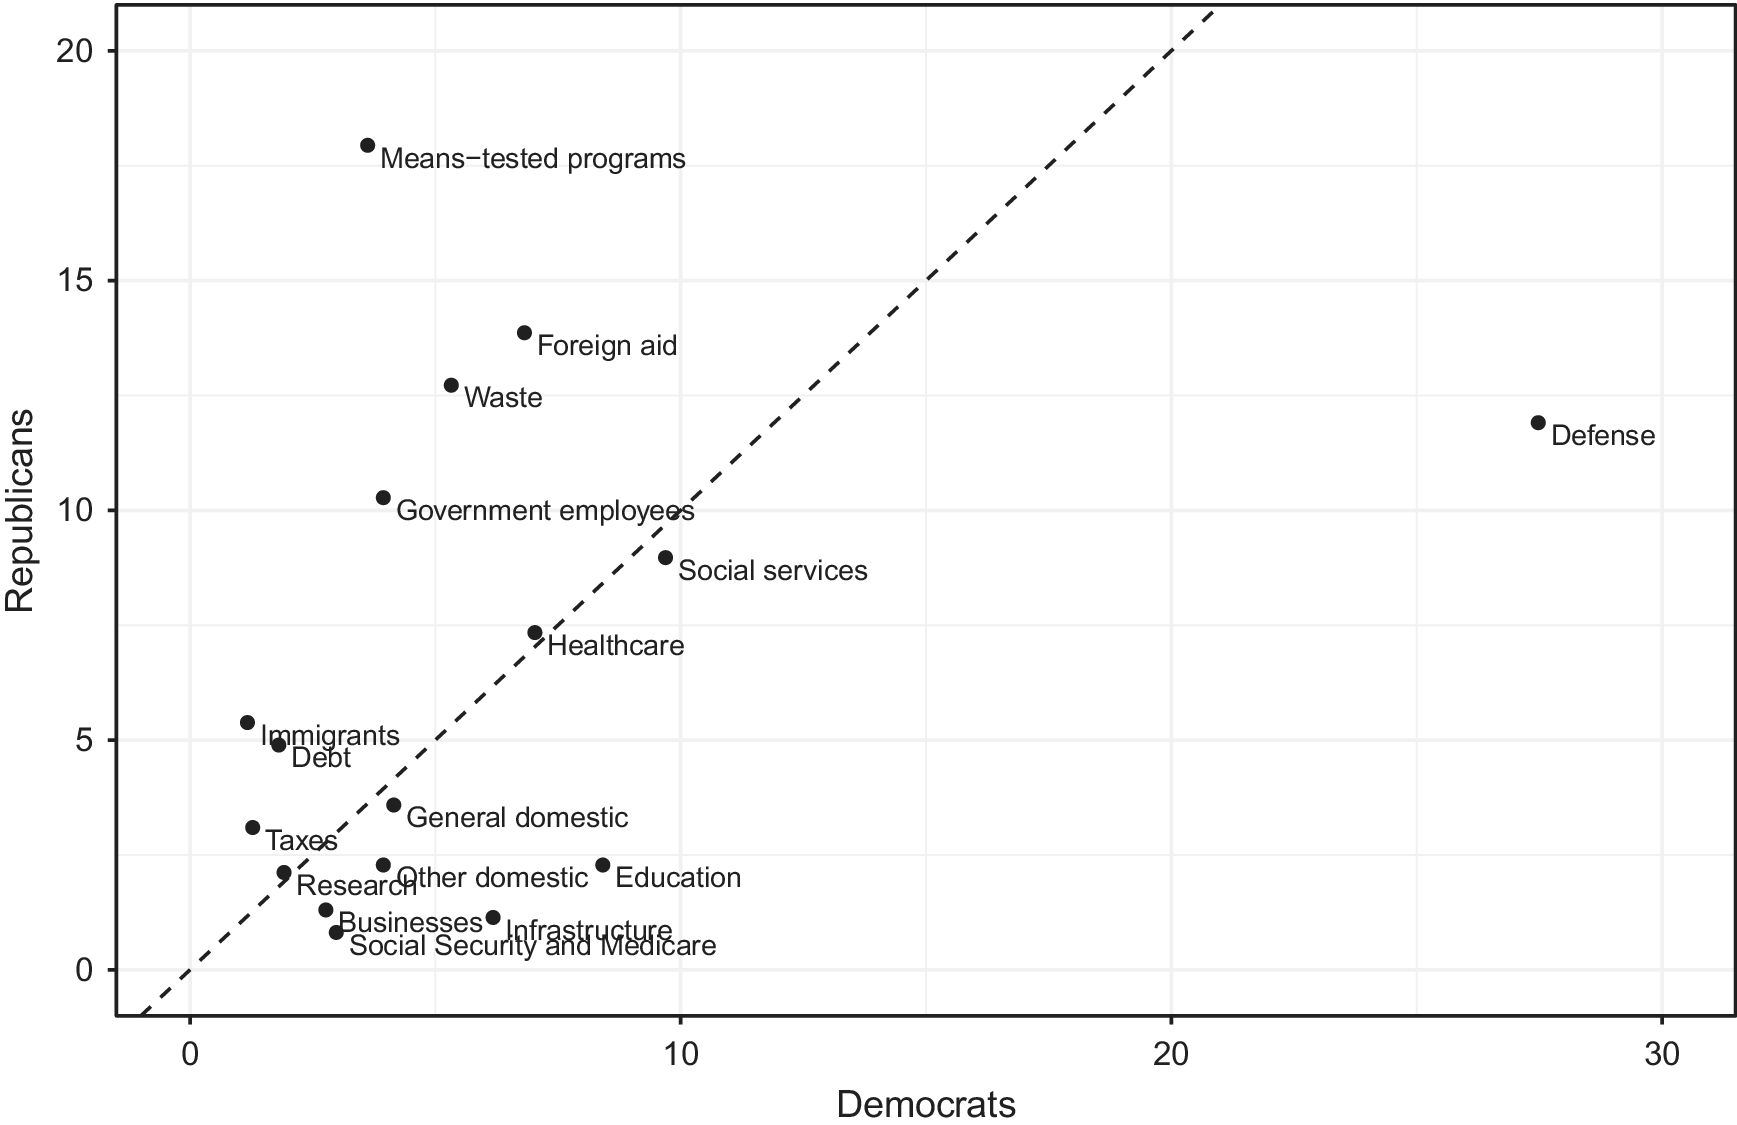
Do Republicans and Democrats have different associations with spending? As figure 2 shows, they do. This scatterplot displays the percentage of Democrats (on the x-axis) and the percentage of Republicans (on the y-axis) who mentioned each of the seventeen specific categories of spending listed in figure 1. The dotted 45-degree reference line shows where the dots representing each type of spending would fall if Democrats and Republicans were equally likely to mention each type of spending. Categories falling to the right of the reference line are more Democratic associations, while those falling to the left of the line are more Republican associations. While there is a positive correlation between the incidence of associations between Democrats and Republicans (0.34, p=.18), and a few categories are on or very close to the reference line (e.g., healthcare, research), most are not.
Substantive divergence in public opinion on government spending
Note: This figure shows the percentage of Democrats (on the x-axis) and the percentage of Republicans (on the y-axis) who mentioned each type of spending.
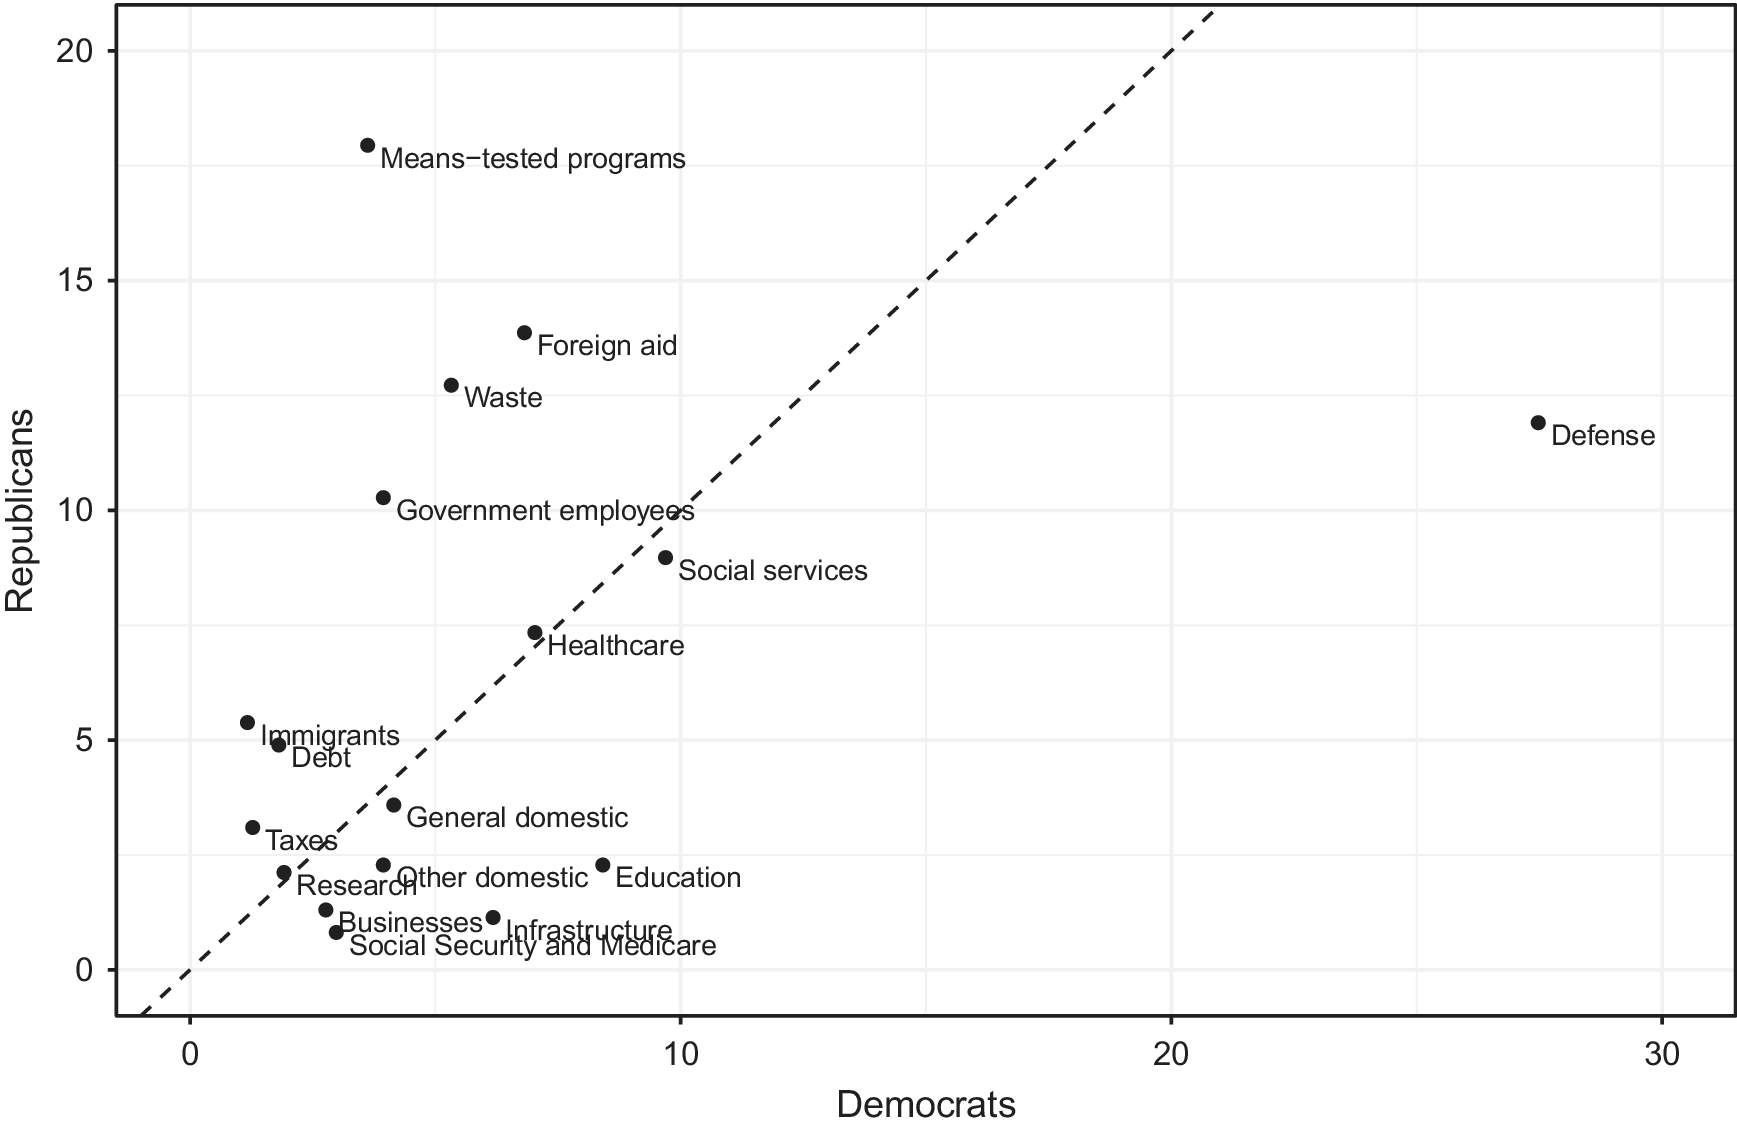
Republicans are more likely than Democrats to think about foreign aid, means-tested programs, waste, government employees, debt, immigrants, and taxes. Democrats are more likely than Republicans to think about defense, education, infrastructure, businesses, and Social Security and Medicare. There is a rough pattern to these partisan associations: Republicans are more likely to think about types of spending that are unpopular in general or with their party in particular, while Democrats are more likely to think about types of spending that tend to be more popular in general or with their base in particular. A significant exception is defense spending, which is much less popular than most of the other Democratic associations.Footnote 18 This is driven largely by Democrats with negative views on spending in general.
The differences we observe in figure 2 are statistically significant. We ran eighteen linear probability models with robust standard errors, one for each category of spending, estimating the likelihood of mentioning each type of spending as a function of party.Footnote 19 These models include indicators for Republican identifiers (including leaners) and for independents, as in the following example, which shows how we model the probability of mentioning defense spending.
 $$ {Defense}_i={\beta}_0+{\beta}_1{Republican}_i+{\beta}_2{Independent}_i+{\varepsilon}_i $$
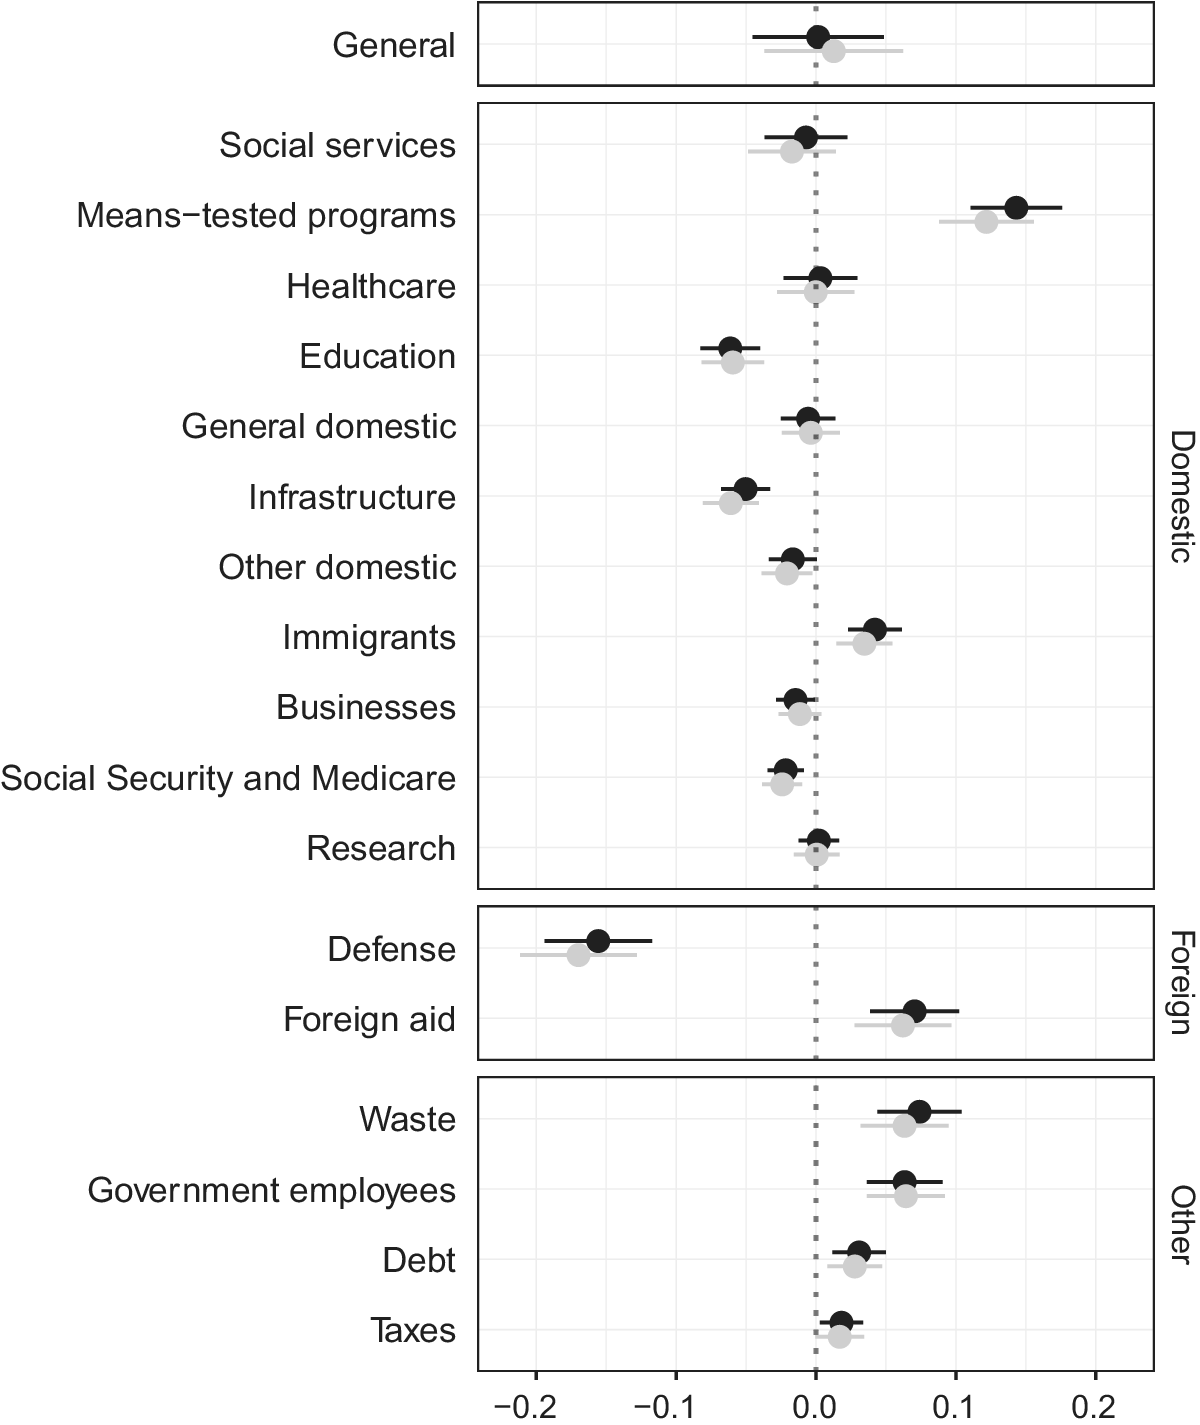
Figure 3 displays in black the coefficients (dots) on Republican from these models, with 95% confidence intervals (lines).Footnote 20 These estimates represent the difference between Republicans and Democrats in propensity to have a certain association. Positive coefficients indicate that Republicans are more likely than Democrats to have that association, and negative coefficients vice versa. For example, Democrats are 16 percentage points more likely than Republicans to mention defense spending, while Republicans are 14 percentage points more likely than Democrats to mention means tested programs.
Partisan differences in associations with spending
Note: This figure plots coefficients on Republican, which represent the difference between Republicans and Democrats, from two sets of eighteen linear probability models in which the dependent variable was an indicator for whether or not the respondent thought about each particular type of spending. Coefficients from the models including only party indicators are represented by black dots, and coefficients from models with demographic controls are represented by gray dots. Lines indicate 95% confidence intervals calculated with robust standard errors. Positive coefficients indicate that Republicans are more likely to mention the category, and negative coefficients indicate that Democrats are more likely to mention the category. N=1,952 for all models.
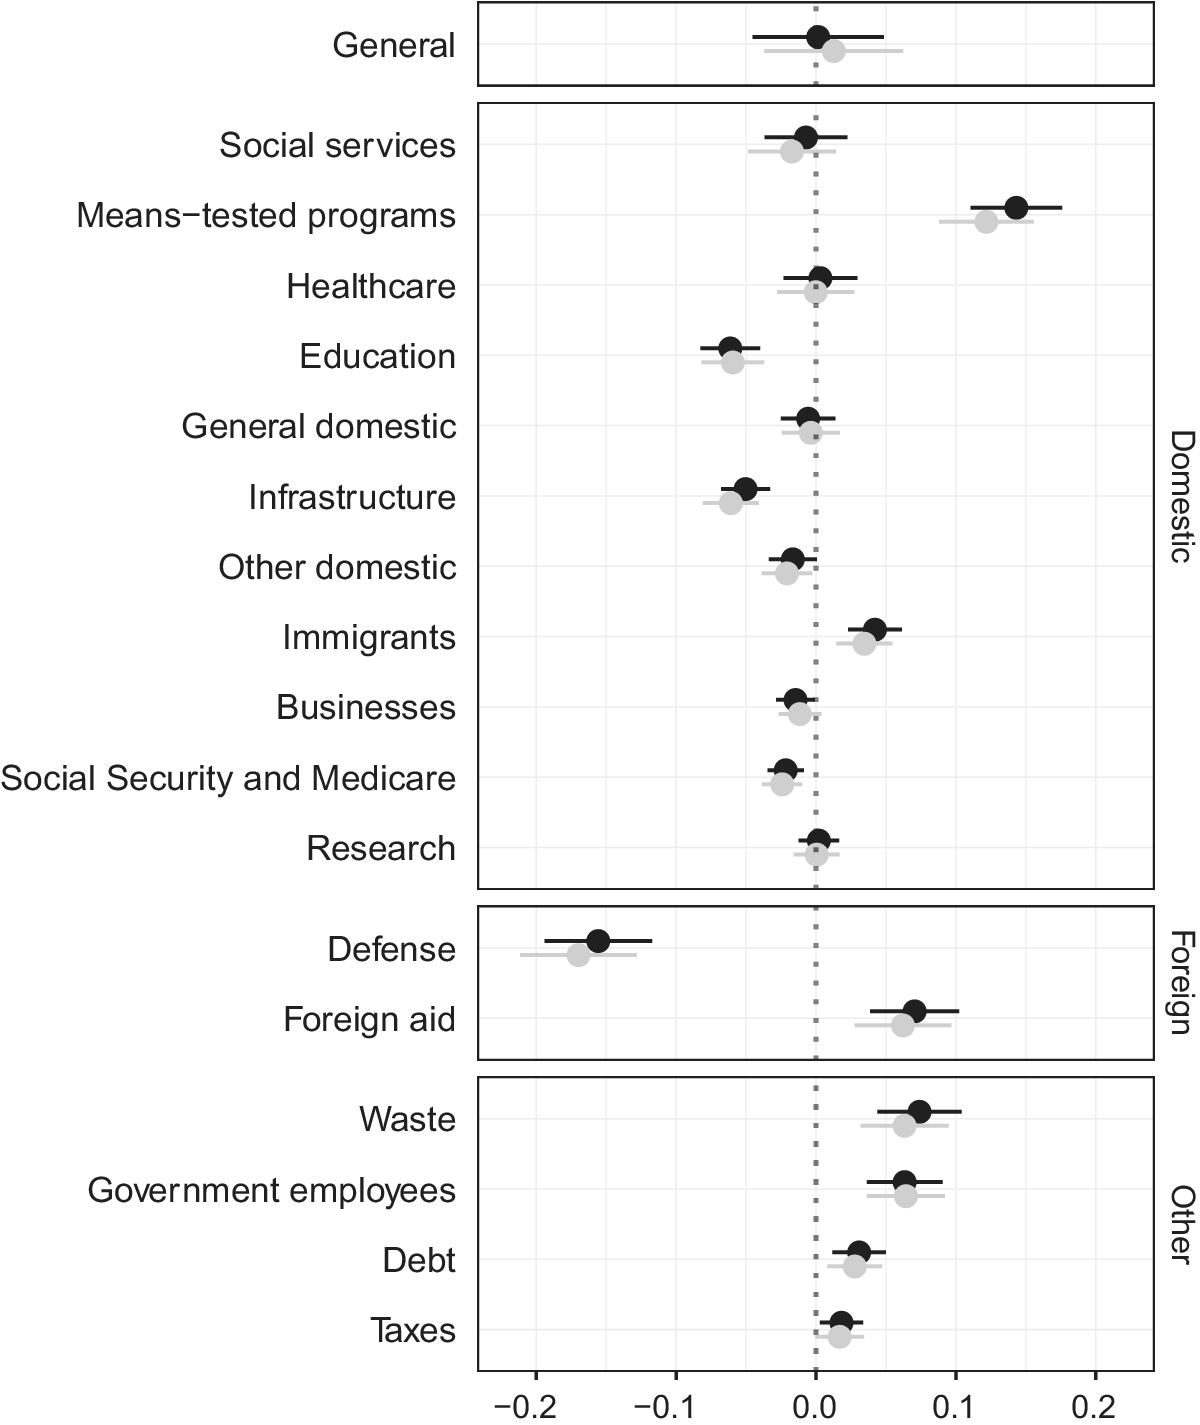
Associations vary significantly across party lines. Indeed, there were only a few categories of spending for which there was not a statistically significant difference between Republicans and Democrats. These results suggest that Democrats and Republicans envision different collections of goods and services when they think about government spending. Whether due to differences in life experiences, elite cues, or something else, Republicans and Democrats have different ideas about what exactly government spending means. This, in turn, suggests that they have different ideas about what’s at stake in debates on fiscal politics.
These partisan differences are not due to underlying demographic differences between Republicans and Democrats. We ran a second set of models, adding x, a matrix of controls for demographic characteristics typically associated with partisanship (age, income, race, education, and sex), to the models from the first set, as in the following example for defense spending.Footnote 21
 $$ {Defense}_i={\beta}_0+{\beta}_1{Republican}_i+{\beta}_2{Independent}_i+\mathbf{x}\gamma +{\varepsilon}_i $$
Coefficients on Republican from these models with 95% confidence intervals are plotted in gray in figure 3. On the whole, additional controls have limited impact on the party coefficients, which makes sense given that parties play a major role in organizing conflict on fiscal issues.
Of course, one might wonder if these partisan differences simply stem from issue polarization—that is, from differences in average opinions on spending across parties. People who think government spends too much may be more likely to think about unpopular programs, while people who say government spends too little may be more likely to think about types of spending that are more desirable to them personally and in general. Revisiting responses to the general spending question, it seems unlikely that the associational differences we observe are a simple byproduct of differences in views on the size of the state. Responses to the general question are correlated with party, but the relationship is far from perfect. In fact, “too much” was the modal response among both groups—83% of Republicans and 46% of Democrats think government should spend less. And “too little” was the least popular response on both sides of the aisle, with 17% of Democrats and 6% of Republicans giving this answer. Nevertheless, it is worth exploring this possibility more rigorously.
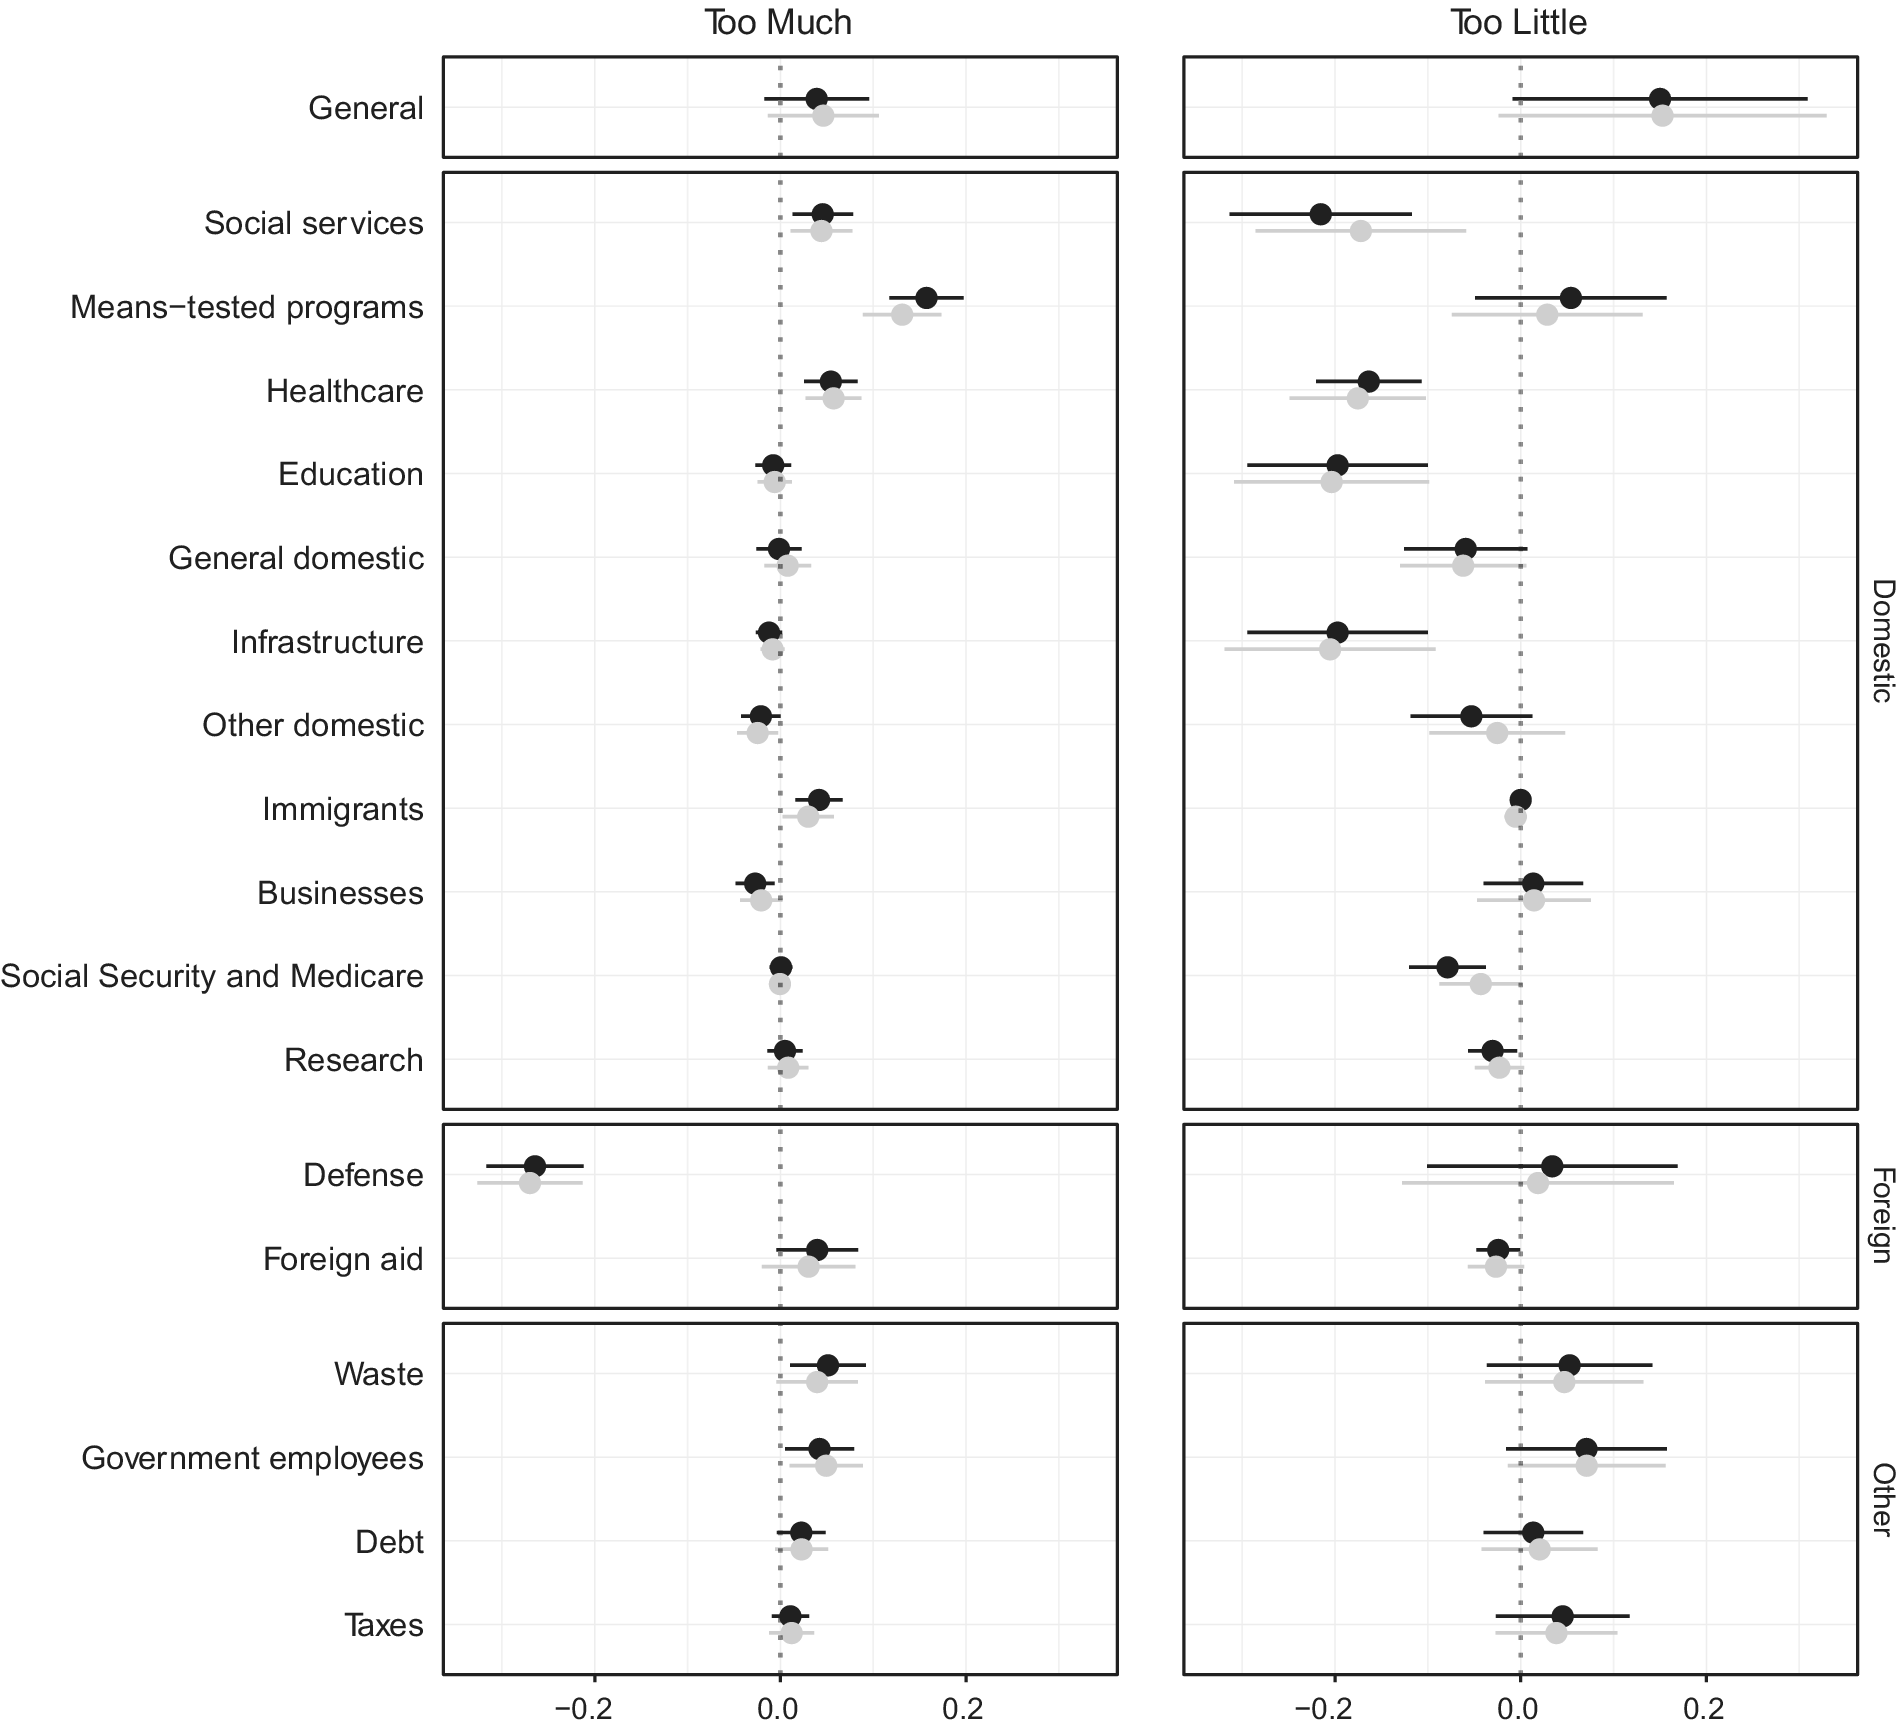
To do this, we compare Democrats and Republicans within response categories, running the same two sets of models described above for separate subsets of respondents who said the government spends “too little” and “too much.” Coefficients and 95% confidence intervals from these models are displayed in figure 4.Footnote 22 These models show that the substantive divergence we observe is not simply due to issue polarization.Footnote 23
Partisan differences in associations with spending, by response to general spending question
Note: These figures replicate the models shown in figure 3 for separate subsets of respondents who said that government spends too much (in the left panel, N=1,237) and those who said that government spends too little (in the right panel, N= 248). Positive coefficients indicate that Republicans are more likely to mention the category, and negative coefficients indicate that Democrats are more likely to mention the category. For more detail, see the caption to figure 3.
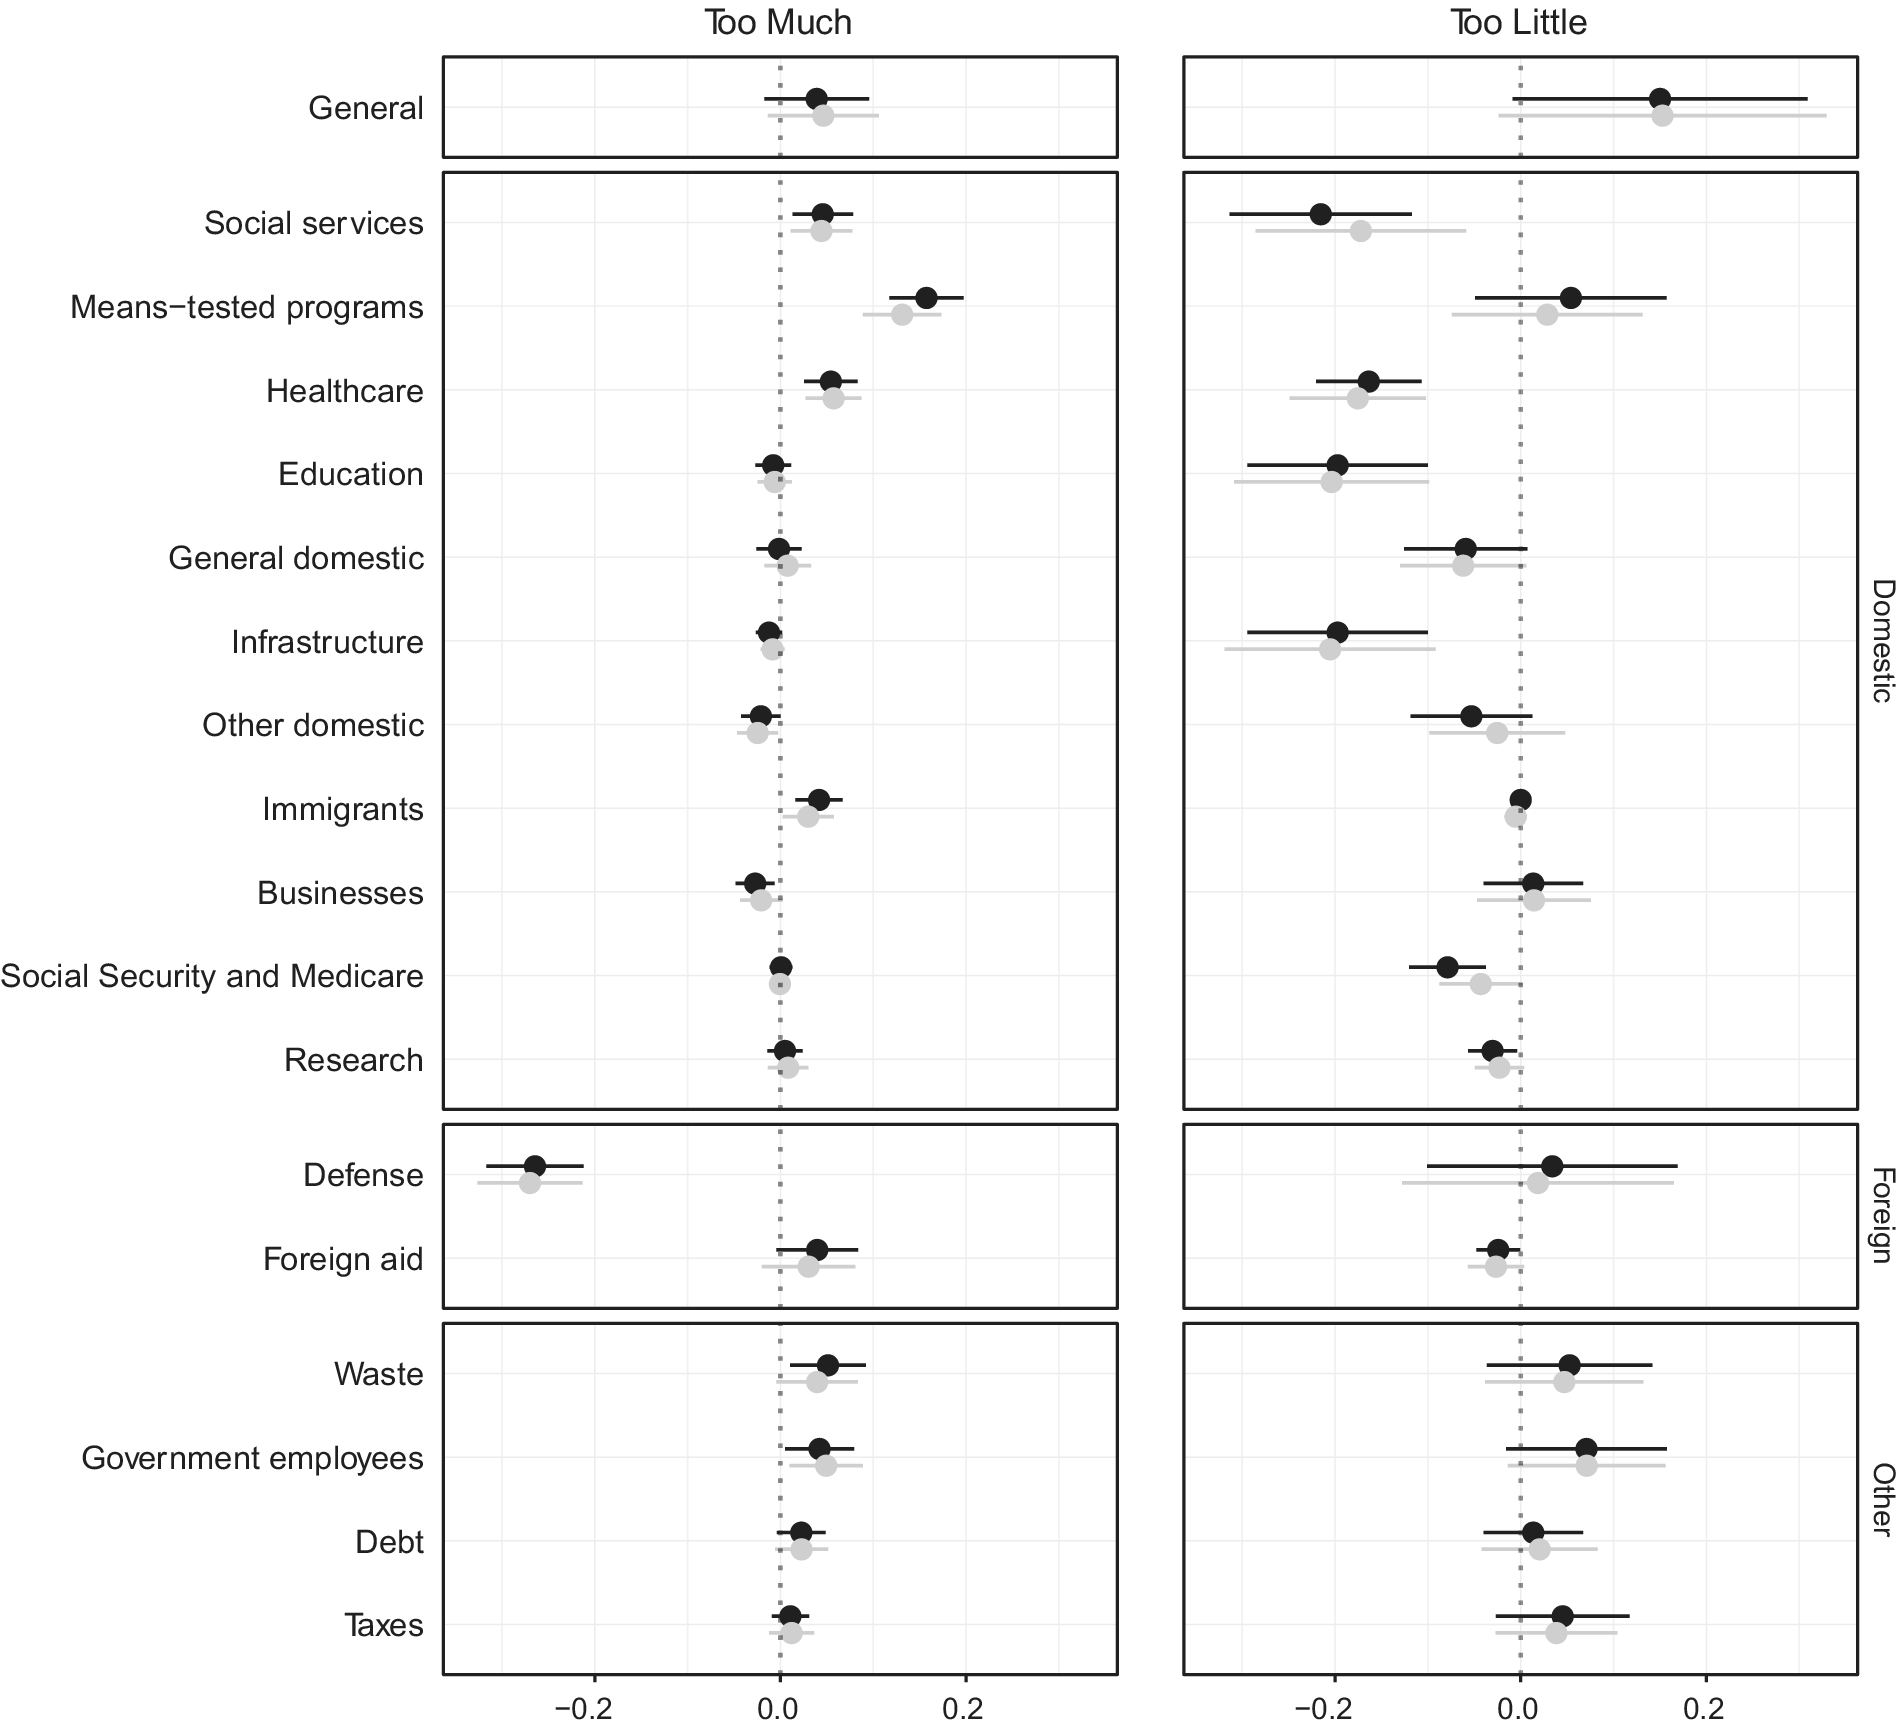
Beginning with the left panel, it is clear that Republicans and Democrats who say government spends too much have different types of spending in mind when they give this response. This suggests that they imagine different consequences stemming from a reduction in government spending. Republicans are more likely to think less spending would mean cuts to social services, means-tested programs, waste, government employees, healthcare, and immigrants, while Democrats are more likely think it would mean cuts to defense, other domestic spending, and businesses.
We also find significant differences between Republicans and Democrats who said the government spends “too little” (see the right panel of figure 4). Democrats were more likely than Republicans to think about foreign aid, social services, healthcare, education, infrastructure, Social Security and Medicare, and research. Again, this suggests that even those who want to see the same kind of action imagine different consequences of that action. These differences are striking because we are comparing Democrats to a set of very unusual Republicans (only 6% of Republicans said government spends too little). That these differences are statistically significant is also notable given the small sample size (only 31 Republicans and 131 Democrats gave this response). This is further evidence that government spending does not carry the same meaning for Democrats and Republicans.
In short, we find evidence of substantive divergence along party lines. When partisans evaluate government spending, they bring to mind different government programs and expenditures. Even when Democrats and Republicans agree that the government is spending too much or too little, they are at odds over what should change to bring the budget into line with their preferences.
Discussion and Conclusions
While major pollsters and large election surveys have asked many questions about government spending over the years, it has been hard to know what to make of this abundance of survey data. Because the notion of government spending is abstract and far-reaching, it is difficult to interpret public views in this area. To better understand the substance of public opinion on spending—in fact, to gauge whether it even exists in a meaningful sense—we push beyond the limitations of standard multiple choice survey questions, allowing respondents to use their own words to explain what, if anything, comes to mind when they think about spending.
We find that there is such a thing as public opinion on government spending broadly—it is not simply opinion on social welfare programs masquerading as opinion on general spending. Most people do have one or two particular types in mind when they think about spending generally; but, in contrast to Jacoby (Reference Jacoby1994), we find that no one program—social welfare or otherwise—overwhelms public thinking on spending. At the individual level, opinion on spending may not be well balanced with respect to the range of goods and services on which government spends money, but in the aggregate, public views on government spending reflect consideration of a wide array of government functions. Reducing opposition to government spending—if one were to have this goal—would require far more than decoupling spending writ large from notoriously unpopular welfare programs.
These findings offer new insight into how people think about the state, a subject at the nexus of political science’s traditional division of labor between behavioral and institutional research. We know, from insightful work by Suzanne Mettler (Reference Mettler2011), that people tend not to be aware of the “submerged state.” People generally do not associate tax expenditures (e.g., the Home Mortgage Interest Deduction) or government-backed benefits that are distributed through the private sector (e.g., employer-provided health insurance plans) with government. Our analysis underscores this point. Our findings also offer new insight into the range of goods and services that people do tend to think about in evaluating government spending.
Digging beneath the surface of issue polarization to conceptualize and measure substantive divergence, we also offer new insight into partisan conflict on fiscal issues, a topic of enduring importance in American politics. Members of the two major parties picture different kinds of goods and services when they think about government spending. Remarkably, this remains true when we compare Democrats and Republicans with similar evaluations of spending on the whole. Even when they appear to see eye to eye, they actually do not. In this sense, measures of issue polarization understate the differences between Republicans and Democrats on fiscal issues.
They can also obscure sources of conflict, hidden streams of oxygen for the fire, so to speak. Our analysis of substantive divergence shows that categories of spending about which there is partisan consensus, like infrastructure, are contributing to partisan conflict on fiscal issues through differences in associations. Asked about roads, highways, and bridges, 49% of Democrats and 46% of Republicans in our sample said we are spending too little, 40% of Democrats and 44% of Republicans said we are spending about the right amount, and 11% of Democrats and 10% of Republicans said we are spending too much. Evaluating this type of spending, Republicans and Democrats do not differ in a meaningful way. But, Democrats are more likely than Republicans to think about infrastructure when they think about government spending generally. This is true even for people with similar issue positions on spending.
These insights have implications for conflict resolution in this area. Finding common ground could involve not only movement on a left-right ideological continuum, but also a reconciliation of differences in the substantive meaning of spending and implications of its increase or decrease. Several of the Republican associations with spending are broadly unpopular (e.g., welfare, foreign aid) and several of the Democratic associations are broadly popular (e.g., education, infrastructure). If members of both parties could incorporate a broader range of associations with spending into their thinking on this matter, issue polarization could decline.
The concept of substantive divergence has great potential to contribute to our understanding of American politics inside and outside the fiscal arena, and warrants further theoretical development and empirical study. It would be valuable to measure associations with spending, among other issues, more frequently to get a sense of their stability. This analysis is based on a snapshot in time, a survey conducted during a particular news cycle with a particular arrangement of party control of government institutions and a particular economic context. Repeating this exercise routinely would give us a sense of associations’ sensitivity to changes in these factors. That said, we expect that such efforts would continue to produce evidence of substantive divergence along party lines, even if particular associations become more or less prevalent, since parties continue to be key players in shaping conflict on fiscal issues and many of the associations that people had with spending are perpetually on the national agenda.
Further work investigating substantive divergence in other issue areas would also be worth pursuing. In how many other areas does issue polarization dovetail with substantive divergence? Are there areas in which we see substantive divergence even without issue polarization? Future work might also consider whether the concept of substantive divergence stretches beyond the definition we provided here. We conceived of substantive divergence as differences across the two major parties in how they think about political concepts or policies. It’s possible that Republicans and Democrats also have different images in mind when they think about political institutions, like agencies and courts. It may be applied to other cleavages beyond parties as well. We know that gaps exist across other cleavages–like gender, race, and income–on a number of issues. Examining substantive divergence can help us understand the extent to which these gaps stem from differences in the substantive meaning assigned to political issues and concepts.
In extending the study of substantive divergence, we argue that it is important to use open-ended questions rather than simply looking for associations between specific questions and more general questions. In the fiscal realm, we found that the ANES battery of specific questions about spending includes many types of spending that almost no one considers when they think about government spending, like spending to improve and protect the environment, spending on child care, and dealing with crime. Fiscal conflict is not about those issues. And the ANES does not include questions about several of the most common types of spending that we find people think about in evaluating spending generally, like healthcare, infrastructure, and government employees. To learn about the range of associations with a concept or policy, it is necessary to allow respondents to use their own words to describe their thoughts. Though open-ended questions are more labor intensive to process than close-ended questions, these costs are far outweighed by the rich insights they can offer into public views on government spending, as well as on other issues.
Supplementary Materials
To view supplementary material for this article, please visit http://dx.doi.org/10.1017/S1537592720003588.