Implication
Krabok seeds are widely available in South-East Asian forests, contain large amounts of fat and as such are of interest to be used as a fat source in animal diets by local farmers. As krabok oil (KO) almost exclusively consists of lauric and myristic acid, it not only should be considered an energy supplier and its potential as modifier of the rumen microbial community was assessed here. KO showed potential to reduce rumen protozoal and archaeal numbers and shift rumen fermentation towards more propionate at smaller quantities than coconut oil (CO), another more common source of lauric and myristic acid.
Introduction
Lauric (C12:0) and myristic (C14:0) acid show potential to reduce the number of rumen Archaea and protozoa (e.g. Dohme et al., Reference Dohme, Machmüller, Estermann, Pfister, Wasserfallen and Kreuzer1999; Machmüller et al., Reference Machmüller, Soliva and Kreuzer2003b; Soliva et al., Reference Soliva, Hindrichsen, Meile, Kreuzer and Machmüller2003; Klevenhusen et al., Reference Klevenhusen, Meile, Kreuzer and Soliva2011), which make these medium-chain fatty acids (MCFA) important candidates for dietary methane mitigation in ruminants. The reduction in archaeal numbers might be partially because of the defaunating effect of MCFA (Dohme et al., Reference Dohme, Machmüller, Wasserfallen and Kreuzer2001), as some methanogens are endosymbionts or ectosymbionts of protozoa (Finlay et al., Reference Finlay, Esteban, Clarke, Williams, Embley and Hirt1994), although independent action of MCFA sources on rumen Archaea has also been reported (Dohme et al., Reference Dohme, Machmüller, Estermann, Pfister, Wasserfallen and Kreuzer1999). From batch in vitro incubations, C12:0 has been identified as the most powerful of the two MCFAs (Soliva et al., Reference Soliva, Hindrichsen, Meile, Kreuzer and Machmüller2003 and Reference Soliva, Meile, Hindrichsen, Kreuzer and Machmüller2004). In contrast, Rusitec and in vivo data (e.g. Dohme et al., Reference Dohme, Machmüller, Wasserfallen and Kreuzer2001; Machmüller et al., Reference Machmüller, Soliva and Kreuzer2003b; Klevenhusen et al., Reference Klevenhusen, Meile, Kreuzer and Soliva2011) indicated a similar effect of C12:0 and C14:0 on rumen Archaea, although protozoal numbers were suppressed less by C14:0 than by C12:0 (Dohme et al., Reference Dohme, Machmüller, Wasserfallen and Kreuzer2001). In vivo changes in archaeal numbers through the addition of coconut oil (CO), which is particularly rich in C12:0 (470 g/kg FA) and C14:0 (180 g/kg FA), are equivocal (Machmüller et al., Reference Machmüller, Soliva and Kreuzer2003a; Pilajun and Wanapat, Reference Pilajun and Wanapat2011). Furthermore, not only the total number of Archaea, but also the composition of the methanogenic population might be altered by MCFA supplementation, for example, studies using order-specific probes revealed Methanococcales to be less sensitive to C14:0 (Machmüller et al., Reference Machmüller, Soliva and Kreuzer2003b), whereas C12:0 seemed to have a greater effect on the free-living Methanomicrobiales than on the Methanobacteriales, which are frequently associated with protozoa (Klevenhusen et al., Reference Klevenhusen, Meile, Kreuzer and Soliva2011). Similarly, CO changed the diversity, dominance and functional organization of Archaea during an in vitro batch study, as evidenced from DGGE profiles (Patra and Yu, Reference Patra and Yu2013), although Hristov et al. (Reference Hristov, Vander Pol, Agle, Zaman, Schneider, Ndegwa, Vaddella, Johnson, Shingfield and Karnati2009), using the same molecular approach, could not attribute specific changes in abundance of methanogens to CO supplementation to dairy cows.
Although former observations indicate a different mode of action of C12:0 and C14:0, most comparative studies were conducted in vitro, whereas in vivo studies mainly used either C12:0 (e.g. Klevenhusen et al., Reference Klevenhusen, Meile, Kreuzer and Soliva2011), C14:0 (e.g. Machmüller et al., Reference Machmüller, Soliva and Kreuzer2003b) or CO (e.g. Hristov et al., Reference Hristov, Vander Pol, Agle, Zaman, Schneider, Ndegwa, Vaddella, Johnson, Shingfield and Karnati2009), with a fixed C12:0/C14:0 ratio. However, in practice, dietary fats with significant amounts of C14:0 in addition to C12:0 might be of major importance because of the lower palatability of C12:0 (Soliva et al., Reference Soliva, Meile, Hindrichsen, Kreuzer and Machmüller2004). Krabok oil (KO), an oil from krabok seeds (Irvingia malayana Oliv.ex A. w. Benn), is such a dietary oil source that contains similar amounts of C12:0, but is particularly richer in C14:0 (464 g/kg FA) as compared with CO. Hence, the comparison of two natural oil sources with similar amounts of C12:0 but varying in C14:0 content is considered of practical relevance.
The objective of this in vivo study was to compare the effect of CO and KO on rumen fermentation pattern, number of protozoa and Archaea, as well as their diversity and functional organization. Unfortunately, the experimental infrastructure did not allow for concomitant monitoring of methane emissions.
Material and methods
Animals
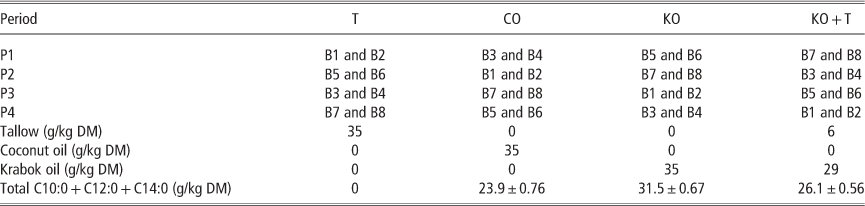
Eight rumen-fistulated bulls were used in a 4×4 Latin square design (Table 1). The experimental diets were fed as a total mixed ration (TMR) and consisted of (g/kg TMR): cassava chips, 421; rice straw, 211; dry tomato pomace, 158; molasses, 73.7; rice bran, 52.6; soya bean meal, 31.6; urea, 21; salt, 10.5; di-calcium phosphate, 7.4; oyster meal, 5.3; mineral premix, 5.3; and sulfur, 3.2. Water was provided ad libitum. The animals were adjusted to the TMR for 14 days followed by 4 experimental periods of 21 days (Table 1), which were separated from each other by a washout period of 21 days during which the basal diet was fed without external fat. At the beginning of each experimental period, the bulls were weighed to adjust the feed supply to 1.5% of BW, which was kept constant during the experimental period and supplied in two daily meals. Rumen sampling took place between days 15 and 21 of the experimental period.
Overview of the sequence of experimental treatments in a 4×4 Latin square design experiment with four treatments (supplementation (35 g/kg DM) with either beef T, CO, KO or KO+T) and eight bulls (B) in each of the four periods (P), the amounts of oil added to each treatment and the supply of medium-chain fatty acids (C10:0, C12:0 and C14:0) from CO or KO (average±s.d. of four batches of CO and KO)

T=tallow; CO=coconut oil; KO=krabok oil.
Treatments
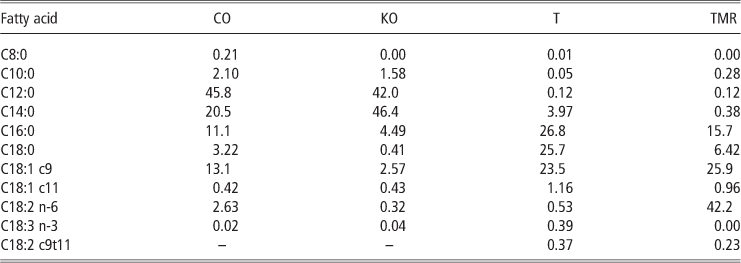
The four isolipidic diets in this study were: (1) TMR with 35 g/kg DM of beef tallow (T); (2) TMR with 35 g/kg DM of coconut oil (CO); (3) TMR with 35 g/kg DM of krabok oil (KO); and (4) TMR with 29 g/kg DM of krabok oil+6 g/kg DM tallow (KO+T). Treatment KO+T was designed in an attempt to provide similar amounts of MCFA as by CO (Table 1). Besides C12:0 and C14:0, C10:0 was also included in this calculation as the latter has been shown to effectively reduce methane production and/or the number of methanogens and protozoa (Dohme et al., Reference Dohme, Machmüller, Wasserfallen and Kreuzer2000 and Reference Dohme, Machmüller, Wasserfallen and Kreuzer2001; Goel et al., Reference Goel, Arvidsson, Vlaeminck, Bruggeman, Deschepper and Fievez2009). Dietary inclusion of oil supplements in the KO+T treatment was based on fatty-acid compositions of the oils used in a concomitant in vitro experiment (Panyakaew et al., Reference Panayakaew, Goel, Lourenço, Yuangklang and Fievez2013). Although oils were from a similar source for the current in vivo experiment, the composition of the four oil batches used in the current study deviated slightly (Table 2). Nevertheless, differences were small, allowing the original objectives to be assessed, as MCFA supplies of the treatments CO and KO+T did not differ significantly (P>0.05) (Table 1).
Fatty-acid composition (g/100 g fatty acids) of the CO, KO, T and TMR
CO=coconut oil; KO=krabok oil; T=tallow; TMR=total mixed ration.
Rumen sample collection
Rumen contents were collected on days 15, 18 and 21 of each period at 4 and 8h after the morning feeding (0700h) by sampling in different directions of the rumen. Samples were divided into three portions: the first portion of rumen contents (10ml) that was stored at −80°C until DNA extraction; the second portion rumen aliquot (10ml) was acidified with 0.2ml of phosphoric:formic acid (10:1) and stored at −20°C until volatile fatty-acid (VFA) analysis; and the third portion of rumen contents (1ml) was fixed with 10% formalin saline solution (37% to 40% formalin in 0.9% (w/v) normal saline solution, 1:9) and stored at 4°C for microscopical protozoal countings.
VFAs
Samples for VFA analysis were pooled per day and cow, and centrifuged at 15000×g (4°C) for 10min (HKFI Ltd., Mainland, China). The supernatant was filtered through a nylon membrane (0.2µm) and transferred to vials. The VFA analysis was performed using gas chromatography (Schimadzu GC-14A, ’s-Hertogenbosch, Belgium) (Van Ranst et al., Reference Van Ranst, Fievez, Vandewalle, Van Waes, De Riek and Van Bockstaele2010).
Protozoal counts
Microscopical counting was done using a haemacytometer (Boeco, Hamburg, Germany) of 0.1mm depth. Twenty aliquots per sample were counted (Galyean, Reference Galyean1989).
Archaea analysis
DNA extraction
The rumen samples were pooled per day and bull before DNA extraction. Total DNA was extracted from 0.4g rumen contents using the QIAamp Stool Kit DNA extraction method following the protocol for ‘Isolation of DNA from stool for Pathogen Detection’ in the handbook supplied by Qiagen Ltd. (Crawley, UK), according to the manufacturer’s recommendation.
Polymerase chain reaction (PCR) for denaturing gradient gel electrophoresis (DGGE) analysis
Amplification of a fragment of the 16S rDNA gene of Archaea for DGGE was performed using a single PCR with a forward GC-ARCH915 and reverse UNI-b-rev primer as described by Yu et al. (Reference Yu, García-González, Schanbacher and Morrison2008). The PCR mixture was based on the one described by Yu and Morrison (Reference Yu and Morrison2004), with adjustments according to the manufacturer’s instructions (Fermentas, St. Leon-Rot, Germany). PCR amplifications were performed in 25-µl volumes containing KCl (50mM), MgCl2 (1.5mM), dNTP mix (200µM), both primers (200nM each), 0.6U Taq DNA polymerase, 480ng bovine serum albumin/µl, 1μl DNA extract and 2.5μl 10X Taq buffer. Adjustments to 25µl were made with DNase-, RNase-free filter-sterilized water (Sigma, Bornem, Belgium).
Amplification conditions were according to Yu and Morrison (Reference Yu and Morrison2004) with small adjustments: initial denaturation at 94°C for 5min; 10 cycles of touch-down PCR (denaturation at 94°C for 0.5min, annealing for 0.5min with an 0.5°C/cycle decrement at a temperature of 5°C above the annealing temperature of 70°C and DNA synthesis at 72°C for 1min); 25 cycles of regular PCR (denaturation at 94°C for 0.5min, annealing at 65°C for 0.5min, DNA-synthesis at 72°C for 1min); and a final extension step at 72°C for 10min.
DGGE analysis
Archaea-specific PCR fragments were loaded onto a 7.5% (w/v) polyacrylamide gel with denaturing gradients ranging from 45% to 60%. The electrophoresis was run for 16h at 60°C and 50 V. DGGE patterns were visualized by staining with SYBR Green I nucleic acid gel stain (Molecular Probes, Eugene, OR, USA). Each gel included all treatments (n=4) and sampling days (n=3) per bull. To normalize the differences among gels, Archaea-specific fragments of one rumen reference sample were loaded in triplicate on each gel that was used as a standard for comparison of gels. The obtained DGGE patterns were analysed with the BioNumerics software version 3.5 (Applied Maths, Kortrijk, Belgium). Similarities were calculated by the Pearson correlation. The clustering algorithm of Ward was used to calculate dendrograms (Boeckaert et al., Reference Boeckaert, Fievez, Van Hecke, Verstraete and Boon2007). The DGGE profiles allow to gain insight into changes in diversity and functional organization of rumen microbial communities, which are assessed here through various indices and approaches:
(i) the range-weighted richness (R r), calculated according to Boon et al. (Reference Boon, Pycke, Marzorati and Hammes2011) based on the total number of bands (N), and the denaturing gradient comprised between the first and the last band of the pattern (D g) as: R r=N 2×D g; (ii) the Shannon (H), (iii) dominance (c) and (iv) eveness index (e), calculated as described by Patra et al. (Reference Patra, Stiverson and Yu2012) based on the peak surface of each band (n i), the sum of all peak surfaces of all bands (N) and the total number of bands (S) as: H=−Σ[(n i/N)×ln (n i/N)]; c=Σ(n i/N)2; e=H/ln (S); (v) the Pareto–Lorenz eveness curves (PL curves), based on the DGGE profile using the Lorenz–Gini method (Mertens et al., Reference Mertens, Boon and Verstraete2005; Marzorati et al., Reference Marzorati, Wittebolle, Boon, Daffonchio and Verstraete2008; Wittebolle et al., Reference Wittebolle, Marzorati, Clement, Balloi, Daffonchio, Heylen, De Vos, Verstraete and Boon2009) and constructed by ranking the respective DGGE bands for each sample from high to low intensity and using the cumulative proportion of bands and their respective cumulative proportions of intensities as X- and Y-axis; and (vi) the community organization, which describes the evenness (equality) of the archaeal population and is the normalized area between a given PL-curve and the perfect evenness line. community organization ranges from 0 to 100 and represents a single value that describes a specific degree of evenness. The higher the community organization coefficient, the more uneven a community (Boon et al., Reference Boon, Pycke, Marzorati and Hammes2011).
Quantitative PCR (qPCR)
Archaea rRNA gene copies present in the DNA extract of ruminal digesta samples were quantified as described by Boeckaert et al. (Reference Boeckaert, Fievez, Van Hecke, Verstraete and Boon2007) and Boon et al. (Reference Boon, Top, Verstraete and Siciliano2003), using an ABI Prism SDS 7000 instrument (Applied Biosystems, Lennik, Belgium). Amplification reactions were carried out in 25μl volumes containing 12.5μl SYBR Green PCR Master Mix (Applied Biosystems, Warrington, UK), 6μl RNA-free water and 5μl diluted (1:20) DNA extract, as well as the ARCH915 and UNI-b-rev primers at a final concentration of 300nM each. Measurements were taken in triplicate for each run. A standard curve for qPCR was constructed using six different DNA concentrations (n=3), ranging from 1.13 copies to 1.13×10⁸ copies of DNA per μl. An Archaea 492bp PCR fragment inserted in a TOPO vector was used as a template for the standard curve. Average amplification efficiency, slope and R 2 of qPCR assays were 102% (calculated as E=10(−1/slope)−1), −3.27 and 0.99, respectively.
Statistical analysis
Before statistical analysis, protozoa numbers were averaged over a day (i.e. average of 3, 6, 9 and 12h after feeding) and log transformed. Daily average protozoal numbers, VFA concentrations and proportions, archaeal log copies from qPCR and the indices as calculated from the DGGE profiles were subjected to a linear mixed model using SPSS 21 (SPSS Inc., IBM, Chicago, USA), according to the model Y ijk=μ+A i+B j+C k+ε ijk where Y ijk is the overall response; μ the overall of mean; A i the mean effect of treatment (i=1 to 4) (fixed factor); B j the mean effect of the period (j=1 to 4) (random factor); C k the mean effect of animal (k=1 to 8) (random factor) and ε ijk the residual error. Differences between means were considered to be significant at the P<0.05 level, tendencies at P<0.10. Treatment differences were distinguished using a two-sided Dunnett’s test.
Results
Rumen fermentation characteristics
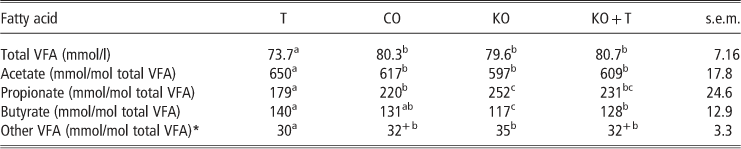
Treatments with MCFA resulted in a higher concentration of total VFA (P<0.05), a lower proportion of acetate (P<0.01) and higher proportion of propionate (P<0.01) in comparison with the control treatment T (Table 3). Feeding CO and KO+T diets resulted in a similar proportion of acetate and propionate. The KO diet was associated with the lowest proportion of acetate (P<0.05) and the highest proportions of propionate (P<0.001) and minor VFA (iso-butyrate, valerate and iso-valerate) (P<0.05). CO and KO+T also tended to increase proportions of minor VFA (P<0.10) as compared with T.
Total VFA concentrations and proportions of individual VFA in the rumen samples of bulls on a TMR supplemented (35 g/kg DM) with either beef T, CO, KO or a combination of KO+T
VFA=volatile fatty acid; TMR=total mixed ration; T=tallow; CO=coconut oil; KO=krabok oil.
a–cMeans within a row with different superscripts differ (P<0.05).
+bMeans within a row with different superscripts tend to differ (P<0.10).
* Other VFA include isobutyrate, isovalerate and valerate.
Protozoa
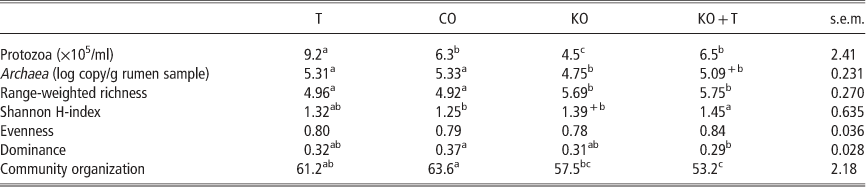
All treatments supplemented with a MCFA source (CO, KO and KO+T) showed a lower number of protozoa than the control treatment (T). Treatments with the same level of MCFA reduced the protozoa numbers to a similar extent (0.17 and 0.15 log units for CO and KO+T, respectively) (Table 4), whereas KO (with the highest levels of MCFA) had the lowest number of protozoa, which represented a decrease by 0.30 log unit compared with the control (T).
Protozoa counts, qPCR of Archaea and diversity and community structure indices of rumen Archaea, on the basis of archaeal DGGE profiles (range-weighted richness, Shannon H-index, eveness, dominance, and community organization) of the rumen samples of bulls on a TMR supplemented (35 g/kg DM) with either beef T, CO, KO or KO+T
DGGE=denaturing gradient gel electrophoresis; TMR=total mixed ration; T=tallow; CO=coconut oil; KO=krabok oil.
a–cMeans within a row with different superscripts differ (P<0.05).
+bMeans within a row with different superscripts tend to differ (P<0.10).
Molecular characterization of Archaea
Quantitative real-time PCR assays showed a decrease in the numbers of Archaea (P<0.05 and P=0.06) when supplementing krabok oil (KO and KO+T) compared with the CO and control treatment (T) (Table 4).
The DGGE profile of the archaeal population in the rumen did not result in a grouping of treatments, nor of animals (Figure 1). This could be caused by inter-animal variation in the methanogenic population. To check this, the DGGE profile of the Archaea present in the rumen when animals received the control treatment (T treatment) is presented (Figure 2). Three main groups of archaeal profiles with differences in predominant bands were observed. This clustering was not determined by the prior treatment (Table 1) and did not represent bull pairs receiving the same treatment sequence (Table 1), suggesting both the washout and the adaptation period, guaranteeing an interval of at least 35 days before rumen sampling, were enough to remove the effect of the prior treatment in the current study.
Cluster analysis of the denaturing gradient gel electrophoresis (DGGE) profile of Archaea present in the rumen of bulls on a total mixed ration supplemented (35 g/kg DM) with either beef tallow (T), coconut oil (CO), krabok oil (KO) or KO+T. To guarantee readability, the reference numbers of ‘bull’ and ‘treatment’ codes were combined when replicates clustered, as indicated by vertical lines next to the profile.
Denaturing gradient gel electrophoresis (DGGE) profile indicates diversity in the rumen archaeal community, despite uniform diet fed to all bulls (total mixed ration supplemented with 35 g/kg DM of beef tallow). Three major clusters can be distinguished, indicated as 1 (grouping bull 7 and 8), 2 (grouping bulls 1, 4 and 5) and 3 (grouping bulls 2, 3 and 6).
To evaluate whether stress, such as the supplementation of a MCFA source provoked shifts in diversity and organization of the archaeal population, irrespective of the inter-animal variation, several indices were calculated from the DGGE profiles (Table 4). Greater differences were observed between KO (KO and KO+T treatments) and CO supplementation than between any of the MCFA treatments and T. The rumen of bulls receiving KO (both KO and KO+T treatments) seemed colonized by a more diverse (based on the range-weighted richness, R r and Shannon index, H) and less-dominated (based on the dominance index and the community organization) archaeal community (Table 4). The latter was also illustrated in the PL curves (Figure 3): in case of CO supplementation, 30% of all bands of the archaeal community accounted for 80% of their cumulative abundance, whereas 40% of all bands were required to cover this level of abundance when supplementing with KO+T.
Pareto–Lorenz distribution curves based on denaturing gradient gel electrophoresis (DGGE) profiles of archaeal communities in the rumen of bulls supplemented (35 g/kg DM) with either beef tallow (T), coconut oil (CO), krabok oil (K) or KO+T. Line A indicates the cumulative band intensity corresponding to a combination of 20% of all the bands for the KO+T treatment (52%). Lines B, C and D indicate the proportion of bands required to cover 80% of the cumulative band intensities for T and CO (30.2%), KO (33.3%) and KO+T (40.0%) treatments, respectively.
Discussion
CO and KO markedly increased propionate proportions (23% to 41%) at the expense of acetate and decreased the numbers of protozoa in the rumen. This is in line with in vitro studies by Panyakaew et al. (Reference Panayakaew, Goel, Lourenço, Yuangklang and Fievez2013), who reported that MCFA supply by CO and KO (0.8 or 1.2mg/ml of incubation fluid) increased the proportion of propionate by 35% to 49%, which was accompanied by an inhibition in methane production of 13% to 38%. Propionate formation is an alternative to H2 formation, which is typically favoured when concentrations of dissolved H2 increase as hydrogen gas formation under these circumstances becomes thermodynamically unfavourable (Janssen, Reference Janssen2010). As the latter is the main energy source of methanogenic Archaea, greater propionate proportions might be indicative of less CH4 formation per unit of rumen-fermented feed (Janssen, Reference Janssen2010).
The number of protozoa decreased by 0.15 to 0.31 log units in the CO and KO supplemented diets compared with the control diet. Defaunating effects of CO have been reported before: for example, a reduction in ciliate protozoa counts of 0.91 and 1.46 log units were reported in sheep when supplementing 35 and 70g/kg DM of CO (Machmüller and Kreuzer, Reference Machmüller and Kreuzer1999). Another study from the same group (Machmüller et al., Reference Machmüller, Ossowski and Kreuzer2000) reported a 0.59 log unit decrease in protozoal numbers when sheep were fed CO at a concentration of 56g/kg DM, which is 1.5 times more than the amount used in our study. A similar supplementation rate (50g/kg DM) to dairy cows, provoked a decrease of 1.05 log units in total protozoa, with a shift in the protozoal community towards Epidinium and Isotricha, whereas Entodinium and Dasytricha seemed more sensitive to CO (Reveneau et al., Reference Reveneau, Karnati, Oelker and Firkins2012).
In their study on the effect of individual fatty acids, Dohme et al. (Reference Dohme, Machmüller, Wasserfallen and Kreuzer2001) suggested C10:0 and C12:0 to provoke an equally effective defaunating effect, whereas C14:0 did not reduce protozoal numbers. However, the supplementation rates of C10:0+C12:0 in the CO treatment were highest (16.8g/kg DM), whereas the KO and KO+T treatments supplied lower amounts of these MCFA (15.3 and 12.6g/kg DM, respectively). Nevertheless, the KO treatment resulted in the strongest effect on protozoal numbers, whereas reductions by the CO and KO+T treatments were similar, which is in line with the total amount of C10:0+C12:0+C14:0 supplemented (Table 1). The latter might suggest C14:0 to be equally effective in reducing protozoal numbers as C10:0 and C12:0 or a supportive effect of C14:0 when combined with C12:0 and C10:0, as has been suggested for ruminal methanogens and methane production (Soliva et al., Reference Soliva, Meile, Hindrichsen, Kreuzer and Machmüller2004).
Cluster analysis on the DGGE profiles of rumen Archaea from bulls monitored in the current study (supplementation of maximum 35g/kg CO or KO) showed no treatment grouping. The result was similar to that of Kongmun et al. (Reference Kongmun, Wanapat, Pakdee, Navanukraw and Yu2011), supplying a somewhat lower dose (26g/kg of CO) to rumen-fistulated swamp buffalo bulls. The latter supplementation rate also did not change the archaeal numbers as assessed by real-time PCR (qPCR). Similarly, in the current study, no change in the archaeal numbers were induced by CO supplementation. Nevertheless, supplementing these levels of KO (35g/kg DM) reduced the archaeal numbers (−0.56 log copies/g rumen contents). Even when reducing the level of krabok oil (KO+T) to supply similar amounts of MCFA as through CO, archaeal numbers tended to be lower (−0.22 log copies/g rumen contents). This would suggest C14:0 to be more powerful in reducing methanogenic numbers than C12:0, as the main difference between KO and CO is its greater C14:0 content. This is in contrast with what has been suggested by Soliva et al. (Reference Soliva, Hindrichsen, Meile, Kreuzer and Machmüller2003 and Reference Soliva, Meile, Hindrichsen, Kreuzer and Machmüller2004), from their in vitro studies using the Hohenheim gas test. They reported a stronger decrease in the number of rumen Archaea with an increasing proportion of C12:0. A 2/1 proportion of C12:0/C14:0 (a ratio which is similar to what is observed for CO) decreased the total archaeal counts by 1.54 log units, whereas a 1/1 ratio (similar to that found in KO) decreased total Archaea by 0.44 log units (Soliva et al., Reference Soliva, Hindrichsen, Meile, Kreuzer and Machmüller2003). In a follow-up study (Soliva et al., Reference Soliva, Meile, Hindrichsen, Kreuzer and Machmüller2004), this was confirmed, although a synergistic effect of C12:0 in combination with C14:0 was suggested, with archaeal numbers being lowest for a C12:0/C14:0 ratio of 4/1 and 3/2. Differences between the two in vitro studies and our study might be related to the nature of the experiment (i.e. in vitro v. in vivo), where in vitro methodology eventually reflects a more acute action, whereas in vivo measurements were taken after at least 2 weeks of supplementation of the MCFA source. Lower (acute) toxicity of C14:0 has been proposed to potentially induce a lag-time in response, which might result in an underestimation of its effectiveness when assessed through batch in vitro incubations (Soliva et al., Reference Soliva, Meile, Hindrichsen, Kreuzer and Machmüller2004).
In the current study, there was no noticeable relationship between the protozoal population, which was affected by both CO and KO, and the archaeal population. Similarly, in the Rusitec study on CO (54g/kg DM) (Dohme et al., Reference Dohme, Machmüller, Estermann, Pfister, Wasserfallen and Kreuzer1999), the decrease in archaeal numbers occured, irrespective of the faunating status (defaunated or faunated) of the rumen inoculum. This could suggest MCFA to act independently on protozoa and methanogens.
As the cluster analysis of DGGE data of the archaeal community did not allow distinction across treatments, we assessed whether treatment affected the diversity of the archaeal community on the basis of measures such as richness (R r and H) and community organization (eveness, dominance and community organization) (Table 4). For all parameters, contrasts were largest between the CO and KO+T treatments, whereas the KO and KO+T treatments did not differ. Richness (R r and H), as assessed from the number of DGGE bands, was increased by KO supplementation, whereas CO supplementation did not change diversity indices. This is in contrast with Pilajun and Wanapat (Reference Pilajun and Wanapat2011), who suggested an increased diversity of methanogens, from their in vivo study on CO (36g/kg DM) supplemented to swamp buffaloes, although no indices were calculated from the DGGE profiles presented in their paper, or at least these were not shown. Furthermore, the archaeal community showed a more dominated structure (greater dominance and community organization) when supplementing CO as compared with KO or KO+T. Increases in dominance and community organization were also shown when supplementing CO in vitro (Patra and Yu, Reference Patra and Yu2013). Nevertheless, a recent in vivo study on dairy cattle fed lauric acid, showed a decrease in the prevalence of Methanobrevibacter, the most predominant Archaea, whereas the prevalence of the less-abundant Methanosphaera increased (Hristov et al., Reference Hristov, Callaway, Lee and Dowd2012). This reduction in dominance within the archaeal community was hypothesized to be linked to strong dereases (about 2 log-units) in protozoal numbers with which Methanobrevibacter might be associated. However, in our study, protozoal numbers were reduced both by CO, KO and KO+T treatments, whereas treatments containing krabok oil (KO and KO+T treatments) showed greater diversity and reduced dominance as compared with the CO treatment. Hence, differences in archaeal diversity and dominance seemed independent of changes in protozoal numbers in our study. Morgavi et al. (Reference Morgavi, Martin, Jouany and Ranilla2012) showed that the DGGE profiles of the rumen methanogenic community only differed between faunated and defaunated animals when protozoa had been removed for more than 2 years, whereas short-term defaunation had not yet provoked changes in the DGGE profiles generated from rumen methanogens. In our study, changes in organization and diversity of the archaeal community seemed to be more linked to reductions in archaeal numbers (provoked only by KO and KO+T treatments) rather than reductions in protozoal numbers (provoked both by CO, KO and KO+T treatments). Obviously, it would be of utmost interest to link changes in microbial community diversity and organization to function (i.e. methane production in this case) in the future, as reduced dominance and larger diversity were suggested to allow methanogens to adapt more easily to different niches (e.g. free-living, particulate associated, ectosymbionts or endosymbionts of protozoa) and fluctuating substrate concentrations (in particular H2) (Attwood et al., Reference Attwood, Altermann, Kelly, Leahy, Zhang and Morrison2011), which might be induced by methane mitigation strategies such as oil supplementation (Janssen, Reference Janssen2010).
Although both in vivo and in vitro research suggested C14:0 to be less effective in modifying rumen metabolism (e.g. Hristov et al., Reference Hristov, Callaway, Lee and Dowd2012), KO, which is particularly enriched in C14:0, seemed to induce shifts in rumen fermentation patterns, protozoal numbers and archaeal abundance, diversity and community structure at lower doses than CO. Further research should elucidate whether KO could be used as a methane mitigation strategy as rumen methanogen numbers do not always seem a key factor determining CH4 production (e.g. Popova et al., Reference Popova, Martin, Eugene, Mialon, Doreau and Morgavi2011).
Conclusions
Both KO and CO supplementation shifted rumen fermentation towards propionate at the expense of acetate and reduced protozoal numbers. However, decreases in archaeal numbers and changes in the diversity and the structure of the archaeal community were limited to the KO supplemented treatments.
Acknowledgements
This experiment was funded by the EU-community (project TH/Asia-Link/014-141-176 and Food-CT-23006-36241, Prosafebeef), Paiwan Panyakaew further received grants from the Rajamangala University of Technology Isan, Thailand and Lotus-Erasmus Mundus Action 2 (EU-South-East Asian mobility project).