Introduction
India is currently the second most populous country in the world, with the population standing at 1.2 billion in 2011 (ORG & Census Commissioner, 2011). India covers about 2.4% of the world’s surface and sustains about 17.5% of its population: every sixth person in the world is an Indian. According to the 2011 census, there were 623 million males and 586 million females in the country, and the population sex ratio was 943 females per 1000 males (ORG & Census Commissioner, 2011). In India, the population sex ratio is the number of females per 1000 males, and the sex ratio at birth is the number of female births per 1000 male births. The population sex ratio in 2011 increased by 10 points from the previous decade and was at its highest since 1971. Although there has been an increase in the population sex ratio in the country, the child sex ratio for the 0–4 year age group has seen a decline, which is alarming. The continuous decline in the child sex ratio from 979 females per 1000 males in 1981 to 924 females per 1000 males in 2011 is a matter of serious concern (ORG & Census Commissioner, 2011). It points to a strong son preference and a sex selection bias for the boy child, because of which there has been an increase in the number of missing girls in India.
Sen (Reference Sen1990) coined the phrase ‘missing women’ to describe this population imbalance and attributed it to sex discrimination. Gender inequality is one of the consequences of sex selection, with preference being given to the birth of a son to that of a daughter. The social and cultural organization of society gives preference to sons as it views them as heirs and assets for old age. Since the 1980s, due to advancements in medical sciences and socioeconomic improvements, the under-five mortality rate in India has decreased, declining from 200 per 1000 live births in 1976 (RGI, 1976) to 39 per 1000 live births in 2016 (RGI, 2016). Faster improvements in child survival since the 1980s, coupled with an increase in female education, has probably reduced the demand for large families. There is some evidence from previous research that with a decline in fertility, the child sex ratio is adversely affected (Mohanty & Rajbhar, Reference Mohanty and Rajbhar2014). This can be explained by the strong son preference in India, which has remained intact over the years. The sex ratio at birth at the national level for the period 2014–16 (3-year average) has been estimated in this way by the Sample Registration System to be 898 females per 1000 males – 902 females per 1000 males in rural areas and 888 females per 1000 males in urban areas. Among the bigger states/union territories, the sex ratio at birth varies from 963 in Chhattisgarh to 832 in Haryana. In rural areas, the highest and the lowest sex ratios at birth are in the states of Chhattisgarh (995) and Haryana (835) respectively. The sex ratio at birth in urban areas varies from 957 in Madhya Pradesh to 820 in Gujarat (RGI, 2016).
The sex ratio at birth is affected mainly by prenatal sex selection, sex-selective abortion and preconception genetic diagnosis (Bongaarts & Guilmoto, Reference Bongaarts and Guilmoto2015). On the other hand, the child sex ratio is affected by the sex ratio at birth, the sex differentials in child mortality and data quality (Bongaarts & Guilmoto, Reference Bongaarts and Guilmoto2015). A significant transition in fertility rates and a decline in child mortality in India have been accompanied by an increased gender imbalance in the child age group over the last four decades. This requires an investigation of the changing child sex ratio in India at both the micro and macro levels. There have been a few attempts to understand the change in child sex ratio in the recent years. However, no previous study has assessed the link between the fertility rate at the micro level and the under-five child sex ratio in India for the 30-year period from 1981 to 2011. The aim of this study was to show the pattern of decline in the child sex ratio in the major states and districts of India from 1981 to 2011 and to examine the determinants of the child sex ratio in the districts using an appropriate panel model.
Methods
Data
The Office of the Registrar General of India and Census Commissioner has been conducting the Indian census every ten years since 1881, the latest having been conducted in 2011. The present study was based on the four successive rounds of the Census of India; that is, 1981, 1991, 2001 and 2011 (ORG & Census Commissioner, 1981, 1991, 2001, 2011). The census collects information on various dimensions such as age–sex composition and type of residence at rural/urban and district levels, socio-cultural aspects (like religion and marital and literacy status), fertility, mortality and migration. The present analysis was based on a sample of 305 districts for which adequately detailed information was available. These districts were located in fourteen of India’s fifteen most populous states. These states comprised 26 districts in 1981 and accounted for 94% of India’s total population (Murthi et al., Reference Murthi, Guio and Dreze1995). The missing state was Assam, where the 1981 census was not conducted. The Census of India atlas provides information about the boundary changes of the districts and its timing over time. The 1981 census districts were used as reference; all the districts that have split in the recent past were merged with their parent districts.
Variables
The main dependent variable was the child sex ratio for the age group 0–4 years. The independent variables considered were Total Fertility Rate (TFR) and Under-Five Mortality Rate (U5MR) as previous micro-level studies have indicated a strong link between declining fertility and child mortality with the child sex ratio in India (Mohanty & Rajbhar, Reference Mohanty and Rajbhar2014). Other controlling factors included in the regression were proportion of urban population in the district, female literacy rate, female work participation rate (FWPR), proportion of Scheduled Caste (SC) population, proportion of Scheduled Tribe (ST) population and region (North, South, Central, East, West).
Estimation of panel data model
A panel data model was used to examine the determinants of the child sex ratio using data from the last four decennial censuses for the districts in the major states of India. The fixed-effects model was used to analyse the panel data set. Panel data models are usually of two types – random and fixed-effects models. The fixed-effects model was chosen because the study’s aim was to control for variables whose effects do not change over time, and variables that are correlated with the variables in the mode may have been omitted. Panel data analysis was conducted using the child sex ratio as a dependent variable for the districts and time-series data for the period 1981–2011.
The equation for the fixed-effects model is as follows:
 $${Y_{it}} = {\beta _i}{x_{it}} + {\alpha _i} + {\rm{ }}{\varepsilon _{it}}$$
where i is district and t is time. Y it is the child sex ratio in the i th district at time t and x it is the set of independent variables of the i th district at time t, β i is the coefficient for the independent variable and ϵ it is the error term. The value α i is specific to district i and captures the district effect. The α values of different districts are independent, have a mean of zero and their distribution is assumed to be not too far away from normality. The fixed-effects model controls for all time-invariant differences between the districts, so the estimated coefficients of the fixed-effects models cannot be biased because of omitted time-invariant characteristics (Torres-Reyna, Reference Torres-Reyna2007).
Results
Trends in the population sex ratio and child sex ratio 1901–2011
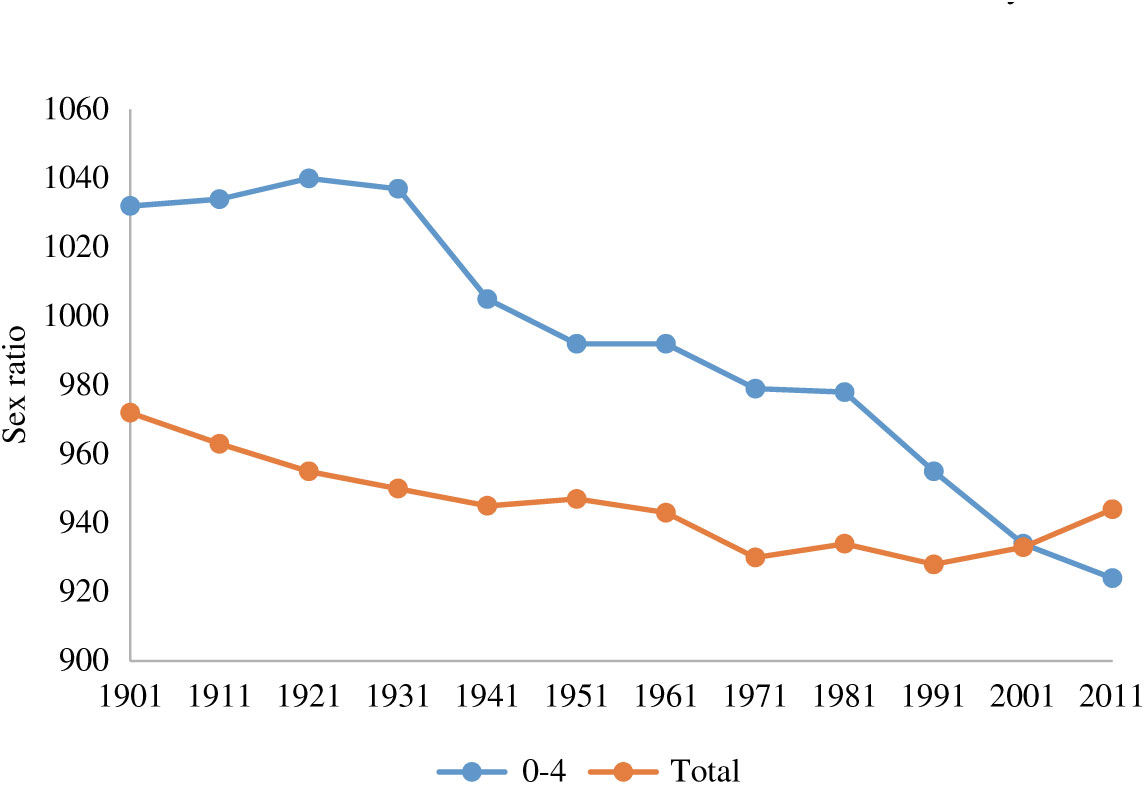
Figure 1 shows the trends in the population sex ratio (total) and child sex ratio (0–4) in India for the years 1901–2011. This shows that the population sex ratio in India declined throughout the twentieth century. During the pre-independence period, from 1901 to 1941, there was a marked decrease in the child sex ratio. This trend continued during the post-independence period. From 1951 to 1971, there was a 16-point decrease in the population sex ratio. After 1971, the trend changed, with the population sex ratio showing a small increase of 4 points from the 1971 to the 1981 census. On the other hand, the child sex ratio decreased by 1 point for the same time period. The population sex ratio increased steadily from 1991 until 2011. However, the child sex ratio declined from 978 females per 1000 males in 1981 to 955 females per 1000 males in 1991. This decade between 1981 and 1991 showed a substantial 23-point decline in the child sex ratio, which was a matter of serious concern at the time. Although, the rate of decline in child sex ratio had reduced in the subsequent censuses, the continuous decline in the child sex ratio remains a matter of concern.
Trends in population sex ratio (total) and child sex ratio (0–4) in India, 1901–2011.

Child sex ratio in the major Indian states 1981–2011
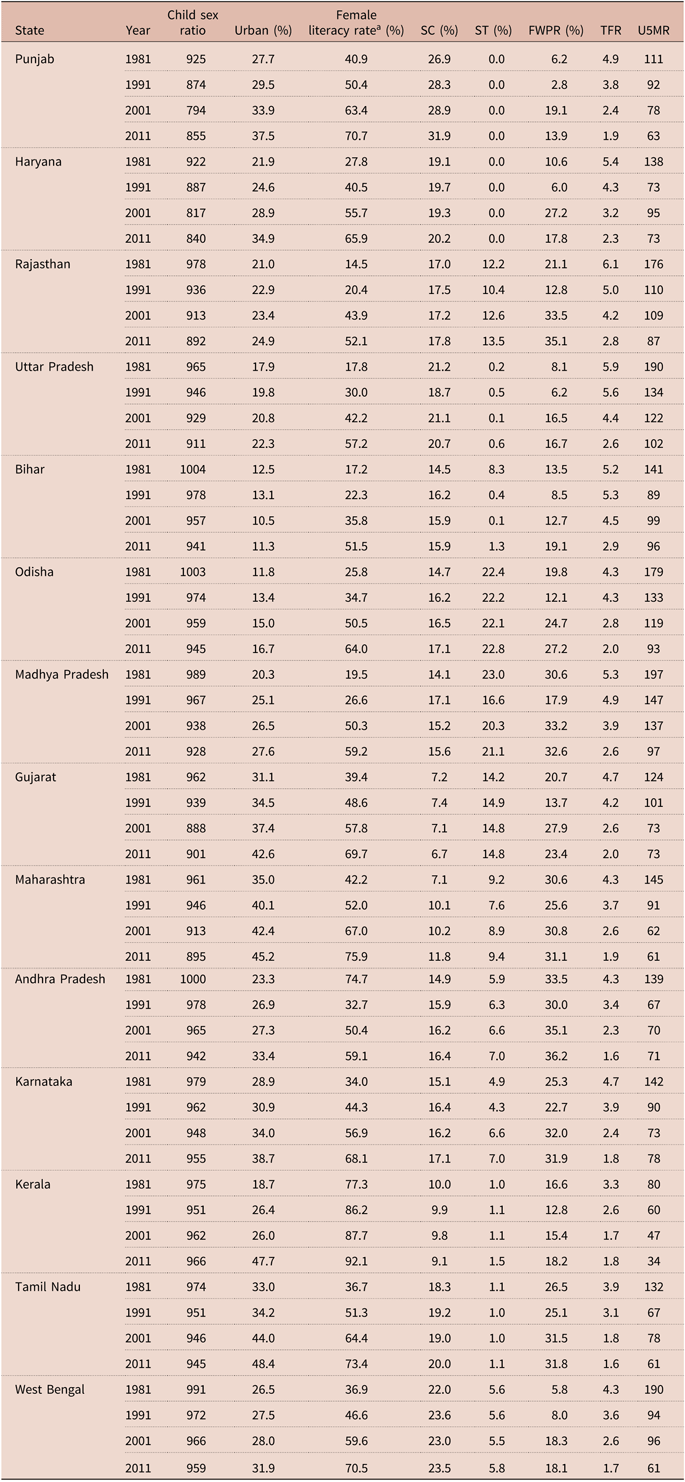
The child sex ratio decreased continuously from 1981 onwards in most of the major Indian states (Table 1). Some states registered a huge decline in the child sex ratio between 1991 and 2001, including Gujarat, Haryana and Punjab, which saw a decline of 51, 70 and 80 points respectively. On the other hand, the state of Kerala showed an increase of 11 points between the years 1991 and 2001, indicating improved conditions for women and a step towards attaining a stronger future for the girl child. A decline of 10 points was observed in India from 2001 to 2011. The rate of decline in the child sex ratio has reduced from one time-point to another, with some states even experiencing an increase during 2001–2011. Punjab (61 points), Haryana (23 points), Gujarat (13 points), Karnataka (7 points) and Kerala (4 points) were the states where the child sex ratio increased from 2001 to 2011. Andhra Pradesh (23 points), Rajasthan (21 points), Maharashtra and Uttar Pradesh (18 points), Bihar (16 points), Odisha (14 points), Madhya Pradesh (10 points), West Bengal (7 points) and Tamil Nadu (1 point) registered significant declines in the child sex ratio over the same period.
Trends in the child sex ratio and fertility and mortality indicators for the major Indian states from 1981 to 2011

ST: Scheduled Caste; ST: Scheduled Tribe; FWPR: Female Work Participation Rate; TFR: Total Fertility Rate; U5MR: Under-5 Mortality Rate.
a Female literacy rate measured as the proportion of females literates out of the total female population.
Child sex ratio and demographic and socioeconomic indicators
Explanations for the observed trends and variations in the child sex ratio have focused on the economic value of women as measured by the Female Work Participation Rate (FWPR). The majority of Indian states have shown an improvement in the FWPR and proportion of urban population over the last four decades. The FWPR fell unexpectedly between 2001 and 2011 by 5.1, 9.4 and 4.5 percentage points, respectively, in Haryana, Punjab and Gujarat. However, Punjab showed an irregular pattern. Other social indicators, such as the proportion of Scheduled Caste and Scheduled Tribe population, did not undergo major changes in the study states over this period. On the other hand, demographic indicators such as fertility and mortality changed significantly. The Total Fertility Rate (TFR) declined rapidly, with some of the states reaching below replacement level, and the Under-Five Mortality Rate (U5MR) declined and nearly reached Sustainable Development Goal-3 levels (i.e. 25 per 1000 live births) in some of the major states. In the most recent census in 2011, the U5MR was lowest in Kerala. However, states like Uttar Pradesh and Bihar continued to exhibit a high TFR and U5MR. Haryana and Punjab had the worst child sex ratios, even with their low TFRs and U5MRs. In the central region of India, Gujarat and Maharashtra reached below replacement level fertility but the child sex ratio was more favourable for males. In West Bengal, the TFR reduced from 4.3 in 1981 to reach below replacement level in 2011 and the U5MR also reduced sharply from 1981 to 2011. A similar decreasing pattern was observed for the child sex ratio in West Bengal for the same time period. A similar pattern was observed in Andhra Pradesh, which registered a significant decline in fertility and child sex ratio from 1981 to 2011.
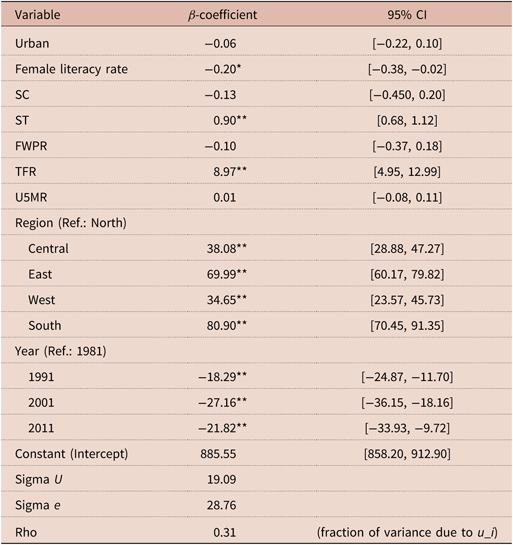
An aggregate state-level analysis clearly points to a relationship between the TFR and the child sex ratio in India. To test the impact of the TFR on child sex ratio at the micro level, a panel fixed-effects regression model was used based on district-level information on child sex ratio and TFR from 1981 to 2011, along with other demographic, socioeconomic and regional predictors. Panel fixed-effects regression was performed pooling observations for all the census years together in one model and keeping ‘year’ as an independent variable. Table 2 shows the results of the model. Over the period, there was a significant reduction in the child sex ratio, even after controlling the other predictors. Compared with the year 1981, the child sex ratio decreased by 18 points in the year 1991, by a high of 27 points in the year 2001, and by 22 points in 2011. Table 2 shows that the TFR was significantly and positively associated with the child sex ratio, even after controlling for other socioeconomic predictors and time. With an increase in the TFR by one child, the child sex ratio increased by 8.6 points. This relationship clearly indicates that the districts with higher fertility had higher child sex ratios. It was also observed that all regions (Central, East, West and South) had significantly higher child sex ratios compared with the North region. The proportions of urban population, female literacy level and the female work force participation rate were negatively related to the child sex ratio and the proportion of Scheduled Tribe population remained a positive predictor of the child sex ratio in the panel model.
Panel regression fixed-effects model for the child sex ratio of the districts of the major Indian states, 1981–2011

ST: Scheduled Caste; ST: Scheduled Tribe; FWPR: Female Work Participation Rate; TFR: Total Fertility Rate; U5MR: Under-5 Mortality Rate.
**p < 0.01; *p <0.05.
Discussion
The child sex ratio reflects prenatal as well as postnatal sex selection and is thus an important indicator of trends in sex selection. A closer examination of the sex ratio at birth in India shows a major decline from 1996–98 to 2012 clearly favouring males at birth. Although the sex ratio at birth declined from 1996–98 to 2010, it remained clearly favourable for males in 2010, reflecting a social environment favouring boys over girls. In recent decades, the decline in fertility has created even greater pressure on parents to go for sex selection, as they want at least one son for their future assistance. This study aimed to highlight the role of fertility on the child sex ratio in the major states of India in the 30-year time period from 1981 to 2011.
The large extent of missing girls in India is evident from this study. The child sex ratio showed a major decline from 1981 to 2011 in the country as a whole and in all the major states. However, the situation improved in the decade from 2001 to 2011 compared with the decade preceding 2001. While the child sex ratio decreased by 10 points for the country as a whole, it improved in some of the major states. It showed a declining trend in the large major states of Bihar, Uttar Pradesh, Rajasthan, Orissa, Maharashtra, Madhya Pradesh and West Bengal.
The panel regression model, covering district-level information for the 30-year time period from 1981 to 2011, shows that the TFR is a significant predictor of the child sex ratio in India. The TFR has been shown to be strongly associated with son preference and sex ratios (Diamond-Smith & Bishai, Reference Diamond-Smith and Bishai2015). As people choose to have fewer children, they are under greater pressure to have children of their preferred gender within a narrower time window (Guilmoto, Reference Guilmoto2009). Fertility has been declining rapidly in India, heightening son preference because families are more pressurized to have their desired number of sons as soon as possible (Basu, Reference Basu1999). One major component of the motivation for sex selection relates to fertility decline and its impact on the sex composition of children in a family (Guilmoto, Reference Guilmoto2009). The desired sex composition changes with the decline in fertility, leading to an imbalance in the child sex ratio. At a family size of one, the vast majority of people want that child to be a son, but at a family size of two, having one daughter and one son is preferable to having two sons. The preference for more sons reduces with increase in family size. This suggests that son preference is not driven primarily by considerations such as the low earning capacity of girls or dowry (Jayachandran, Reference Jayachandran2017). Due to the social and cultural preference for sons as heirs and assets for old age, the number of males has increased and created the social problem of ‘missing girls’. Declining fertility has resulted in a more male-biased sex ratio mainly due to son preference remaining persistent and sex-selection technology becoming easily accessible. Selective abortion of female fetuses following a first-born girl has increased substantially in India. Most of India’s population now lives in states where selective female abortion is common (Jha et al., Reference Jha, Kesler, Kumar, Ram, Ram and Aleksandrowicz2011).
Overall, this study points towards a serious need to make and maintain continuous efforts to improve the child sex ratio in India and its major states. Studies have shown that the serious efforts that have been made towards improving the sex ratio at birth and the child sex ratio in India have been effective (Das Gupta et al., Reference Das Gupta, Zhenghua, Bohua, Zhenming, Chung and Hwa-Ok2003). Efforts have been made to bring about gender equality, including equal laws for property ownership and equal employment opportunities. Various approaches have been followed in order to reduce sex selection, such as awareness generation in a society in favour of the female child, cash incentive programmes for girls, and prevention of sex-selective abortion (Jejeebhoy et al., Reference Jejeebhoy, Basu, Acharya and Zavier2015). Various state governments have made different efforts to solve the problem of a male-biased child sex ratio, which in turn have helped to improve the population sex ratio. However, these programmes need to be implemented for a longer duration in order to make a difference. Further research is needed to inform the development of policy actions to prevent sex-selective abortions and stop the child sex ratio becoming more skewed in India as a whole and in the states individually.
Funding
The authors received no funding for this study.
Conflicts of Interest
The authors declare that they have no competing interests to declare.
Ethical Approval
The dataset used in this study is available in the public domain.