Introduction
During car driving, a driver must continuously adapt his behavior to the current task demands, taking into account his own capacities. This adaptive process becomes especially evident when a driver is challenged by internal (e.g. cognitive performance) or external (e.g. bad road conditions, complex driving situation) factors. Driving-relevant cognitive impairment becomes more prevalent with increasing age (Aksan et al., Reference Aksan, Anderson, Dawson, Johnson, Uc and Rizzo2012), creating the need for behavioral adaptations aimed at reducing the risk while driving. Others have shown that it is possible to reduce traffic-related risks associated with declining skills by adapting one's behavior in a risk-reducing way (De Raedt and Ponjaert-Kristoffersen, Reference De Raedt and Ponjaert-Kristoffersen2000). Therefore, driving-related behavioral adaptations represent an important factor that influences older drivers’ traffic-related risk and has to be taken into consideration when it comes to evaluate cognition and fitness to drive in older drivers.
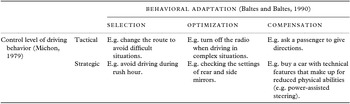
Baltes and Baltes (Reference Baltes, Baltes, Baltes and Baltes1990) conceptualized the “selective optimization with compensation”-model (SOC-model) to describe how individuals adapt their behavior when facing declining skills. In the context of driving and older drivers, the SOC-model has proved a useful theoretical framework in different contexts, e.g. to characterize changes in behavior after attending a driver education program (Nasvadi and Vavrik, Reference Nasvadi and Vavrik2007) or to describe the process of older drivers retiring from the road (Pickard et al., Reference Pickard, Tan, Morrow-Howell and Yunkyung2009). According to the SOC-model, there are three different adaptive processes: selection, optimization, and compensation. Selection designates the abandonment of goals and situations that exceed one's capacities and the adoption of new goals that lie within one's reach, e.g. avoiding driving during rush hours. Optimization indicates the improvement and optimal allocation of existing resources and skills, e.g. reducing distraction by conversations. Compensation refers to the acquisition and use of new methods and resources for reaching one's desired goals, e.g. getting a car with supporting features like power-assisted steering. The SOC-model, therefore, offers a useful framework to categorize different approaches to reduce traffic-related risks when facing constraints as drivers age (Table 1).
Types of behavioral adaptations on different control levels

Adaptation behaviors can be further subdivided according to their temporal relation to the driving-task (Michon, Reference Michon1979): Some actions and decisions are taken prior to driving (strategic level), while others occur during the drive itself (tactical level). Examples for decisions on the strategic level are which route to follow or not to drive during rush-hours. The tactical level includes decisions about speed, overtaking manoeuvers or whether to engage in distracting activities such as listening to the radio.
There is quite some research investigating driving-related behavioral adaptations of older drivers (Marottoli et al., Reference Marottoli, Ostfeld, Merrill, Perlman, Foley and Cooney1993; Hakamies-Blomqvist, Reference Hakamies-Blomqvist1994; De Raedt and Ponjaert-Kristoffersen, Reference De Raedt and Ponjaert-Kristoffersen2000; Baldock et al., Reference Baldock, Mathias, Mclean and Berndt2006; Trick et al., Reference Trick, Toxopeus and Wilson2010). Most studies in this field focus mainly on selection, finding that older drivers reduce the number of driving trips, avoid situations like driving in the dark and during rush hours, and tend to drive more slowly (Marottoli et al., Reference Marottoli, Ostfeld, Merrill, Perlman, Foley and Cooney1993; Hakamies-Blomqvist, 1994; Baldock et al., Reference Baldock, Mathias, Mclean and Berndt2006; Pickard et al., Reference Pickard, Tan, Morrow-Howell and Yunkyung2009). The focus on selection implies a loss-centered view on older drivers’ driving abilities, neglecting the possibility to optimize existing resources or to compensate for declining skills.
With regards to gender differences, research focused mainly on older age groups, finding consistently that older females tend to adopt more behavioral adaptations than older males (Charlton et al., Reference Charlton2006; D’Ambrosio et al., Reference D’Ambrosio, Donorfio, Coughlin, Mohyde and Meyer2008; Molnar and Eby, Reference Molnar and Eby2008). It is well known that females of any age group, on average, tend to be more risk-avoiding in a variety of situations ranging from health choices (Rieker and Bird, Reference Rieker and Bird2005) to investment strategies (Hardies et al., Reference Hardies, Breesch and Branson2013) and driving (Harré, Reference Harré2000; Windsor et al., Reference Windsor, Anstey and Walker2008). When it comes to driving, according to traffic accident statistics women are far less likely to be involved in crashes caused by risky driving-manoeuvers (Lourens et al., Reference Lourens, Vissers and Jessurun1999) and driving under the influence of alcohol (Fu, Reference Fu2008), so differences in behavioral adaptations aimed at reducing the risk while driving may be expected.
The first aim of the present study was to create a questionnaire to assess driving-related behavioral adaptations aimed at reducing the risk while driving, with a focus on older drivers. The second aim was to explore age and gender differences using the newly developed questionnaire. For this purpose, the SOC-model (Baltes and Baltes, Reference Baltes, Baltes, Baltes and Baltes1990) was used to generate items describing driving-related behavioral adaptations on the tactical and the strategic level (Michon, Reference Michon1979). This approach was adopted as a rationale in order to make sure that all possible aspects of driving-related behavioral adaptations were considered and was not assumed as to be predictive for the factors underlying the items of the questionnaire. Since self-reports of behavior, as assessed in a questionnaire, are easily biased by socially desirable responding or stereotypes (Lajunen and Summala, Reference Lajunen and Summala2003), items were created in a way to reduce biased responses. The questionnaire was administered to a mixed-gendered sample of older and younger drivers. In this pilot study, we focused on cognitively healthy drivers.
Methods
Participants
Ninety-two adults were recruited by advertisements in local newspapers. The sample included 31 participants younger < 65 years (16 women, 15 men; mean age = 30.5 years; SD = 6.3; age range 23–55) and 61 participants ≥ 65 years (30 women, 31 men; mean age = 70.2 years, SD = 5.5 years; age range 65–87 years). Participants were required to hold a driver's license for at least 5 years and to have been driving during the last two years. Exclusion criteria for the study were cognitive impairment (montreal cognitive assessment (MoCA) score < 27, Nasreddine et al., Reference Nasreddine2005), visual impairment (corrected far visual acuity < 0.5 degrees, near visual acuity < 0.8), or significant motor impairment (timed-up-and-go test > 12 s, Bischoff et al., Reference Bischoff2003). The study was carried out in accordance to the declaration of Helsinki and was approved by the local ethics board of the Canton Bern. The written informed consent was obtained from all participants prior to inclusion. No compensation was provided for participation.
Driving behavior adaptations questionnaire DBAQ
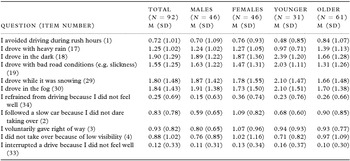
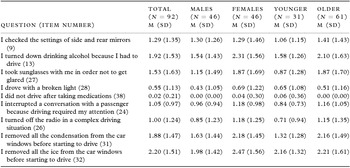
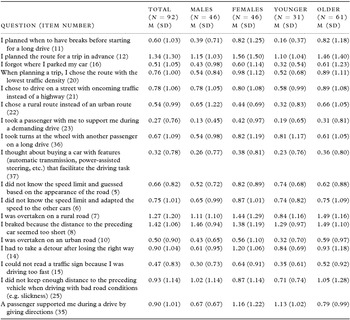
To evaluate behavioral adaptations, a questionnaire (driving behavior adaptations questionnaire, DBAQ) was created. In order to assess all relevant aspects of driving-related behavioral adaptations, item generation was informed by the SOC-model (Baltes and Baltes, Reference Baltes, Baltes, Baltes and Baltes1990) applied to the strategic and tactical level (Michon, Reference Michon1979) (Table 1). A review of the literature on differences in driving-related behavior between younger and older drivers was performed. Findings that referred to risk-reducing behavioral adaptations (Hakamies-Blomqvist, 1994; De Raedt and Ponjaert-Kristoffersen, Reference De Raedt and Ponjaert-Kristoffersen2000; Baldock et al., Reference Baldock, Mathias, Mclean and Berndt2006) were categorized according to our theoretical framework and adapted to be included in the questionnaire. Questions in English were translated to German. Items were phrased in a neutral way, in order not to evoke biased answers due to social-desirability or stereotypes. For example, instead of asking whether a person drives slowly, she was asked how often she gets overtaken by other cars. The resulting questionnaire contained 38 items. The questions referring to different kinds of behavioral adaptations (i.e. selection, optimization, compensation) and levels of control (i.e. strategic, tactical) were randomly ordered within the questionnaire (Tables 2–4). The distribution between the categories explained in Table 1 was as follows: seven items for strategic selection and four item for tactical selection (Table 2); five items for strategic optimization and four items for tactical optimization (Table 3); nine items for strategic compensation and nine items for tactical compensation (Table 4). Different quantities of items in the single categories are inherent to the different types of adaptations under consideration. For example, there are more situations that can be avoided (selection) than there are ways to improve available resources (optimization). Respondents had to indicate for each item, how often they showed the behavior under consideration in a given period of time (e.g. during the last two weeks). A five-point Likert scale ranging from “never” (0) to “more than ten times” (4) was used to register the frequency. The administration of the questionnaire took about 12 min. The questionnaire was administered in German (English translation of the items in Tables 2–4). To ascertain clarity of the items and the scale, a first version of the questionnaire was administered in a pilot test to a sample of 15 young drivers (9 women, 6 men; mean age = 26.4 years; SD = 2.3; age range 23–32) and then revised accordingly.
Descriptive statistics (mean, standard deviations) for the items of the questionnaire regarding strategic and tactical selection

The frequency of the described behaviors was indicated by the participants on a five-point Likert scale ranging from “never” (0) to “more than ten times” (4) in a given period of time. The item number indicates the position of the item in the questionnaire.
Descriptive statistics (mean, standard deviations) for the items of the questionnaire regarding strategic and tactical optimization

The frequency of the described behaviors was indicated by the participants on a five-point Likert scale ranging from “never” (0) to “more than ten times” (4) in a given period of time. The item number indicates the position of the item in the questionnaire.
Descriptive statistics (mean, standard deviations) for the items of the questionnaire regarding strategic and tactical compensation

The frequency of the described behaviors was indicated by the participants on a five-point Likert scale ranging from “never” (0) to “more than ten times” (4) in a given period of time. The item number indicates the position of the item in the questionnaire.
Statistical analysis
Appropriateness of performing a factor analysis on the set of data was confirmed by the Bartlett's test for sphericity (χ 2 = 2,065.8, p < 0.001) and the Kaiser–Meyer–Olkin measure of sampling adequacy (0.71). A factor analysis (principal component analysis with varimax rotation) was then calculated to extract the factors of the questionnaire and determine their properties. Since only one person reported not having driven after taking medication, this item was excluded from the factor analysis because of its too small variance. The reliability (internal consistency) of the extracted factors was calculated using Cronbach's α. To build the total score of a factor, scores of the individual items included in the factor were summed up. Group differences on global scores were calculated using Student's (equal variances) or Welch's (unequal variances) t-Test. Because of the high number of group comparisons on the level of single questionnaire items, corrections for alpha-errors (family-wise errors) seemed appropriate. Therefore, global age and gender effects on the items of the questionnaire were explored by submitting item scores to a multivariate analysis of variance (MANOVA) with age (younger, older) and gender (male, female) as between-subjects factors. Homogeneity for between-subjects analyses was tested with Box's M-test and normal distribution was tested with Shapiro–Wilk test. In case of significant omnibus effects in the MANOVA, group differences were then explored using univariate analysis of variance (ANOVA) with age (younger, older) and gender (female, male) as between subjects-factors. Homogeneity of variances for the ANOVA was tested with the Levene test. For variables that did not meet the conditions for MANOVA or ANOVA, groups were compared using Mann–Whitney U-Test. Critical p-values were corrected using the Bonferroni procedure. Reported p-values are two-sided. A p-value < 0.05 was considered as to indicate statistical significance, unless a Bonferroni-correction was applied. SPSS software (version 20) was used for statistical analyses.
Results
Factor analysis of questionnaire items
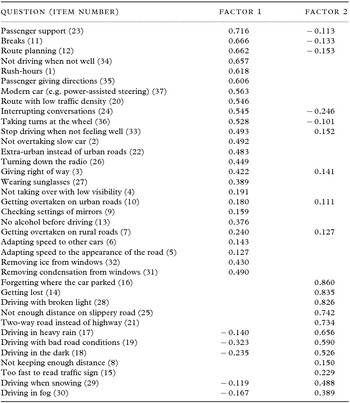
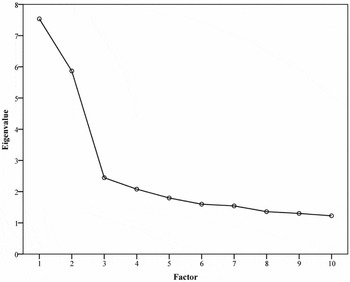
Items were then submitted to a factor analysis (principal component analysis with varimax rotation). The result of this analysis as indicated by the scree test (figure 1) was a two factor solution that explained 36.2% of the total variance. Factor loadings (rotated solution) for the 37 items are presented in Table 5. Factor loadings < 0.1 are omitted for clarity.
Factor loadings (rotated solution) for the two factors of the DBAQ

Item numbers denote the item position in the questionnaire. Factor loadings < 0.1 are omitted for clarity.
Scree plot for the first ten factors extracted from the DBAQ. Factor 1 includes items that describe behaviors aimed at reducing the risk while driving. Factor 2 includes items that describe behaviors that increase the risk while driving.

The first factor had an eigenvalue of 7.5 and consisted of 24 items. Its internal consistency (Cronbach's α) was 0.89. A content analysis of the items showed that it mainly included items concerning the driver himself, the vehicle or choices regarding the route. Namely, it included all items that describe actions aimed to make optimal use of one's physical and mental abilities by removing disturbing factors, e.g. wearing sun-glasses to reduce glare, checking the setting of side and rear mirrors, freeing the car windows completely from ice and condensation, turning off the radio in complex traffic situations, not driving after the consumption of alcohol or when not feeling well. Strategic measures to avoid complex and risky routes also loaded high on this factor, e.g. choosing a route with low traffic density, avoiding driving on in inner-cities. Measures taken before starting or during the drive to compensate for physical or mental deficits as a driver (e.g. getting tired, not being able to process information fast enough, not having enough physical strength) are also included in this factor, e.g. driving slowly, having a passenger to give directions, planning breaks in advance, taking turns at the wheel with a passenger, having a car with features that physically facilitate the driving task (power-assisted steering, etc.).
The second factor included 13 items with an eigenvalue of 5.9 and an internal consistency (Cronbach's α) of 0.87. Participants who scored high on this factor did not apply any kind of behavioral adaptations when facing dangerous or difficult driving conditions that are beyond the person's own control, e.g. weather, road conditions. On a strategic level, participants with high scores on this factor used to drive even in heavy rain, snow, fog and in the dark. On a tactical level, participants scoring high on this factor, for example, did not pay attention to keeping enough distance to the preceding vehicle when driving on slippery roads, they preferred driving on streets with oncoming traffic rather than on safer highways, and they did not adapt their speed according to visibility conditions or requirements of the driving task.
As expected, there was no correspondence between the categories in our model shown in Table 1 and the two factors resulting from the factor analysis.
Age differences in behavioral adaptations
Comparison of the total score of the two factors revealed significantly higher scores for older drivers than for younger drivers on the risk-reducing factor 1 (t(84.5) = 2.21, p = 0.013) but no age differences for the risk-increasing factor 2 (t(90) = 0.29, p = 0.776).
To investigate which specific behaviors the groups differ on, a MANOVA was calculated. The omnibus effect for age was significant (Pillai-Spur = 0.43, F(13, 77) = 4.52, p < 0.001), allowing subsequent analyses of the single items. Between-subjects analyses on the level of single items showed that younger and older participants differ with regards to several of the behaviors described. As for the items associated with the risk-reducing factor 1, older participants reported being overtaken more often, which indicates that they drive more slowly than younger participants (F(1, 89) = 6.73, p = 0.011). When going on a longer trip, older participants planned more often in advance when to have breaks (U(31, 61) = 1,267.5, p = 0.002). They also took their sun-glasses with them more often than young participants in order not to get glared (U(31, 61) = 1,247.5, p = 0.009) and made sure that the car window be completely free from ice and condensation (F(1, 89) = 7.62, p = 0.007).
Although the total score of the risk-increasing factor 2 did not differ between age groups, there were some differences in specific behaviors included in this factor. Younger participants reported significantly less avoidance of driving in the dark (F(1, 89) = 6.93, p = 0.010) and with bad road conditions (U(31, 61) = 598.0, p = 0.003) than older participants.
Gender differences in behavioral adaptations
A t-Test for independent samples revealed significant gender differences for the risk-reducing factor 1, with females showing significantly more behaviors aimed at reducing the risk while driving (t(90) = 2.52, p = 0.014). No gender differences were found for the risk-increasing factor 2 (t(90) = 0.45, p = 0.656).
To explore differences in specific behaviors, single item scores were first submitted to a MANOVA and significant global gender differences were found (Pillai-Spur = 0.29, F(13, 77) = 2.39, p = 0.010). Subsequent between-subjects analyses on the level of single items revealed significant gender differences for several behavioral adaptations. Among the items associated with the risk-reducing factor 1, females preferred more often than males following a slow-travelling car rather than performing a risky take-over manoeuver (F(1, 89) = 9.79, p = 0.002). When planning a trip, females chose the route with the lowest traffic density more often than males did (F(1, 89) = 7.90, p = 0.006). Females also restricted their alcohol consumption before driving more than males (F(1, 89) = 6.32, p = 0.014). As for the items of the risk-increasing factor 2, only the frequency of “having to take a detour after losing the right way” differed between gender groups, with females reporting losing the right way more frequently (U(46, 46) = 1,458.5, p = 0.001).
Discussion and conclusions
In the present study, the DBAQ was created and tested in a mixed-gender sample of older and younger participants to explore age and gender differences in driving-related behavioral adaptations. Item generation followed a theory-driven approach (Michon, Reference Michon1979; Baltes and Baltes, Reference Baltes, Baltes, Baltes and Baltes1990) and biasing influences of stereotyping and impression management were avoided if possible (Lajunen and Summala, Reference Lajunen and Summala2003). Two independent factors were extracted from the questionnaire. The first factor included behaviors aimed at actively reducing the risk while driving, the second factor included items that described the lack of behavioral adaptations when facing dangerous or complex situations. The two factors had high reliability (Cohen, Reference Cohen1988).
Group comparisons revealed significant age and gender differences in behavioral adaptations. Older drivers scored significantly higher on the risk-reducing factor 1, indicating that they showed risk-reducing behaviors more frequently than younger drivers. No difference was found for the risk-increasing factor 2. Group comparisons on the level of specific behaviors revealed that older participants took more measures to make their trips less physically and cognitively demanding. In line with the existing literature (Hakamies-Blomqvist, 1994; Baldock et al., Reference Baldock, Mathias, Mclean and Berndt2006), older drivers reported selecting their driving exposure in order to avoid risky situations (e. g., driving in the dark, with bad road conditions) more often than younger drivers. Before starting for a trip, they planned when to have breaks in order to compensate for reduced forces. They also reported driving more slowly. Driving with slower speed than younger drivers is a known compensatory behavior adopted by older drivers (Hakamies-Blomqvist et al., Reference Hakamies-Blomqvist, Mynttinen, Backman and Mikkonen1999; Trick et al., Reference Trick, Toxopeus and Wilson2010) that has not been corroborated in a study based on self-reports so far. Existing studies on behavioral adaptations focused mainly on selection, neglecting optimization, and compensation (Hakamies-Blomqvist, 1994; Baldock et al., Reference Baldock, Mathias, Mclean and Berndt2006; Trick et al., Reference Trick, Toxopeus and Wilson2010). This approach implies a loss-centered view on older drivers’ driving abilities. Our findings show that older drivers do use behavioral adaptations aimed at optimizing existing resources and compensating for existing deficits more than younger drivers. This highlights the possibility to make up for existing deficits, allowing for a resource-oriented view on older drivers’ driving abilities. Results also indicate that with a questionnaire like the DBAQ possibilities for improvement in behavioral adaptations of older drivers can be identified. In this study, no older participant reported not driving after taking medications, although about 20% of community-dwelling people over 65 years of age take psychotropic medication (Aparasu and Mort, Reference Aparasu and Mort2004; Naughton et al., Reference Naughton, Bennett and Feely2006) and research consistently supports an increased risk of crashes for older drivers taking psychotropic medications (Lococo and Staplin, Reference Lococo and Staplin2006). However, the item that was used in this questionnaire (“I did not drive after taking medications”) is difficult to interpret since some medication potentially impairs driving (i.e. psychotropic medications, some pain killers), while others may enable safe driving (e.g. medication for epilepsy, to treat diabetes). Furthermore, most medications are used to alleviate symptoms (e.g. of depression or diabetes) potentially interfering with driving performance. We therefore, propose to modify the item to “I did not drive after taking medications, which impair driving performance.”
The comparison of women and men also revealed differences in behavioral adaptations, with women showing more behaviors described by items included in the risk-reducing factor 1. When planning a trip, females avoided complex traffic situations more often than men and turned down drinking alcohol more often than men when they had to drive. On a tactical level, women reported more frequently compared to men avoiding risky driving maneuvers. Again, no overall differences were found in questions included in the risk-increasing factor 2. These findings confirm very well the picture that emerges from traffic accident statistics and related research. For example, Fu (Reference Fu2008) analyzed traffic accident statistics and found male gender to be a major risk factor for driving under the influence of alcohol. Lourens et al. (Reference Lourens, Vissers and Jessurun1999) reported significantly more violations due to risky driving manoeuvers for males. These gender differences found with data from sources that are not based on self-reports (i.e. road traffic statistics) are also reflected in the results of the DBAQ. Therefore, the DBAQ seems to be able to capture relevant differences in driving-related behavioral adaptations. This is especially important, since the DBAQ is based on self-reported behavior and, therefore, answers are easily biased by socially desirable responding, impression management or stereotypes (Lajunen and Summala, Reference Lajunen and Summala2003). As our results suggest, these response tendencies can be reduced by adequate phrasing of questions.
An interesting question is whether the behavioral adaptations assessed in this study are the consequence of an accurate awareness of one's capacities and limitations or rather the result of lifestyle changes (e.g. retirement). In this study, we did not assess underlying motives for behavioral adaptations or subjective driving skills, but findings from studies on the relationship between self-awareness (Marottoli et al., Reference Marottoli and Richardson1998; Freund et al., Reference Freund, Colgrove, Burke and McLeod2005; MacDonald et al., Reference MacDonald, Myers and Blanchard2008; Ross et al., Reference Ross, Dodson, Edwards, Ackerman and Ball2012), actual driving skills (Eby et al., Reference Eby, Molnar, Shope, Vivoda and Fordyce2003; Molnar et al., Reference Molnar and Eby2008; Okonkwo et al., Reference Okonkwo, Crowe, Wadley and Ball2008), and self-regulation (De Raedt and Ponjaert-Kristoffersen, Reference De Raedt and Ponjaert-Kristoffersen2000; Stalvey et al., Reference Stalvey and Owsley2000; Baldock et al., Reference Baldock, Mathias, Mclean and Berndt2006; Charlton et al., Reference Charlton2006; Molnar et al., Reference Molnar and Eby2008; Okonkwo et al., Reference Okonkwo, Crowe, Wadley and Ball2008) can contribute to answer this question. It is well established that older drivers tend to restrict their driving (e.g. avoidance of drives at night or with bad weather conditions) (Hakamies-Blomqvist et al., Reference Hakamies-Blomqvist, Wiklund and Henriksson2005; Langford et al., Reference Langford and Koppel2006; Vance et al., Reference Vance, Roenker, Cissell, Edwards, Wadley and Ball2006). These findings are in line with the age differences that emerged from our study. However, studies of Bhatti et al. (Reference Bhatti2008), Jette et al. (Reference Jette and Branch1992), and Stalvey et al. (Reference Stalvey and Owsley2000) indicate that these behavioral adaptations are not always primarily aimed at reducing risks, but sometimes rather a consequence of lifestyle changes (e.g. less work-related driving), and that situations that are avoided most frequently (e.g. parallel parking) are not necessarily the ones with highest risks for serious crashes or physical harm (Baldock et al., Reference Baldock, Mathias, Mclean and Berndt2006; Donorfio et al., Reference Donorfio, D’Ambrosio, Coughlin and Mohyde2008; Molnar et al., Reference Molnar and Eby2008).
The aim of this study was to explore age and gender differences in behavioral adaptations with the newly created DBAQ following a theory-driven, systematic approach. The focus lay on the specific situation of older drivers. Participants in this study were all cognitively unimpaired, so reported findings may not yet be generalized to other groups, such as persons with cognitive impairment or dementia. As impaired patients are an important target group for the assessment of risk-reducing behavioral adaptations, this will be addressed in future studies. The questionnaire shows good consistency with existing research and is ready for use in further research to address the limitations of the present study (e.g. limited sample size, cross-sectional data). Of special interest is the relationship between behavioral adaptations and indicators of real driving (e.g. crashes, fines, violations) in older drivers, which will be addressed in future studies. Focusing not on deficits but on ways to cope with deficits, enables a more resource-oriented approach in the evaluation of selection, optimization, and compensation in older drivers.
Conflict of interest
None.
Description of the author's roles
All authors contributed to the research questions and study design. The study was carried out and the data were analyzed by the first author. The manuscript was written and revised as a collaboration of all authors.