



1. Introduction
Particle transport in channel flow of Newtonian and non-Newtonian fluids has been widely studied because of its importance in many industrial and biological applications. Depending on the flow conditions, inertial effects, proximity of the channel wall, fluid elasticity, shear-thinning, particle deformability and particle–particle interactions may affect the dynamics of the particle motion and the flow field. Interplay between these effects result in various interesting phenomena, such as cross-streamline particle migration (Segré & Silberberg Reference Segré and Silberberg1961), particle focusing at the channel centreline (Kang et al. Reference Kang, Lee, Hyun, Lee and Kim2014; Lim et al. Reference Lim, Ober, Edd, Desai, Neal, Bong, Doyle, McKinley and Toner2014a ), wall-surface accumulation of particles (Karnis & Mason Reference Karnis and Mason1966; Gauthier, Goldsmith & Mason Reference Gauthier, Goldsmith and Mason1971), self-assembly of two particles (Lee et al. Reference Lee, Amini, Stone and Di Carlo2010) and the particle-induced lateral transport of the fluid (Amini et al. Reference Amini, Sollier, Weaver and Di Carlo2012). These phenomena have been successfully used for the manipulation of cells and particles suspended in microfluidic platforms.
The two most important dimensionless parameters characterizing the problem are the flow Reynolds number and the Weissenberg number, quantifying inertia and elasticity effects, respectively. The flow Reynolds number is defined as
 $Re={\it\rho}U_{c}H/{\it\mu}$
, where
 $U_{c}$
is the characteristic flow velocity, such as the velocity at the channel centreline,
 $H$
is the characteristic length scale in the channel cross-sectional plane,
 ${\it\rho}$
is the fluid density and
 ${\it\mu}$
is the fluid zero-shear viscosity. The flow Weissenberg number is defined as
 $Wi={\it\lambda}U_{c}/H$
, where
 ${\it\lambda}$
is the relaxation time of the fluid. The ratio between these two parameters gives the elasticity number
 $El=Wi/Re={\it\lambda}{\it\mu}/{\it\rho}H^{2}$
, which only depends on the channel dimension and fluid properties. Other important parameters include the geometry of the channel, the strength of the shear-thinning effect, the initial position of the particle and the blockage ratio defined as
 $d/H$
, where
 $d$
is the particle diameter.
Cross-streamline migration of particles was first observed in a Newtonian fluid (
 $El\,=\,Wi\,=\,0$
) by Segré & Silberberg (Reference Segré and Silberberg1961). In a tube flow, initially randomly distributed particles gradually focus into a narrow annulus at around 0.3 diameter, resulting in the ‘tubular pinch’ effect. This phenomenon was later confirmed in several experimental (Karnis, Goldsmith & Mason Reference Karnis, Goldsmith and Mason1966; Matas, Morris & Guazzelli Reference Matas, Morris and Guazzelli2004) and analytical (Schonberg & Hinch Reference Schonberg and Hinch1989) and numerical (Feng, Hu & Joseph Reference Feng, Hu and Joseph1994; Pan & Glowinski Reference Pan and Glowinski2005; Yang et al.
Reference Yang, Wang, Joseph, Hu, Pan and Glowinski2005) studies. Similar phenomenon occurs in square- and rectangular-shaped channels, where particles accumulate at 0.3 times the width of the channel away from the centreline (Chun & Ladd Reference Chun and Ladd2006; Kim & Yoo Reference Kim and Yoo2008; Shao, Yu & Sun Reference Shao, Yu and Sun2008; Di Carlo et al.
Reference Di Carlo, Edd, Humphry, Stone and Toner2009; Choi, Seo & Lee Reference Choi, Seo and Lee2011). Inertia is necessary for this phenomenon. The balance of two competing effects, the shear-gradient lift force (Asmolov Reference Asmolov1999) and the wall repulsive force (Zeng, Balachandar & Fischer Reference Zeng, Balachandar and Fischer2005), determine the equilibrium position of the particles. These two forces scale differently but both depend on the Reynolds number (Matas et al.
Reference Matas, Morris and Guazzelli2004) and blockage ratio (Di Carlo et al.
Reference Di Carlo, Edd, Humphry, Stone and Toner2009; Gossett et al.
Reference Gossett, Tse, Dudani, Goda, Woods, Graves and Di Carlo2012). By properly designing the geometry of apparatus, the cross streamline migration can be used in cell and particle focusing, sorting, separation, filtration, enrichment and trapping. Review articles by Di Carlo (Reference Di Carlo2009) and Karimi, Yazdi & Ardekani (Reference Karimi, Yazdi and Ardekani2013) provide a comprehensive discussion of the progress and future directions in this area.
In channel flows of viscoelastic fluids in a low-Reynolds-number regime, the particle migration shows a different behaviour depending on the fluid rheology. For example, particles move towards the centreline in viscoelastic fluids of constant viscosity, whereas they move towards the walls in a shear-thinning fluid (Karnis & Mason Reference Karnis and Mason1966; Gauthier et al. Reference Gauthier, Goldsmith and Mason1971). Particles also move towards the centreline in solutions of moderately cross-linked polymers, whereas little or no migration is observed in solutions of highly cross-linked polymers (Tehrani Reference Tehrani1996). Under the assumption of zero Reynolds number and small blockage ratio, Ho & Leal (Reference Ho and Leal1976) showed that a lateral force, originating from the normal stress differences, drives the particle towards the lower-shear region in a second-order fluid. This conclusion has been verified in other experiments and simulations, where particles move to the central axis of a circular tube (Tehrani Reference Tehrani1996; D’Avino et al. Reference D’Avino, Romeo, Villone, Greco, Netti and Maffettone2012; Romeo et al. Reference Romeo, D’Avino, Greco, Netti and Maffettone2013; Kang et al. Reference Kang, Lee, Hyun, Lee and Kim2014) and to both the centreline and corners in a rectangular channel (Leshansky et al. Reference Leshansky, Bransky, Korin and Dinnar2007; Yang et al. Reference Yang, Kim, Lee, Lee and Kim2011). Based on simulations of the Giesekus and Phan Thien-Tanner constitutive equations, Villone et al. (Reference Villone, D’Avino, Hulsen, Greco and Maffettone2011, Reference Villone, D’Avino, Hulsen, Greco and Maffettone2013) and D’Avino et al. (Reference D’Avino, Romeo, Villone, Greco, Netti and Maffettone2012) observed bistable dynamics of particles in shear-thinning fluids, i.e. the particle may move towards or away from the channel centreline depending on its initial position. The same behaviour is also observed in experiments (Nam et al. Reference Nam, Lim, Kim, Jung and Shin2012). The second normal stress difference leads to a secondary flow in a non-circular channel, which may also directly affect the particle motion by advection (Villone et al. Reference Villone, D’Avino, Hulsen, Greco and Maffettone2013). In a concentrated suspension of rigid particles in Newtonian fluids, the secondary flow resulting from anisotropic particle microstructure affects the particle distribution (Ramachandran Reference Ramachandran2013; Zrehen & Ramachandran Reference Zrehen and Ramachandran2013). A recent review article focusing on particle dynamics in viscoelastic fluids in the absence of inertia can be found in D’Avino & Maffettone (Reference D’Avino and Maffettone2015).
These studies are mostly conducted in flows with dominating elastic effects, where the Reynolds number is small (
 $El>0,Re\simeq 0$
). The interplay between elastic and inertial forces (
 $El>0,Re>0$
) result in different particle migration behaviour. For example, even in a weakly inertial regime in a rectangular channel of viscoelastic fluid, the equilibrium positions at the corners become unstable and particles focus only at the channel centreline (Yang et al.
Reference Yang, Kim, Lee, Lee and Kim2011). This elasto-inertial particle focusing in the range of low Reynolds number (
 $Re\sim 10^{-2}$
–
 $10^{-1}$
) and high elasticity number (
 $El\sim 10^{1}$
–
 $10^{2}$
) is destabilized as the channel Reynolds number increases beyond order unity (Yang et al.
Reference Yang, Kim, Lee, Lee and Kim2011; Kang et al.
Reference Kang, Lee, Hyun, Lee and Kim2014). Conversely, a recent study by Lim et al. (Reference Lim, Ober, Edd, Desai, Neal, Bong, Doyle, McKinley and Toner2014a
) shows that stable particle focusing at the channel centreline can be achieved in weakly viscoelastic flows at a high Reynolds number (
 $El\sim 0.1,Re\sim 2000$
). Their experiments illustrated particle focusing at very high flow rates. Another recent study by Seo, Kang & Lee (Reference Seo, Kang and Lee2014) showed that the flow rate, blockage ratio and shear-thinning properties of viscoelastic fluids have complex effects on the particle migration in a square microchannel in the presence of both elastic and inertial effects.
Despite the above mentioned numerical and experimental studies, there exist gaps in the parameter space, where the mechanisms of particle migration due to the combined effects of rheological properties of viscoelastic fluids, flow conditions and particle–fluid interaction are poorly understood. Experiments have some limitations in providing all the detailed information, and most previous simulations are conducted in flows with that consider only inertial effects (
 $El=0$
) or only elastic effects (
 $Re=0$
), and the interplay of the two forces for spherical particles have not been numerically investigated. The present numerical study aims at bridging this gap in the parameter space.
In the present study, we investigate the particle migration in a square channel by means of three-dimensional direct numerical simulations. Our simulations include the effects of fluid inertia, fluid elasticity, and shear-thinning viscosity in a relatively large range of parameters by using the Oldroyd-B and Giesekus constitutive equations. Our results for a particle in an Oldroyd-B channel flow show that there exists a critical elasticity number above which the particle migrates to the centreline. In a Giesekus fluid with relatively strong inertial effects, we find that the particle migrates away from the centreline. Besides the migration dynamics of the particle in a steady state channel flow, we also study some other less-explored aspects of the problem such as the particle-induced fluid transport and the migration behaviour that occurs during flow start-up.
2. Mathematical model and numerical method
In this study, we consider the motion of a rigid particle in a straight, square channel filled with a viscoelastic fluid. A Cartesian reference frame is considered with its origin at the centre of the channel cross-section. The computational domain spans over
 $[-L/2,L/2]$
in
 $x$
,
 $[-H/2,H/2]$
in
 $y$
and
 $[-H/2,H/2]$
in
 $z$
directions. Unless otherwise stated, the particle is initially at rest and a constant pressure gradient
 $G$
is imposed along the
 $x$
-direction at time
 $t=0$
to drive the channel flow. In what follows, the length is scaled by the channel width
 $H$
, velocity by
 $U_{0}=4kGH^{2}/{\rm\pi}^{3}{\it\mu}$
, time by
 $H/U_{0}$
, shear and angular velocity by
 $U_{0}/H$
, density by
 ${\it\rho}$
and pressure and stress by
 ${\it\mu}U_{0}/H$
, where
 $k$
is a constant, depending on the geometry of the channel. For a square-shaped channel,
 $k=\sum _{n,odd}^{\infty }(1/n^{3})(1-\text{sech}(n{\rm\pi}/2))\simeq 0.571$
. In Newtonian and Oldroyd-B fluids,
 $U_{0}$
is equal to the steady centreline velocity of the channel
 $U_{c}$
(Fetecau & Fetecau Reference Fetecau and Fetecau2005), whereas in shear-thinning fluids
 $U_{c}>U_{0}$
. The particle is neutrally buoyant and has a spherical shape with diameter
 $d$
. The blockage ratio is set to
 ${\it\kappa}=d/H=0.25$
, unless otherwise stated. Hereinafter, unless otherwise stated, all equations and variables are written in dimensionless form. Initially, the particle has zero translational and rotational velocity and is located at
 $\boldsymbol{X}_{p}^{0}=(0,0.25,0)$
, unless otherwise stated. The rigid-body motion of the particle is described by the translational velocity
 $\boldsymbol{U}_{p}=(U_{p},V_{p},W_{p})$
and angular velocity
 ${\it\bf\Omega}_{p}=({\it\Omega}_{x},{\it\Omega}_{y},{\it\Omega}_{z})$
. The centre of the particle is located at
 $\boldsymbol{X}_{p}=(X_{p},Y_{p},Z_{p})$
.
A distributed Lagrange multiplier method is used in our simulations and details of the method can be found in Ardekani, Dabiri & Rangel (Reference Ardekani, Dabiri and Rangel2008), and in Doostmohammadi, Dabiri & Ardekani (Reference Doostmohammadi, Dabiri and Ardekani2014). The entire domain is treated as a fluid, and a forcing term
 $\boldsymbol{f}$
is added inside the particle domain to enforce the rigid body motion of the particle. The dimensionless governing equations for an incompressible fluid are
 $$\begin{eqnarray}\displaystyle & \displaystyle Re_{G}\left(\frac{\partial \boldsymbol{u}}{\partial t}+\boldsymbol{u}\boldsymbol{\cdot }\boldsymbol{{\rm\nabla}}\boldsymbol{u}\right)=-\boldsymbol{{\rm\nabla}}p+\boldsymbol{{\rm\nabla}}\boldsymbol{\cdot }{\bf\tau}-\frac{{\rm\pi}^{3}}{4k}H_{v}(t)\boldsymbol{e}_{x}+\boldsymbol{f}, & \displaystyle\end{eqnarray}$$
 $$\begin{eqnarray}\displaystyle & \boldsymbol{{\rm\nabla}}\boldsymbol{\cdot }\boldsymbol{u}=0, & \displaystyle\end{eqnarray}$$
 $$\begin{eqnarray}\displaystyle \boldsymbol{u}|_{y,z=\pm 0.5}=0,\quad \left.\frac{\partial \boldsymbol{u}}{\partial x}\right|_{x=\pm L/H}=0,\quad \boldsymbol{u}|_{t=0}=0 & & \displaystyle\end{eqnarray}$$
 $$\begin{eqnarray}\displaystyle \boldsymbol{X}_{p}|_{t=0}=\boldsymbol{X}_{p}^{0},\quad \boldsymbol{U}_{p},{\it\bf\Omega}_{p}|_{t=0}=0, & & \displaystyle\end{eqnarray}$$
where
 $Re_{G}={\it\rho}U_{0}H/{\it\mu}=4k{\it\rho}GH^{3}/{\rm\pi}^{3}{\it\mu}$
is the Reynolds number based on the pressure gradient. The flow Reynolds number is equal to
 $Re=Re_{G}$
in Newtonian and Oldroyd-B fluids, while
 $Re>Re_{G}$
in shear-thinning fluids. Here,
 $\boldsymbol{u}$
is the fluid velocity,
 $p$
is the pressure,
 ${\bf\tau}$
is the total deviatoric stress tensor,
 $H_{v}(t)$
is the Heaviside function and
 $\boldsymbol{e}_{x}$
is the unit vector along the
 $x$
-direction. The forcing term
 $\boldsymbol{f}$
is calculated in an iterative procedure to ensure the rigid motion of the particle
 $$\begin{eqnarray}\boldsymbol{f}=\boldsymbol{f}^{\ast }+Re_{G}\frac{{\it\phi}}{{\rm\Delta}t}(\boldsymbol{U}_{p}+{\it\bf\Omega}_{p}\times (\boldsymbol{x}-\boldsymbol{X}_{p})-\boldsymbol{u}),\end{eqnarray}$$
where
 $\boldsymbol{f}^{\ast }$
is the force from the previous iteration,
 ${\it\phi}$
is the volume fraction occupied by the particle in each computational cell (
 ${\it\phi}=1$
inside,
 ${\it\phi}=0$
outside and
 $0<{\it\phi}<1$
for the cells at the surface of the particle),
 $\boldsymbol{U}_{p}$
and
 ${\it\bf\Omega}_{p}$
are determined by
 $$\begin{eqnarray}\boldsymbol{U}_{P}=\frac{1}{M_{p}}\int _{\mathbb{P}}\frac{{\it\rho}_{p}}{{\it\rho}}\boldsymbol{u}\,\text{d}V,\quad {\it\bf\Omega}_{P}=\boldsymbol{I}_{p}^{-1}\int _{\mathbb{P}}\frac{{\it\rho}_{p}}{{\it\rho}}(\boldsymbol{x}-\boldsymbol{X}_{p})\times \boldsymbol{u}\,\text{d}V,\end{eqnarray}$$
where
 $\mathbb{P}$
represents the particle domain,
 ${\it\rho}_{p}/{\it\rho}$
is the ratio of the particle density to the fluid density, which is equal to unity in all our simulations.
 $M_{p}$
and
 $\boldsymbol{I}_{p}$
are the dimensionless mass and moment of inertia of the particle, respectively. Particle mass and moment of inertia are scaled by
 ${\it\rho}H^{3}$
and
 ${\it\rho}H^{5}$
, respectively. Equations (2.1)–(2.3) reduce to Newton’s second law for the particle as shown in Doostmohammadi et al. (Reference Doostmohammadi, Dabiri and Ardekani2014).
The total deviatoric stress tensor,
 ${\bf\tau}$
, can be split into contributions from the solvent and polymer as
 ${\bf\tau}={\bf\tau}^{s}+{\bf\tau}^{p}$
. The Newtonian viscous stress is defined as
 ${\bf\tau}^{s}={\it\beta}^{s}(\boldsymbol{{\rm\nabla}}\boldsymbol{u}+\boldsymbol{{\rm\nabla}}\boldsymbol{u}^{\text{T}})$
, where
 ${\it\beta}^{s}$
is the ratio of the solvent viscosity to the zero shear viscosity of the polymeric material. In all our simulations of viscoelastic fluids,
 ${\it\beta}^{s}=0.1$
. To characterize the evolution of the polymer stress, we utilize the Giesekus constitutive equation (Giesekus Reference Giesekus1982) which captures the constrained elongation of the individual polymer chains and the shear-thinning behaviour of the resulting viscoelastic liquid. In dimensionless form, the resulting constitutive equation can be written as
 $$\begin{eqnarray}{\bf\tau}^{p}+Wi_{G}\overset{{\bigtriangledown}}{{\bf\tau}^{p}}+\frac{Wi_{G}\,{\it\alpha}}{1-{\it\beta}^{s}}({\bf\tau}^{p}\boldsymbol{\cdot }{\bf\tau}^{p})=(1-{\it\beta}^{s})(\boldsymbol{{\rm\nabla}}\boldsymbol{u}+\boldsymbol{{\rm\nabla}}\boldsymbol{u}^{\text{T}}),\end{eqnarray}$$
where
 $Wi_{G}={\it\lambda}U_{0}/H=4k{\it\lambda}GH/{\rm\pi}^{3}{\it\mu}$
is the Weissenberg number and
 ${\it\lambda}$
is the polymer relaxation time. The mobility factor,
 ${\it\alpha}$
, represents the anisotropy of the hydrodynamic drag exerted on the polymer molecules by the surrounding solvent molecules. Based on thermodynamic considerations, the mobility factor must be in the range of 0 to
 $1/2$
(Schleiniger & Weinacht Reference Schleiniger and Weinacht1991). For special case of
 ${\it\alpha}=0$
, the Giesekus model reduces to the Oldroyd-B model. Similar to the Reynolds number,
 $Wi=Wi_{G}$
in Newtonian and Oldroyd-B fluids, and
 $Wi>Wi_{G}$
in a Giesekus fluid. The notation
 $\overset{{\bigtriangledown}}{\boldsymbol{A}}$
represents the upper-convected derivative
 $$\begin{eqnarray}\overset{{\bigtriangledown}}{\boldsymbol{A}}=\frac{\partial \boldsymbol{A}}{\partial t}+\boldsymbol{u}\boldsymbol{\cdot }\boldsymbol{{\rm\nabla}}\boldsymbol{A}-\boldsymbol{{\rm\nabla}}\boldsymbol{u}^{\text{T}}\boldsymbol{\cdot }\boldsymbol{A}-\boldsymbol{A}\boldsymbol{\cdot }\boldsymbol{{\rm\nabla}}\boldsymbol{u}.\end{eqnarray}$$
Simulations are conducted in a non-inertial frame moving with the velocity
 $U_{p}\boldsymbol{e}_{x}$
so that the centre of the particle stays at
 $X_{p}=0$
. The velocity of the fluid in the non-inertial frame becomes
 $\boldsymbol{u}^{\prime }=\boldsymbol{u}-U_{p}\boldsymbol{e}_{x}$
and the governing equation (2.1) can be rewritten for variable
 $\boldsymbol{u}^{\prime }$
.
A finite volume method based on a staggered grid is used for the computations. A conventional operator-splitting method is applied to enforce the continuity equation. The second-order total variation diminishing (TVD) Runge–Kutta method is used for time marching. The spatial derivatives in the convection term are evaluated using the quadratic upstream interpolation for convective kinetics (QUICK) scheme and the diffusion terms are discretized using the central difference scheme. The viscoelastic stress is solved using a commonly used formulation denoted as the elastic–viscous stress splitting (EVSS) method (Guénette & Fortin Reference Guénette and Fortin1995). The grid size
 ${\it\Delta}=0.0125$
(20 grid elements across the particle diameter) is uniform in
 $y$
-,
 $z$
-directions and in a domain
 $x_{f}\in [-0.2,0.2]$
near the particle in the
 $x$
-direction. The grid is gradually stretched in the
 $x$
-direction outside this domain moving away from the particle. The computational domain along the
 $x$
-direction is
 $[-8,8]$
, and the dimension of the channel cross section in
 $y$
–
 $z$
plane is
 $[-0.5,0.5]\times [-0.5,0.5]$
. The time step is
 ${\rm\Delta}t=10^{-5}$
–
 $10^{-4}$
depending on the Reynolds number.
This method has been extensively used for the motion of particles in fluids and verified in our previous publications of inert particles in Newtonian fluids of homogeneous density (Ardekani & Rangel Reference Ardekani and Rangel2008; Ardekani et al.
Reference Ardekani, Dabiri and Rangel2008), density-stratified fluids (Doostmohammadi & Ardekani Reference Doostmohammadi and Ardekani2013; Doostmohammadi et al.
Reference Doostmohammadi, Dabiri and Ardekani2014) and active squirming particles in Newtonian (Li & Ardekani Reference Li and Ardekani2014) and viscoelastic fluids (Li, Karimi & Ardekani Reference Li, Karimi and Ardekani2014). For the case of
 $Re_{G}=18.9,El=0.05,{\it\alpha}=0.0$
and
 ${\it\kappa}=0.25$
, convergence studies have been performed to assess the effects of grid resolution, time step and domain size. The computed results are independent of the mesh size, time step and domain size as shown in figure 1. The calculations in a non-inertial frame are also compared with the same case performed in a laboratory-fixed frame. A uniform grid is used in the entire computational domain for the laboratory-fixed calculations and periodic boundary conditions are used at both inlet and outlet of the channel. The migration velocity of the particle in the laboratory-fixed simulation has some oscillations because of the relative motion of the particle and the fixed grid that is intrinsically caused by the numerical method (D’Avino et al.
Reference D’Avino, Tuccillo, Maffettone, Greco and Hulsen2010b
). By conducting the simulations in a coordinate system moving with the particle in the
 $x$
-direction, the oscillations can be greatly reduced since the relative motion of the particle and the grid in the streamwise direction is zero.
Comparison of the time history of (a) migration velocity
 $V_{p}$
and (b) angular velocity
 ${\it\Omega}_{z}$
of the particle. The corresponding parameters are
 $Re_{G}=18.9,El=0.05,{\it\alpha}=0.0$
and
 ${\it\kappa}=0.25$
. Red solid lines: finest grid size
 ${\it\Delta}=0.0125$
with 20 grid elements across the particle diameter, time step
 ${\rm\Delta}t=10^{-4}$
, the domain size in the
 $x$
-direction is
 $x\in [-8,8]$
and the domain size with a uniform fine grid is
 $x_{f}\in [-0.2,0.2]$
. Green dashed lines:
 ${\it\Delta}=0.00625$
,
 ${\rm\Delta}t=2\times 10^{-5}$
,
 $x\in [-12,12]$
and
 $x_{f}\in [-0.4,0.4]$
. Blue dashdot lines:
 ${\it\Delta}=0.0125$
,
 ${\rm\Delta}t=10^{-4}$
and
 $x=x_{f}\in [-1.6,1.6]$
.

3. Results
In this section, simulation results for particle migration in a channel flow of a viscoelastic fluid are discussed. The simulation parameters are:
 $Re_{G}\sim 3{-}300,El\sim 0{-}0.2,Wi_{G}\sim 0{-}3,{\it\alpha}=0,0.1$
and 0.2 and
 ${\it\kappa}=0.25$
and 0.125, the flow Reynolds and Weissenberg numbers are
 $Re\sim 3{-}1000$
and
 $Wi\sim 0{-}15$
. We first show the steady flow field for three different cases. We then discuss the dynamics of particle migration in § 3.2. In § 3.3, particle-induced fluid transport in the channel will be investigated. Finally in § 3.4, we will discuss the role of flow start-up on the particle migration.
Steady flow field around the particle in a channel filled with (a) Newtonian, (b) Oldroyd-B fluid with
 $El=0.05$
and (c) Giesekus fluid with
 $El=0.05,{\it\alpha}=0.2$
. The Reynolds number in all cases is
 $Re_{G}=18.9$
. The far left planes show the velocity profile, first normal stress distribution (in b,c) and secondary flow (in c) at the inlet of the channel. In the
 $z=0$
plane, streamlines (green lines) are plotted in the frame of reference moving with the particle velocity
 $U_{p}\boldsymbol{e}_{x}$
. In the
 $x=0$
plane, streamlines (black lines) are plotted using the velocity field projected on the
 $x=0$
plane.

3.1. Steady flow field
Figure 2 shows the steady flow field in a channel of Newtonian, Oldroyd-B and Giesekus fluids after the particle has reached its equilibrium position. The Reynolds number is the same in all cases
 $Re_{G}=18.9$
, the elasticity number is
 $El=0.05$
in both the Oldroyd-B and Giesekus fluids and
 ${\it\alpha}=0.2$
for the Giesekus fluid. Far away from the particle, the flow velocity (blue arrows) in the Oldroyd-B channel shows the same distribution as in the Newtonian Poiseuille flow in a square channel (Fetecau & Fetecau Reference Fetecau and Fetecau2005). While in a Giesekus fluid, the velocity profile is flatter near the centre of the channel and a larger maximum velocity is achieved due to the shear-thinning effect. A weak secondary flow consisting of eight vortices (black lines) is generated because of the second normal stress difference in the fluid. These vortices induce a fluid flow from the channel centreline to the wall centre; it then returns to the centreline from the corners. The first normal stress difference, defined as
 $N_{1}={\it\tau}_{xx}-{\it\tau}_{yy}$
is non-zero in viscoelastic fluids and its spatial gradient leads to the elasto-migration of the particle (Ho & Leal Reference Ho and Leal1976). The first normal stress difference is mainly generated near the four walls of the channel, whereas it is much weaker close to the centre and four corners of the channel. This particular distribution in a rectangular cross-section channel is considered to be the main reason behind the particle accumulation at the channel centre and corners (Ho & Leal Reference Ho and Leal1976). The shear-thinning effect reduces the first normal stress difference. We will illustrate that in a Giesekus fluid a different particle migration occurs compared to that in an Oldroyd-B fluid due to the variation in the distribution of the first normal stress difference and secondary flows.
The equilibrium position of the particle may be away from the centreline, as in Newtonian and Giesekus fluids, or at the centreline, as in an Oldroyd-B fluid for a large enough elasticity number. In all three cases, the streamlines in the
 $z=0$
plane (green lines) are reversed, indicating a particle-induced convection along the flow direction (Zurita-Gotor, Blawzdziewicz & Wajnryb Reference Zurita-Gotor, Blawzdziewicz and Wajnryb2007; Amini et al.
Reference Amini, Sollier, Weaver and Di Carlo2012). However, we should note that the blockage is not necessary for the flow reversal, nor is inertia, but either effect (as well as elasticity) may cause it (Lin, Peery & Schowalter Reference Lin, Peery and Schowalter1970; Mikulencak & Morris Reference Mikulencak and Morris2004; Subramanian & Koch Reference Subramanian and Koch2006). In the cross-sectional plane of
 $x=0$
, the secondary flow streamlines (black lines) show different flow patterns depending on the fluid properties. In Newtonian and Giesekus fluids, in-plane vortices are generated and the flow has an overall net transport in the negative
 $y$
-direction. In an Oldyroyd-B fluid, the fluid flows away from the particle. Besides the difference in flow patterns, the contour plots of
 $v$
in the
 $z=0$
plane show that the magnitude of
 $v$
is an order of magnitude smaller in an Oldroyd-B fluid compared to Newtonian and Giesekus fluids. In a Giesekus fluid, the flow field shows greater asymmetry around the particle in the
 $x$
-direction compared to a Newtonian fluid. Since both enhanced velocity magnitude and flow asymmetry around the particle increase the particle-induced lateral transport in a channel, we expect enhanced fluid transport properties in a Giesekus fluid. The particle-induced transport will be quantified in more detail in § 3.3.
3.2. Dynamics of particle migration
Figure 3 shows the time history of the particle lateral position
 $Y_{p}$
under different flow conditions, where particles are released from the initial position
 $Y_{p}^{0}=0.25$
or
 $Y_{p}^{0}=0.1$
. In a Newtonian fluid, the particle gradually migrates to a place near the channel wall with the equilibrium position
 $Y_{p}^{e}\simeq 0.3$
, which is the same as the result of Di Carlo et al. (Reference Di Carlo, Edd, Humphry, Stone and Toner2009) at a similar Reynolds number. This equilibrium position is determined by the balance between two opposing forces: (i) the shear-gradient lift force originating from the curvature of the velocity profile in confined flows which moves the particles away from the centreline of the channel (Asmolov Reference Asmolov1999), and (ii) the wall repulsion force arising from the asymmetry of the corresponding wake vorticity distribution which pushes the particles away from the walls (Zeng et al.
Reference Zeng, Balachandar and Fischer2005).
Time history of the lateral position of the particle
 $Y_{p}$
at different flow conditions.

In viscoelastic fluids, the particle migration is much more complex, and it depends on the fluid rheological properties. Besides the two forces arising in a Newtonian fluid, the net elastic force, shear-thinning effects and the resulting secondary flow may all affect the particle migration. In Oldroyd-B fluids, the elastic effects drive the particle towards the centreline and its equilibrium position depends on both the Reynolds number and elasticity number. In flows of small
 $Re_{G}$
and
 $El$
, the migration stops before the particle reaches the centreline. The equilibrium position of the particle depends on the flow parameters. At higher
 $Re_{G}$
or higher
 $El$
, for example
 $Re_{G}=18.9,El=0.05$
and
 $Re_{G}=301.7,El=0.01$
, the particle eventually migrates all the way to the centreline of the channel, i.e. particle focusing is achieved. This elasto-focusing phenomena has been observed in channel flows of
 $Re\sim 0$
–
 $10^{-1},El\sim 10^{0}$
–
 $10^{2}$
in experiments (Leshansky et al.
Reference Leshansky, Bransky, Korin and Dinnar2007; Yang et al.
Reference Yang, Kim, Lee, Lee and Kim2011; D’Avino et al.
Reference D’Avino, Romeo, Villone, Greco, Netti and Maffettone2012; Romeo et al.
Reference Romeo, D’Avino, Greco, Netti and Maffettone2013; Kang et al.
Reference Kang, Lee, Hyun, Lee and Kim2014), simulations (D’Avino et al.
Reference D’Avino, Maffettone, Greco and Hulsen2010a
; Villone et al.
Reference Villone, D’Avino, Hulsen, Greco and Maffettone2011; D’Avino et al.
Reference D’Avino, Romeo, Villone, Greco, Netti and Maffettone2012), and recently in flows of
 $Re\sim 10^{3},El\sim 10^{-1}$
(Lim et al.
Reference Lim, Ober, Edd, Desai, Neal, Bong, Doyle, McKinley and Toner2014a
). Here we show that the critical elasticity number
 $El_{c}$
, above which particle focusing occurs, is of the order
 $El_{c}\sim O(10^{-2})$
for moderate-Reynolds-number flows. For a given
 $Re_{G}$
and
 $El$
, the particles migrate more slowly in a channel with a smaller blockage ratio
 ${\it\kappa}$
, as observed in previous experiments (Kang et al.
Reference Kang, Lee, Hyun, Lee and Kim2014; Lim et al.
Reference Lim, Ober, Edd, Desai, Neal, Bong, Doyle, McKinley and Toner2014a
). Compared to the two-dimensional cases in Huang et al. (Reference Huang, Feng, Hu and Joseph1997), particle focusing in a three-dimensional channel is easier for large particles. In their simulations, a particle with a blockage ratio of
 ${\it\kappa}=0.25$
is attracted to the wall at
 $Re_{G}=5$
and
 $Wi_{G}=0.2$
, even if released at the centreline of the channel. This is due to a strong elastic force generated from the compression of streamlines for a large blockage ratio, which pushes the particle towards the wall (Huang et al.
Reference Huang, Feng, Hu and Joseph1997). In a three-dimensional case, however, the compression of the streamlines is much weaker.
Dependence of the particle equilibrium position on (a)
 $Re,El$
and (b)
 $Re,Wi$
. Note that
 $Re=Re_{G}$
and
 $Wi=Wi_{G}$
in Newtonian and Oldroyd-B fluids. The inset in (a) shows the dependence of the particle equilibrium position
 $Y_{P}^{e}$
on
 $Re$
for three different elasticity numbers.

When the Reynolds number
 $Re_{G}$
increases, the equilibrium position of the particle
 $Y_{p}^{e}$
moves towards the channel wall in a Newtonian fluid, whereas in an Oldroyd-B fluid of a given elasticity number, it moves towards the centreline (see the inset of figure 4
a). The equilibrium position of the particle is independent of its initial position in an Oldroyd-B fluid. Here, we quantify the dependence of the particle equilibrium position
 $Y_{p}^{e}$
on
 $Re_{G},El$
and
 $Wi$
. The critical elasticity number
 $El_{c}$
, above which particle focusing occurs, is high at small Reynolds numbers, but it decreases dramatically at higher
 $Re_{G}$
. The critical Weissenberg number
 $Wi_{c}$
increases with Reynolds number and roughly shows a linear relationship with
 $Re_{G}$
. Another interesting phenomenon shown in both figure 3 and the inset of figure 4(a) is that equilibrium position for most particles in an Oldroyd-B fluid is either at
 $Y_{p}\gtrsim 0.15$
or at the channel centreline. This is due to the occurrence of the peak inertial force at
 $Y_{p}\simeq 0.15$
, which is explained in the following analysis. Following the analysis of Ho & Leal (Reference Ho and Leal1976) for a second-order fluid, the viscoelastic force on the particle is
 $$\begin{eqnarray}F_{e}^{\ast }=-{\textstyle \frac{40}{3}}{\rm\pi}{\it\rho}U_{c}^{2}d^{2}{\it\kappa}El(1-{\it\beta}_{s})Y_{p},\end{eqnarray}$$
where
 $Y_{p}$
is the dimensionless vertical position of the particle away from the channel centreline. The superscripts
 $\ast$
refer to dimensional variables. The negative sign indicates that the force drives the particle towards the centre of the channel. In Newtonian fluids, inertial effects push the particle away from both the walls and the centre. The shear-gradient lift force, which causes the particle to migrate away from the central axis, has the general form (Di Carlo et al.
Reference Di Carlo, Edd, Humphry, Stone and Toner2009)
 $$\begin{eqnarray}F_{i}^{\ast }={\it\rho}U_{c}^{2}d^{2}{\it\kappa}C_{1}(Y_{p}),\quad Y_{p}\lesssim 0.3,\end{eqnarray}$$
where
 $C_{1}$
is a positive function of
 $Y_{p}$
and has a maximum value of around 0.05 at
 $Y_{p}\simeq 0.15$
and is equal to zero at both
 $Y_{p}=0$
and
 $Y_{p}\simeq 0.3$
. Similar results can also be found in the analysis of Ho & Leal (Reference Ho and Leal1974) for a two-dimensional Poiseuille flow at low Reynolds number
 $Re\ll {\it\kappa}^{2}$
, in which the scaling is given as
 $F_{i}^{\ast }=C_{2}(Y_{p}){\it\rho}U_{c}^{2}d^{2}{\it\kappa}^{2}$
in the entire domain and the peak of
 $C_{2}$
is around 0.24 at
 $Y_{p}\simeq 0.15$
. The balance between
 $F_{e}^{\ast }$
and
 $F_{i}^{\ast }$
determines whether the particle can be focused at the centreline. In flows of high
 $El$
, the elastic force overcomes the maximum inertial force and the particle migrates towards the centreline. However in flows of low
 $El$
, the particle stops at a location before
 $F_{i}^{\ast }$
reaches its maximum. A balance between (3.1) and (3.2) at
 $Y_{p}\simeq 0.15$
leads to an estimate for the critical elasticity number
 $El_{c}\,\simeq \,0.01$
. The analysis of Ho & Leal (Reference Ho and Leal1974), however, leads to
 $El_{c}\,\simeq \,0.04{\it\kappa}$
, which gives the same estimate for
 ${\it\kappa}=0.25$
. This prediction agrees with the present simulation results for high
 $Re$
as shown in figure 4. The prediction fails at relatively low Reynolds numbers, indicating a stronger and more complex coupling between the two effects.
Dependence of the migration velocity
 $V_{p}$
on the particle position
 $Y_{p}$
in (a) Newtonian and Oldroyd-B fluids at different
 $Re_{G}$
and
 $El$
and (b) Giesekus fluid at
 $Re_{G}=18.9$
. Black dot shows the initial location of the particle.

For a non-zero
 ${\it\alpha}$
(i.e., shear thinning effects), the particle migration shows a more complex behaviour in a viscoelastic fluid. At fixed
 $Re_{G}=18.9$
and
 $El=0.05$
, the particle migrates towards the centreline for
 ${\it\alpha}=0.1$
. While for
 ${\it\alpha}=0.2$
, the particle migrates in the opposite direction and gets closer to the wall. This phenomenon is due to the interplay between shear-thinning effects and the secondary flow generated due to the second normal stress difference. The shear-thinning properties affect the particle migration in two ways: (i) they reduce the elastic force by decreasing the fluid viscosity, and (ii) they increase the inertia force by increasing the flow velocity
 $U_{c}$
, causing the equilibrium position of the particle to move closer to the wall in shear-thinning fluids. The secondary flow, whose velocity magnitude is comparable to the particle migration velocity in flows at relatively large
 $El$
and
 ${\it\alpha}$
, drives the particle towards the wall. For example, in a Giesekus fluid with
 $El=0.05,Re_{G}=18.9$
and
 ${\it\alpha}=0.1$
, the maximum value of the far-field
 $v$
-velocity component, which occurs at
 $y\simeq 0.33$
, is
 $2.7\times 10^{-4}$
. While in the flow with
 ${\it\alpha}=0.2$
at the same
 $El$
and
 $Re_{G}$
, the corresponding maximum is
 $3.4\times 10^{-3}$
, the same order as the particle migration velocity. When increasing
 $Re_{G}$
or
 $El$
, the particle moves towards the wall, illustrating that the role of the shear-thinning effect and secondary flow is stronger in flows of larger inertia and/or elastic effects. We should also emphasize that, in a Giesekus fluid, the particle may settle into a different equilibrium position depending on its initial location. At low Reynolds number, the particle migrates towards or away from the channel centreline if it is released near or away from the centreline, respectively. This result is similar to the simulations of D’Avino et al. (Reference D’Avino, Romeo, Villone, Greco, Netti and Maffettone2012), Villone et al. (Reference Villone, D’Avino, Hulsen, Greco and Maffettone2013) in the zero Reynolds number regime. At a high Reynolds number, e.g.
 $Re=75.4$
, however, the particle migrates away from the channel centreline independent of its initial position.
The migration velocity of the particle is the most important measure of particle focusing, and its dependence on the particle size has been used for particle separation applications (Nam et al.
Reference Nam, Lim, Kim, Jung and Shin2012; Kang et al.
Reference Kang, Lee, Hyun, Lee and Kim2014; Lim, Nam & Shin Reference Lim, Nam and Shin2014b
). In figure 5(a,b), we plot the particle migration velocity
 $V_{p}$
as a function of particle position
 $Y_{p}$
in Oldroyd-B and Giesekus fluids, respectively. The particle initially has a large transient migration velocity. After the channel flow reaches steady state, the migration velocity decreases and eventually goes to zero when the particle reaches its equilibrium position. In this section, we mainly focus on the particle migration velocity after the flow has reached the steady state. The migration of the particle during flow start-up will be discussed in § 3.4. The magnitude of the dimensionless migration velocity
 $O(10^{-3}{-}10^{-2})$
is of the same order as the experimental measurements of Lim et al. (Reference Lim, Ober, Edd, Desai, Neal, Bong, Doyle, McKinley and Toner2014a
), and is one order of magnitude larger than experienced in the Stokes regime
 $Re\ll 1$
(D’Avino et al.
Reference D’Avino, Romeo, Villone, Greco, Netti and Maffettone2012; Romeo et al.
Reference Romeo, D’Avino, Greco, Netti and Maffettone2013). In a Giesekus fluid at
 $El=0.01$
, the migration velocity decreases as
 ${\it\alpha}$
increases. At
 $El=0.05$
and
 ${\it\alpha}=0.1$
, the particle still moves to the centreline, but at
 ${\it\alpha}=0.2$
, it migrates towards the wall. An approximately linear relation between
 $V_{p}$
and
 $Y_{p}$
exists before the particle reaches its equilibrium position. This linear relationship holds very well in flows corresponding to small elasticity numbers and low Reynolds numbers.
Steady distribution of (a) velocity
 $u$
and (b) vorticity
 ${\it\omega}_{z}$
in fluids of different
 $El$
and
 ${\it\alpha}$
at
 $Re=18.9$
. Symbols correspond to the velocity/vorticity profile at
 $x=-5$
far from the particle, lines correspond to the velocity/vorticity profile at
 $x=0$
across the particle centre, filled circles mark the centre of the particle.

The relative motion of the particle and surrounding fluid at steady state are shown in figure 6. The distribution of streamwise velocity
 $u$
and vorticity
 ${\it\omega}_{z}=\partial v/\partial x-\partial u/\partial y$
in the
 $z=0$
plane are plotted at two different locations:
 $x=0$
across the particle centre and
 $x=-5$
far from the particle. In Newtonian and Oldroyd-B fluids, the far-field velocity profiles are identical. In a Giesekus fluid, however, the flow velocity increases due to shear-thinning effects, and more remarkable enhancement is observed at higher elasticity numbers (see the inset in figure 6
a). The flow disturbance due to the particle is restricted to a relatively small region close to the particle (one radius away from the particle). Particularly for the case of
 $El=0.05$
and
 ${\it\alpha}=0$
, in which the particle equilibrium position is at the centre of the channel and the particle does not rotate, the velocity quickly recovers to its far-field value. The velocity distributions clearly show that the translational velocity of the particle is smaller than the far-field velocity at the same lateral position, i.e. the particle lags the flow. The experiments of Lim et al. (Reference Lim, Ober, Edd, Desai, Neal, Bong, Doyle, McKinley and Toner2014a
) showed that the centreline-focused particles lead the viscoelastic fluid in the presence of weak or strong shear-thinning effects. At relatively large blockage ratios, as in our cases, the wall effect, which tends to increase the drag force acting on the particle (Happel & Brenner Reference Happel and Brenner1983), overcomes the viscoelastic effect (Chhabra Reference Chhabra1993). Therefore, the particle lags the fluid. These results indicate that the lateral migration of the particle is not directly related to the slip velocity.
The vorticity
 ${\it\omega}_{z}$
, however, shows a different behaviour depending on the fluid properties. In Newtonian and Oldroyd-B fluids as well as in Giesekus fluids with low-elasticity numbers, half the angular velocity of the particle
 $1/2{\it\Omega}_{z}$
is equal to the far-field vorticity. Whereas in a Giesekus fluid of
 $El=0.05$
and
 ${\it\alpha}=0.2$
, it is smaller than the far-field vorticity due to the reduction of the fluid viscosity, and consequently the viscous torque on the particle, in the presence of shear-thinning effects. We also observe that the shear-thinning effect increases the background vorticity in the near-wall region, whereas in the centreline region, it is almost the same as in the Newtonian and Oldroyd-B fluids. Because
 $\partial v/\partial x$
is very small compared to
 $\partial u/\partial y$
when far away from the particle, the local shear rate
 $\dot{{\it\gamma}}=\partial v/\partial x+\partial u/\partial y$
distribution in the fluid has a similar distribution as
 $-{\it\omega}_{z}$
(results not shown here).
3.3. Particle-induced fluid transport
Besides the dynamics of particle migration in a channel flow, the effect of a large rigid particle on fluid transport is another interesting topic, but it has been much less explored in the literature. The fore–aft symmetry around the particle in a Stokes flow is broken in a Newtonian fluid with finite inertia. A net recirculating flow perpendicular to the primary flow direction is developed which depends on the combined effects of the near-field flow, particle rotation, and the channel confinement. This net lateral transport of the fluid, which resembles the well-known Dean flow, occurs in a straight channel and has been successfully applied to perform fluid switching and mixing (Amini et al. Reference Amini, Sollier, Weaver and Di Carlo2012). As shown in § 3.1, in an Oldroyd-B fluid, the particle-induced lateral flow is greatly inhibited due to the absence of particle rotation. In a Giesekus fluid, the configuration of this lateral secondary flow shows a remarkable difference from the one in a Newtonian fluid, and has a stronger fore–aft asymmetry. In this section, we mainly focus on the secondary flow field after the particle has reached to its equilibrium position.
Particle-induced lateral flows at different
 $x$
-locations for (i)
 $Re_{G}=18.9,El=0$
, (ii)
 $Re_{G}=301.7,El=0$
and (iii)
 $Re_{G}=18.9,El=0.05$
and
 ${\it\alpha}=0.2$
. Contour plots show the distribution of the velocity component
 $v$
. Vectors show the in-plane projection of the velocity field. (a,f,k)
 $x=-1.25$
, (b,g,l)
 $x=-0.125$
, (c,h,m)
 $x=0$
, (d,i,n)
 $x=0.125$
, (e,j,o)
 $x=1.25$
. The scaling of velocity vector is shown in the lower left corner of each panel.

For three cases: (i)
 $Re_{G}=18.9,El=0$
, (ii)
 $Re_{G}=301.7,El=0$
and (iii)
 $Re_{G}=18.9,El=0.05$
and
 ${\it\alpha}=0.2$
, we compare the flow field in the
 $z$
–
 $y$
plane at different locations (
 $x=\pm 1.25,\pm 0.125$
and
 $x=0$
) in figure 7. The lateral flow generally shows similar flow pattern for the two Newtonian cases. Upstream, far from the particle, the fluid has a weak tendency to flow in the positive
 $y$
-direction. Due to the particle rotation, the flow is driven in the negative
 $y$
-direction when approaching the particle, and this is then reversed downstream of the particle. Further downstream, the flow starts to recover, and velocity has an opposite sign compared to the upstream velocity. Around the particle, the magnitude of the lateral flow is on the order of
 ${\it\omega}_{z}a\sim 0.1$
, and it decays away from the particle. At higher Reynolds numbers, the flow decays more slowly, particularly downstream of the particle. The flow is in the positive
 $y$
-direction in the middle of the channel (see figure 7
j). In a Giesekus fluid, the flow shows a strong fore–aft asymmetry due to both inertia and the viscoelastic wake, similar to the flow field around a settling sphere (Arigo et al.
Reference Arigo, Rajagopalan, Shapley and McKinley1995; Fabris, Muller & Liepmann Reference Fabris, Muller and Liepmann1999; Abedijaberi & Khomami Reference Abedijaberi and Khomami2012). These secondary flows interact with the particle-induced flow, and further enhance the fluid mixing.
To quantitatively compare the fluid transport, we calculate the net velocity
 $\langle v\rangle _{x,y}$
averaged in both
 $x$
and
 $y$
directions and compare the distribution over the channel width
 $z$
. In a Newtonian fluid, the net flow velocity has a peak at the centreline both upstream and downstream of the particle (see figure 8
a). As
 $Re_{G}$
increases, two additional peaks appear near the walls. In the upstream region, the magnitude of the net flow decreases at the centreline with the Reynolds number. In the downstream region, it increases with the Reynolds number. The contribution from the downstream wins, and the net fluid transport, which mainly occurs in the middle of the channel, drives the fluid towards the particle. The fluid transport induced by a particle in a Giesekus fluid is shown in figure 8(b). The net fluid transport in the domain [
 $-1.25$
, 1.25] occurs mainly in two regions between the centreline and the channel walls. The flow direction is away from the particle. Figure 9 shows the net averaged velocity
 $\langle v\rangle _{x,y,z}$
over the domain
 $[-1.25,1.25]\times [-0.5,0.5]\times [-0.5,0.5]$
for different flow conditions. In a Newtonian fluid, the net fluid transport increases with the flow Reynolds number. In a viscoelastic fluid, there is a more complex relationship with the Reynolds number, elasticity number
 $El$
and mobility factor
 ${\it\alpha}$
. However, the net velocity shows an approximately linear relationship with the flow Weissenberg number
 $Wi$
.
The distribution of the fluid velocity over the channel width
 $z$
for (a) Newtonian fluid and (b) Giesekus fluid. The integration in the
 $y$
-direction is over the entire channel height [
 $-0.5$
, 0.5], and integration in the
 $x$
-direction are performed for different regions: upstream region [
 $-1.25$
, 0] (green dotted lines), downstream region [0, 1.25] (blue dashdot lines) and central region [
 $-1.25$
, 1.25] (red solid lines). (a)
 $El=0$
, (b)
 $Re_{G}=18.9$
.

Dependence of the averaged velocity
 $\langle v\rangle _{x,y,z}$
over the domain
 $[-1.25,1.25]\times [-0.5,0.5]\times [-0.5,0.5]$
on (a)
 $Re$
and
 $Re_{G}$
(inset), and (b)
 $Wi$
and
 $Wi_{G}$
(inset).

3.4. Particle migration during flow start-up
In the Poiseuille flow of viscoelastic fluids, velocity oscillation can be observed during flow start-up (Fetecau & Fetecau Reference Fetecau and Fetecau2005) because of the propagation of stress waves in the channel (Duarte, Miranda & Oliveira Reference Duarte, Miranda and Oliveira2008). Transient velocity oscillations also occur for a particle settling in viscoelastic fluids, often causing the particle to ‘rebound’ during the first oscillation (Arigo & McKinley Reference Arigo and McKinley1997; Goyal & Derksen Reference Goyal and Derksen2012). The pulsatile character of blood circulation is an important example of unsteady channel flow of a non-Newtonian fluid. However, recent studies have not reported the particle migration in an unsteady background flow. In this section, we discuss the transient behaviour of particle migration during flow start-up.
(a) Time history of particle migration velocity for different flow conditions. (b) Time history of the channel centreline velocity
 $U_{c}$
far away from the particle, particle streamwise velocity
 $U_{p}$
, and migration velocity
 $V_{p}$
at flow start-up. The flow conditions are
 $Re_{G}=18.9,El=0.05$
and
 ${\it\alpha}=0$
.

Figure 10(a) shows the time history of the particle migration velocity for different flow conditions. At relatively large
 $Re$
and
 $El$
, the migration velocity oscillates during flow start-up. In a shear-thinning fluid, the particle initially migrates towards the centreline, but after the growth of the secondary flow, the particle moves towards the wall. In figure 10(b), we compare the channel centreline velocity
 $U_{c}$
far from the particle, the particle streamwise velocity
 $U_{p}$
and the migration velocity
 $V_{p}$
during flow start-up for the case of
 $Re_{G}=18.9,El=0.05$
and
 ${\it\alpha}=0$
. The fluid velocity oscillates for times
 $t<10$
before it reaches steady state, and the peak velocity occurs at
 $t\simeq 2$
. The streamwise particle velocity
 $U_{p}$
follows this oscillatory response until
 $t\sim 10$
, it then slowly increases as the particle moves towards the centreline region. The migration velocity
 $V_{p}$
, however, shows a more complex time dependence. At
 $t<1$
, the migration velocity is towards the wall because the viscoelastic stresses are still very weak and inertial effects dominate the flow. As the viscoelastic stress grows,
 $V_{p}$
quickly grows and overshoots at the same time instant as
 $U_{c}$
and
 $U_{p}$
. After some oscillations, its magnitude gradually decreases. The magnitude of the overshoot of
 $V_{p}$
, which is about twice its steady value, is larger than the corresponding values for
 $U_{c}$
and
 $U_{p}$
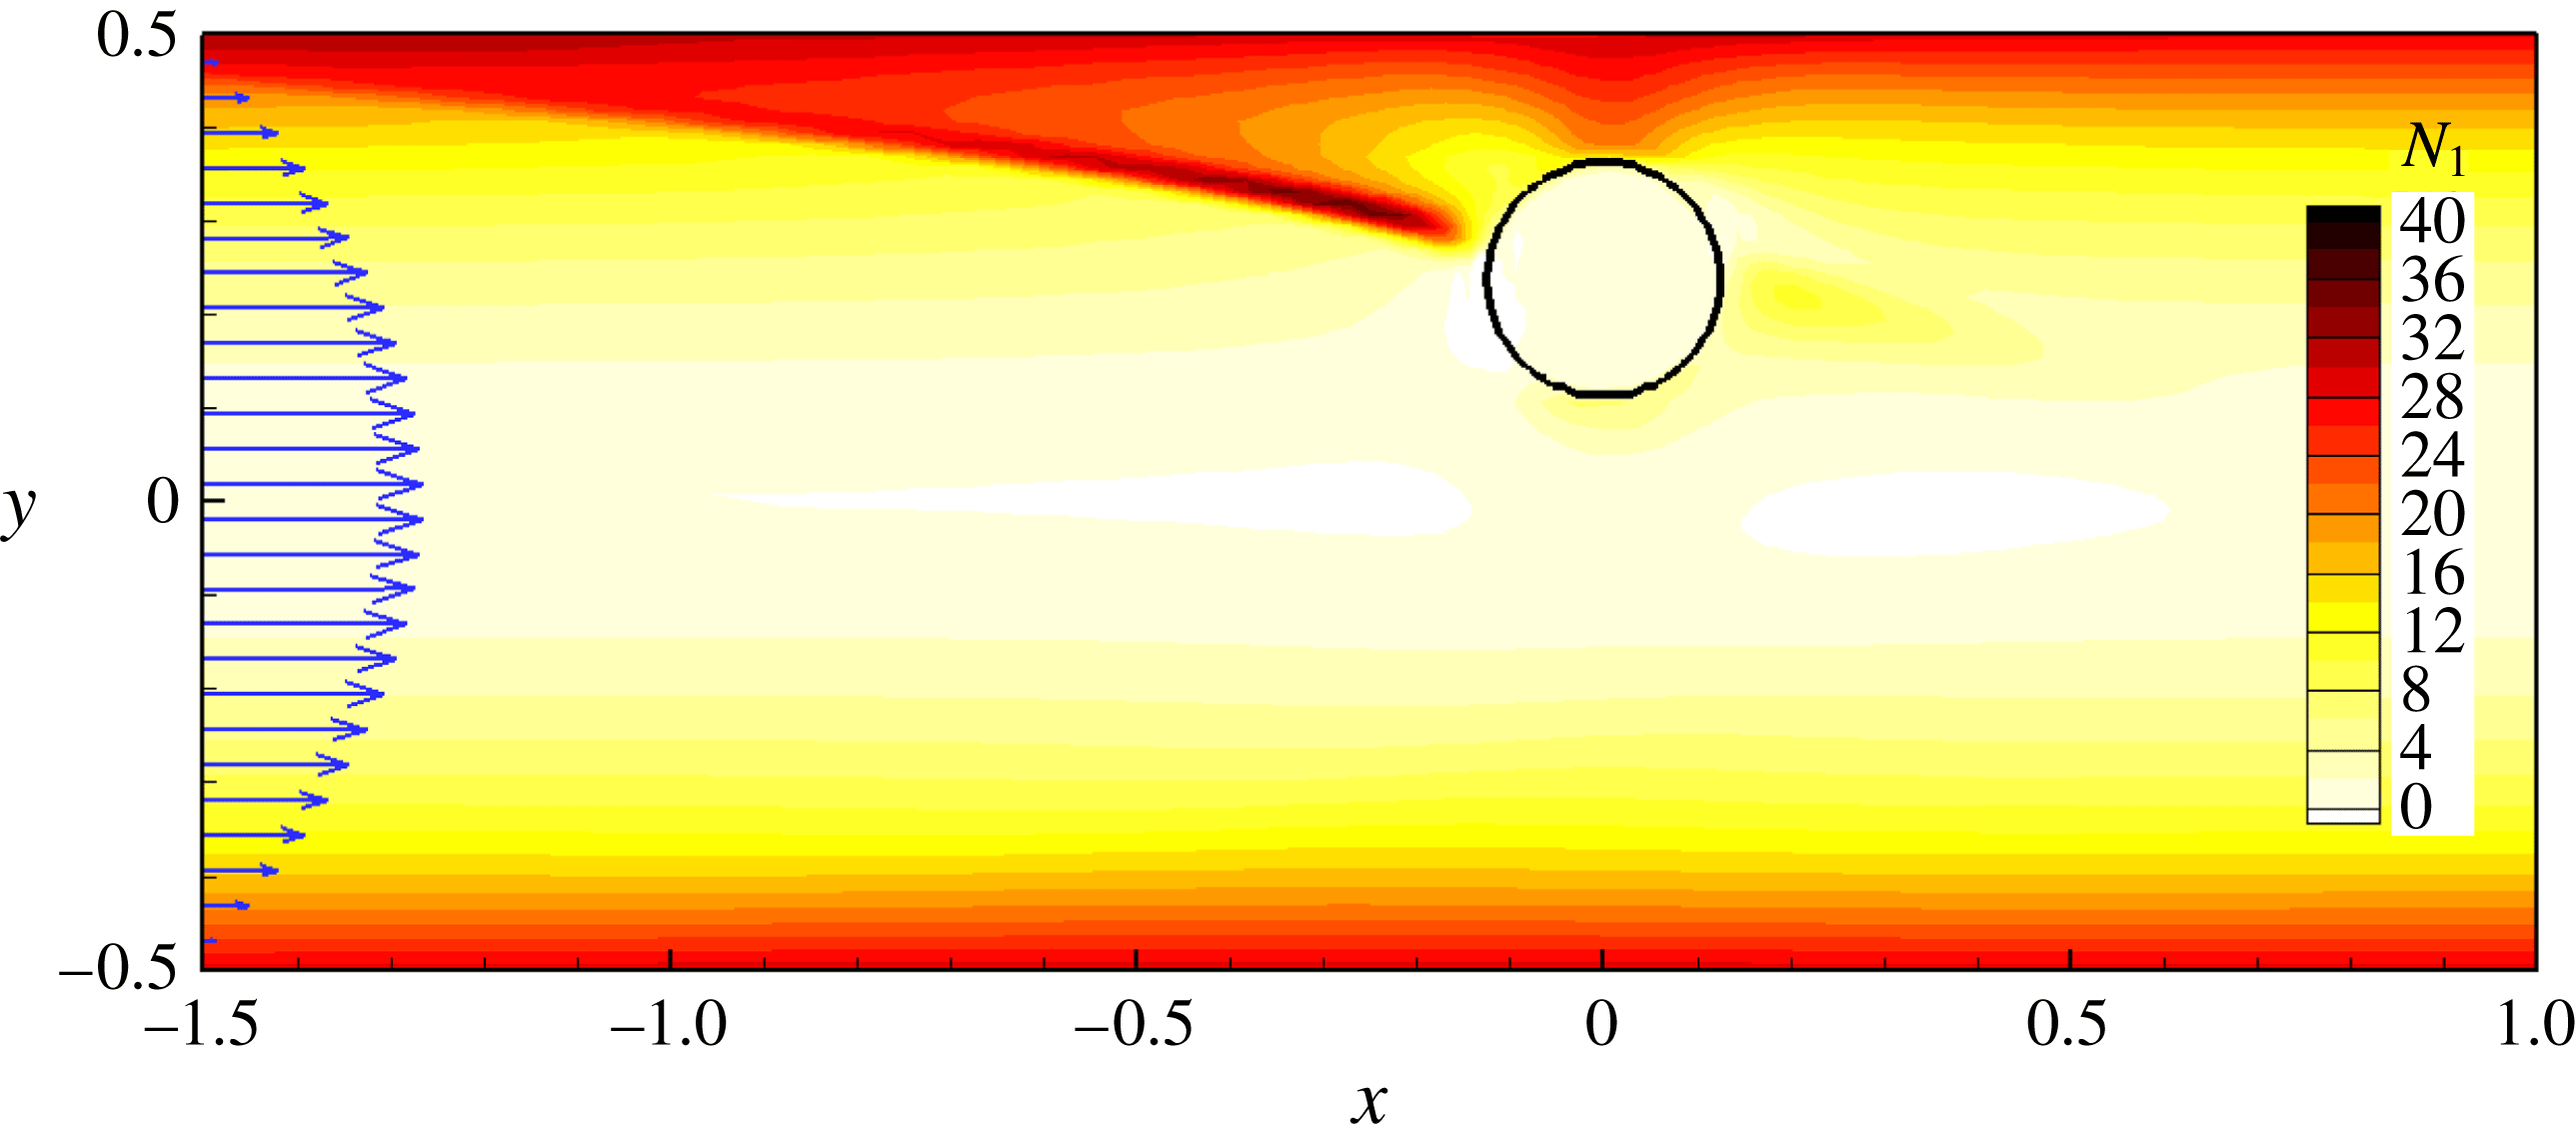
. Figure 11 shows the distribution of first normal stress difference
 $N_{1}$
at time
 $t=3$
. The first normal stress difference in the gap between the particle and the wall is stronger than on the other side. Furthermore, a strip of large normal stress difference is generated near the wall upstream of the particle due to the relative motion of the particle and the wall as well as the particle rotation. This strip disappears as the particle approaches its equilibrium position and moves away from the wall.
First normal stress difference around the particle at
 $t=3$
in the
 $z$
plane. The flow conditions are
 $Re_{G}=18.9,El=0.05$
and
 ${\it\alpha}=0$
. The corresponding video is available as supplementary material in http://dx.doi.org/10.1017/jfm.2015.619.
4. Concluding remarks
Particle migration in the pressure-driven channel flow of viscoelastic fluids is affected by the interplay between several effects: inertia, elasticity, shear-thinning viscosity as well as the secondary flow induced by the second normal stress difference in a non-circular channel. In an Oldroyd-B fluid, the competition between the inertia force and the elastic force determines the particle migration. The elastic force, which drives the particle towards the channel centreline, decreases monotonically as the particle reaches the centreline. The inertia force, which has a peak at
 $Y_{p}\simeq 0.15$
, pushes the particle towards the wall. If the elastic force is weaker than the inertia force, the particle migration stops at a location where the two forces are balanced. Once the elastic force overcomes the maximum inertia force, the particle moves till it reaches the centreline. A scaling analysis of the force balance provides a good estimate for the critical elasticity and Weissenberg numbers for particle focusing in flows at relative large Reynolds numbers. Both the shear-thinning effect and the corresponding secondary flow tend to move the particle closer to the wall, and their effects are more pronounced with stronger inertia and elasticity. Besides the particle migration, we have also considered the particle-induced fluid transport and the particle motion induced during flow start-up. An effective fluid transport perpendicular to the primary flow direction can be achieved in flows with strong inertial and shear-thinning effects. The particle can have a substantially larger transient migration velocity during flow start-up in a viscoelastic fluid due to the streamwise velocity oscillation and the strong normal stress difference that develops.
Acknowledgements
This publication was made possible, in part, with support from NSF (grant no. CBET-1445955-CAREER). We acknowledge the suggestions and comments from the anonymous referees.
Supplementary movie
Supplementary movie is available at http://dx.doi.org/10.1017/jfm.2015.619.



