1. Introduction
Two-phase flows, e.g. liquid/gas flows, or more generally flows involving two immiscible phases, are widely encountered in natural, domestic and industrial situations. At sufficiently high injection velocity, such flows have strong propensity to break up into a myriad of liquid fragments, subsequently atomizing into a stream of dispersed droplets in a gaseous atmosphere, called spray. The process of successive disintegration of a bulk liquid flow into a stream of drops is referred to as liquid atomization.
Liquid atomization is essentially a multi-scale and multi-dimensional phenomenon, i.e. with dynamics that is generally turbulent, which can differ significantly depending on the region of the flow, the sizes of the involved liquid structures and the fluid/flow physical parameters. Before breaking up into spherical droplets, these liquid structures have complex geometry, morphology and topology whose description still remains a challenging task (Di Battista et al. Reference Di Battista, Bermejo-Moreno, Ménard, de Chaisemartin and Massot2019; Essadki et al. Reference Essadki, Drui, Larat, Ménard and Massot2019; Thiesset et al. Reference Thiesset, Dumouchel, Ménard, Aniszewski, Vaudor and Berlemont2019b). Another difficulty resides in the local and singular nature of liquid break-up. Indeed, atomization results from topological transitions due to local pinch-off of liquid necks, a nice physical example of the formation of singularities at finite time (e.g. Eggers & Villermaux Reference Eggers and Villermaux2008, and references therein). Exploring and predicting liquid atomization thus necessitates some sophisticated theoretical tools, among which some need yet to be elaborated. When compared to single-phase flows, the complexity in the theoretical description of two-phase flows rises in a significant manner. Indeed, the presence of the liquid–gas interface and hence surface tension effects, together with the density and viscosity jump across the interface, makes inoperative most of available theoretical results obtained in the context of single-phase turbulence (Gorokhovski & Herrmann Reference Gorokhovski and Herrmann2008). Some specific theories are thus required.
However, although the presence of such an interface could appear as an overwhelming obstacle, it also constitutes a glaring anchor point. One can indeed conjecture that many key facets of the multi-scale and multi-dimensional character of the whole flow can be quantified solely through the multi-scale and multi-dimensional characteristics of the liquid–gas interface. Similarly, instead of characterizing the scale/space/time properties of the whole turbulent velocity field, one can focus on the scale/space/time properties of the transport of liquid relative to the gas phase, thereby reducing the analysis to a single scalar field variable, viz. the liquid phase indicator field. Further, as will be thoroughly detailed later, by use of a statistical analysis, the singular nature of liquid break-up is likely to be smoothed out by the averaging procedures. It is then expected that once averaged, liquid atomization (i) recovers some degree of regularity so that the dynamics of liquid structures appear continuous, (ii) retrieves some degree of predictability in the statistical sense. These are the key hypotheses the present paper aims at discussing.
Here, the multi-scale features of liquid/gas turbulent flows are appraised using the recent theoretical framework proposed by Thiesset et al. (Reference Thiesset, Duret, Ménard, Dumouchel, Reveillon and Demoulin2020). This theory is inspired by the generalized Kármán–Howarth–Kolmogorov equation (e.g. Hill Reference Hill2002; Casciola et al. Reference Casciola, Gualtieri, Benzi and Piva2003; Danaila, Antonia & Burattini Reference Danaila, Antonia and Burattini2004; Marati, Casciola & Piva Reference Marati, Casciola and Piva2004; Portela, Papadakis & Vassilicos Reference Portela, Papadakis and Vassilicos2017, and reference therein) which is adapted to a relevant scalar of two-phase flows: the phase indicator function. As shown by Thiesset et al. (Reference Thiesset, Duret, Ménard, Dumouchel, Reveillon and Demoulin2020), this new framework is promising for characterizing turbulent liquid/gas flows because, (i) the notion of scale is explicit and unambiguously defined, (ii) it is exact and thus applies to the entire flow field, from the injection to the spray dispersion zone and irrespective of the flow configuration or regime and (iii) the effect of different physical parameters (surface tension, viscosity and density, inflow velocity conditions), although implicit in the equations, can be probed as a function of the scale and flow position. Thiesset et al. (Reference Thiesset, Duret, Ménard, Dumouchel, Reveillon and Demoulin2020) reported an analysis of a statistically homogeneous flow evolving in a triply periodic box which was numerically simulated using the code ARCHER. This particular configuration is not influenced by any preferential forcing direction. Hence, the liquid-phase statistics were invariant by translation within the flow, thereby reducing the problem to a scale/time analysis only. Here, we aim at extending the study of Thiesset et al. (Reference Thiesset, Duret, Ménard, Dumouchel, Reveillon and Demoulin2020), by exploring the full scale/space/time evolution of the liquid phase in a flow which reveals a substantial degree of inhomogeneity: a liquid/gas shear layer. This is a new test case for the proposed formalism using two-point statistics. This flow configuration is one step further towards real atomization situation since the forcing effect due to a mean velocity gradient is included. Although still quite far from a real situation, it is archetypal of the so-called air-assisted atomization (Lasheras & Hopfinger Reference Lasheras and Hopfinger2000; Marmottant & Villermaux Reference Marmottant and Villermaux2004; Fuster et al. Reference Fuster, Matas, Marty, Popinet, Hoepffner, Cartellier and Zaleski2013; Ling et al. Reference Ling, Fuster, Zaleski and Tryggvason2017, Reference Ling, Fuster, Tryggvason and Zaleski2019).
Additionally, because two-phase flows are not the only physical situations where a discontinuity separates two media of different natures, our objective is to address this question within the broader context of heterogeneous media. Therefore, we expect some of our elaborations to apply not only to two-phase flows but we hope that they can help better characterizing the structure and dynamics of heterogeneous fields in general such as, for instance, porous media, fractal aggregates or colloids.
The paper is organized as follows. The theoretical framework first reported by Thiesset et al. (Reference Thiesset, Duret, Ménard, Dumouchel, Reveillon and Demoulin2020) is recalled briefly in § 2. Section 3 is devoted to the presentation of the two-phase flow solver ARCHER, which was used to simulate the liquid–gas shear layer under consideration. The numerical database used to appraise the contribution of the different terms of the equations is detailed. Section 4 aims at emphasizing the close relationship between two-point statistics of the liquid-phase indicator function and some geometrical properties of the liquid/gas interface and liquid structures. The space/scale/time evolution of the liquid phase in the shear layer is performed for both the total and the fluctuating field in §§ 5 and 6, respectively. The paper closes with some conclusions.
2. Space-scale-time analysis of liquid transport
The present study follows the lines of Thiesset, Dumouchel & Ménard (Reference Thiesset, Dumouchel and Ménard2019a); Thiesset et al. (Reference Thiesset, Duret, Ménard, Dumouchel, Reveillon and Demoulin2020) and is based on an analysis of the phase indicator field  $\phi$ which is 1 (or 0) in the liquid (or gas) phase. As per Thiesset et al. (Reference Thiesset, Dumouchel and Ménard2019a, Reference Thiesset, Duret, Ménard, Dumouchel, Reveillon and Demoulin2020), we define the second-order structure functions of
 $\phi$, as the averaged squared difference of
 $\phi$ between two arbitrary points separated by a vector
 $\boldsymbol {r}$ (see figure 1) viz.
 \begin{equation} \left\langle(\delta \phi)^2 \right\rangle_{\mathbb{E}} = \left\langle \left[ \phi(\boldsymbol{x}^+ ) - \phi(\boldsymbol{x}^-) \right]^2\right\rangle_{\mathbb{E}} \nonumber\\ = \left\langle \left[ \phi \left(\boldsymbol{X}+\frac{\boldsymbol{r}}{2}\right) - \phi \left(\boldsymbol{X}-\frac{\boldsymbol{r}}{2} \right) \right]^2\right\rangle_{\mathbb{E}}, \end{equation}
where the brackets denote average and the subscript  $\mathbb {E}$ indicates an ensemble average. As seen in figure 1, the mid-point is defined by
 $\boldsymbol {X} = (\boldsymbol {x}^+ + \boldsymbol {x}^-)/2$ and the separation vector
 $\boldsymbol {r} = (\boldsymbol {x}^+ - \boldsymbol {x}^-)$ (Hill Reference Hill2002). A physical interpretation of
 $(\delta \phi )^2$ is provided later in § 4. Because we consider the averaged squared difference of
 $\phi$, we sometimes refer to
 $(\delta \phi )^2$ as the ‘energy’ content at a given scale, in analogy with the second-order structure function of the velocity field, which effectively represents the kinetic energy at a given scale. Alternatively, we call
 $(\delta \phi )^2$ the scale distribution.
Schematic representation of two points  $\boldsymbol {x}^+$ and
 $\boldsymbol {x}^-$, the mid-point
 $\boldsymbol {X} = (X,Y,Z)$ and the separation vector
 $\boldsymbol {r} = (r_x, r_y, r_z)$.

Thiesset et al. (Reference Thiesset, Dumouchel and Ménard2019a, Reference Thiesset, Duret, Ménard, Dumouchel, Reveillon and Demoulin2020) derived the transport equation for the second-order structure functions of the phase indicator field. They considered the equation not only for the total field  $\phi$ but also the fluctuating field
 $\phi ' = \phi - \langle \phi \rangle _\mathbb {E}$, viz.
 \begin{align} \partial_t \left\langle \left( \delta {\phi} \right)^2 \right\rangle_{\mathbb{E}} &={-} \boldsymbol{\nabla}_{\boldsymbol{r}} \cdot \left\langle {(\delta {\boldsymbol{u}}) \left(\delta \phi\right)^2} \right\rangle_{\mathbb{E}} - \boldsymbol{\nabla}_{\boldsymbol{X}} \cdot \left\langle {(\sigma {\boldsymbol{u}}) \left(\delta \phi\right)^2} \right\rangle_{\mathbb{E}},\end{align}
 \begin{align} \partial_t \left\langle \left( \delta {\phi'} \right)^2 \right\rangle_{\mathbb{E}} &={-} \boldsymbol{\nabla}_{\boldsymbol{r}} \cdot \left\langle {(\delta {\boldsymbol{u}}) \left(\delta \phi'\right)^2} \right\rangle_{\mathbb{E}} - 2 \left\langle {(\delta \phi')(\delta \boldsymbol{u}')} \right\rangle_{\mathbb{E}} \cdot \boldsymbol{\nabla}_{\boldsymbol{r}} \left\langle \delta \phi \right\rangle_{\mathbb{E}}\notag\\ &\quad - \boldsymbol{\nabla}_{\boldsymbol{X}} \cdot \left\langle \left(\sigma \boldsymbol{u}\right) \left(\delta \phi'\right)^2 \right\rangle_{\mathbb{E}} - 2 \left\langle {(\delta \phi')(\sigma \boldsymbol{u'})} \right\rangle_{\mathbb{E}} \cdot \boldsymbol{\nabla}_{\boldsymbol{X}} \left\langle \delta \phi \right\rangle_{\mathbb{E}}, \end{align}
where  $\boldsymbol{u} \equiv (u,v,w)$ represents the velocity field;
 $\partial _t$ denotes the time derivative;
 $\boldsymbol {\nabla }_{\boldsymbol {r}}$ and
 $\boldsymbol {\nabla }_{\boldsymbol {X}}$ are the gradient operators in the
 $\boldsymbol {r}$ and
 $\boldsymbol {X}$ space, respectively;
 $\delta \bullet$ and
 $\sigma \bullet$ represent the difference and the average of a given quantity between the two-points considered. At this level, the different terms of (2.2a) and (2.2b) depend on
 $\boldsymbol {X} \equiv (X, Y, Z)$ (the mid-point between the two-points corresponding to the position within the flow),
 $\boldsymbol {r} \equiv (r_x, r_y, r_z)$ (the separation vector whose magnitude can be associated with the probed scale) and time
 $t$, i.e. a seven-dimensional problem. The methodology for deriving these equations is described in great detail by Thiesset et al. (Reference Thiesset, Duret, Ménard, Dumouchel, Reveillon and Demoulin2020), Hill (Reference Hill2002) and Danaila et al. (Reference Danaila, Antonia and Burattini2004) and is not repeated here. It is only worth noting that (2.2a) and (2.2b) are exact equations which can be derived directly from the transport equation for the phase indicator supposing the flow to be incompressible with no phase change. Equations (2.2a) and (2.2b) explicitly account for the anisotropic (through the dependence to the separation vector
 $\boldsymbol {r}$) and inhomogeneous (through the appearance of the position space
 $\boldsymbol {X}$) characters of the flow.
2.1. Average along homogeneity directions
Here, we explore the specific configuration of a temporally evolving shear layer with two homogeneity directions in the streamwise  $x$ and spanwise directions
 $z$ (see § 3). Therefore, planar averages over the set of points
 $\mathbb {P}(Y) = \{ X, Y, Z | Y, 0 \leq X \leq L_x, 0 \leq Z \leq L_z \}$ can be used in place of ensemble averages;
 $L_x$ and
 $L_z$ represent the size of the averaging domain in the streamwise and spanwise directions, respectively. Equations (2.2a) and (2.2b) then reduce to
 \begin{align} \underbrace{\partial_t \left\langle \left( \delta {\phi} \right)^2 \right\rangle_{\mathbb{P}}}_{\textrm{d}t\ \textrm{term}} &= \underbrace{- \boldsymbol{\nabla}_{\boldsymbol{r}} \cdot \left\langle {(\delta {\boldsymbol{u}}) \left(\delta \phi\right)^2} \right\rangle_{\mathbb{P}}}_{r\text{-}\textrm{Transfer}} \underbrace{- {\partial}_{Y} \left\langle {(\sigma v') \left(\delta \phi\right)^2} \right\rangle_{\mathbb{P}} }_{Y\text{-}\textrm{Transfer}}, \end{align}
 \begin{align}\underbrace{\partial_t \left\langle \left( \delta {\phi'} \right)^2 \right\rangle_{\mathbb{P}}}_{\textrm{d}t\ \textrm{term}} &= \underbrace{- \boldsymbol{\nabla}_{\boldsymbol{r}} \cdot \left\langle {(\delta {\boldsymbol{u}}) \left(\delta \phi'\right)^2} \right\rangle_{\mathbb{P}}}_{r\text{-}\textrm{Transfer}} \underbrace{- 2 \left\langle {(\delta \phi')(\delta v')} \right\rangle_{\mathbb{P}} {\partial}_{r_y} \left\langle \delta \phi \right\rangle_{\mathbb{P}} }_{r\text{-}\textrm{Production}}\notag\\ &\quad \underbrace{- \partial_Y \left\langle \left(\sigma v'\right) \left(\delta \phi'\right)^2 \right\rangle_{\mathbb{P}}}_{Y\text{-}\textrm{Transfer}} \underbrace{- 2 \left\langle {(\delta \phi')(\sigma v')} \right\rangle_{\mathbb{P}} {\partial}_{Y} \left\langle \delta \phi \right\rangle_{\mathbb{P}} }_{Y\text{-}\textrm{Production}}, \end{align}
where we have used  $\langle v \rangle _{\mathbb {P}} = 0$ and hence
 $v = v'$. Equation (2.3a) is the transport equation for the second-order structure function of the total field
 $\phi$. It reveals that time variations of
 $\langle (\delta \phi )^2\rangle _\mathbb {P}$ are due to the combined effect of two transfer processes (more precisely divergence of fluxes) which occur concomitantly in scale
 $\boldsymbol {r}$ and physical space
 ${Y}$. The transfer in scale space, abbreviated by the
 $r$-transfer term, quantifies the direction and amplitude of the cascade process, i.e. the transfer of the quantity
 $\langle (\delta \phi )^2 \rangle _{\mathbb {P}}$ between different orientations and the modulus of the vector
 $\boldsymbol {r}$. Hereafter, in this paper, the word ‘cascade’ will be used to designate the transfer of ‘energy’ between scales which is mathematically given by the
 $r$-divergence term in (2.3a) and (2.3b). The other transfer term, abbreviated
 $Y$-transfer, represents the transport of a given liquid scale in geometrical space, i.e. from one position within the flow (here, one
 $Y$ plane location) to another.
Equation (2.3b) pertains to the fluctuating component  $\phi '$. In addition to similar transfer terms, the latter contains two additional processes, namely two production processes which again act concomitantly in scale and physical space. The production process is associated with the presence of inhomogeneities, i.e. some gradients of liquid volume fraction
 $\langle \phi \rangle _{\mathbb {P}}$. As was proved by Thiesset et al. (Reference Thiesset, Duret, Ménard, Dumouchel, Reveillon and Demoulin2020), this production mechanism can also be interpreted as an exchange of liquid between the mean and the fluctuating fields which acts to homogenize the mean volume fraction field. Further physical interpretations and algebraic decompositions of the different terms of (2.3a) and (2.3b) are provided by Thiesset et al. (Reference Thiesset, Duret, Ménard, Dumouchel, Reveillon and Demoulin2020) but are not considered in the present study.
Note here again that (2.3a) and (2.3b) hold even if the flow is anisotropic and inhomogeneous.
2.2. Average over all directions of the separation vector
The different terms of (2.3a) and (2.3b) have argument list ( $\boldsymbol {r}, Y, t)$, i.e. a five-dimensional (5-D) problem. The dependence of the statistics on the separation vector
 $\boldsymbol {r}$ embeds the anisotropic character of the transport of liquid, which is of major importance in this flow. However, substantial information can first be gained by averaging over all orientations of the separation vector
 $\boldsymbol {r}$, thereby reducing the problem complexity to a 3-D problem with argument list (
 $|\boldsymbol {r}|, Y, t)$. This can be achieved in two fashions. The first method is to perform an angular average over all solid angles. This operation is denoted
 $\langle \bullet \rangle _\varOmega$ and is defined by
 \begin{equation} \langle \bullet \rangle_\varOmega = \frac{1}{4{\rm \pi}} \iint_\varOmega \bullet \sin \theta \,\textrm{d}\theta \,\textrm{d} \varphi, \end{equation}
where the set of solid angles  $\varOmega = \{ \varphi , \theta ~|~ 0 \leq \varphi \leq {\rm \pi}, 0 \leq \theta \leq 2 {\rm \pi}\}$ with
 $\varphi = \arctan (r_y/r_x)$ and
 $\theta = \arccos (r_z/|\boldsymbol {r}|)$. The angular average is related to the spherical average within a sphere of radius
 $r = |\boldsymbol {r}|$, noted
 $\langle \bullet \rangle _\mathbb {S}$ and defined by (Hill Reference Hill2002; Thiesset et al. Reference Thiesset, Duret, Ménard, Dumouchel, Reveillon and Demoulin2020)
 \begin{equation} \langle \bullet \rangle_\mathbb{S} = \frac{3}{4{\rm \pi} r^3} \iiint_\mathbb{S} \bullet r^2 \sin \theta\,\textrm{d} \theta\,\textrm{d} \varphi\,\textrm{d} r = \frac{3}{r^3} \int_0^r \langle \bullet \rangle_\varOmega r^2 \,\textrm{d}r. \end{equation}
2.3. Average along the inhomogeneity direction
Finally, a spatial average can further be performed. In our case, the latter operates on the  $Y$ direction and writes
 \begin{equation} \langle \bullet \rangle_\mathbb{Y} = \frac{2}{L_y} \int_\mathbb{Y} \bullet \,\textrm{d} Y \end{equation}
with  $\mathbb {Y} = \{ Y | -L_y/4 \leq Y \leq L_y/4 \}$ (
 $Y=0$ is located at the shear layer centreline). Using the gradient theorem, averaging over
 $\mathbb {Y}$ allows us simplifying the Y-Transfer terms as follows
 \begin{gather} \left\langle \partial_Y \left\langle \left(\sigma v'\right) \left(\delta \phi\right)^2 \right\rangle_{\mathbb{P}} \right\rangle_{\mathbb{Y}} = \left\langle \left(\sigma v'\right) \left(\delta \phi\right)^2 \right\rangle_{\mathbb{P}(Y = {L_y}/{4})} - \left\langle \left(\sigma v'\right) \left(\delta \phi\right)^2 \right\rangle_{\mathbb{P}(Y ={-}({L_y}/{4}))}, \end{gather}
 \begin{gather}\left\langle \partial_Y \left\langle \left(\sigma v'\right) \left(\delta \phi^\prime\right)^2 \right\rangle_{\mathbb{P}} \right\rangle_{\mathbb{Y}} = \left\langle \left(\sigma v'\right) \left(\delta \phi^\prime\right)^2 \right\rangle_{\mathbb{P}(Y = {L_y}/{4})} - \left\langle \left(\sigma v'\right) \left(\delta \phi^\prime\right)^2 \right\rangle_{\mathbb{P}(Y ={-}({L_y}/{4}))}. \end{gather}
2.4. Summary
In summary, roughly speaking, an angular (spatial) average enables studying the time/scale/space transport of liquid structures independently of their orientations (position in the flow). Consequently, these different averaging procedures have the advantage of reducing the problem complexity but this is automatically accompanied by a loss of information which can be summarized as follows.
(i)
 $\langle \bullet \rangle _{\mathbb {P}}$ leads to a problem in five dimensions, with argument list $(\boldsymbol {r}, Y, t)$. It corresponds to the more general version of the equations in the temporally evolving shear layer with $x$ and $z$ being the homogeneity directions.
(ii)
$\langle \bullet \rangle _{\mathbb {P}, \varOmega }$ yields a problem in three dimensions, with argument list $(r, Y, t)$, the information about the preferential orientation (anisotropy) of the liquid structures is lost.(iii)
$\langle \bullet \rangle _{\mathbb {P}, \varOmega , \mathbb {Y}}$ corresponds to a 2-D problem, with argument list $(r, t)$, the information about the locality within the flow is lost.


In the present paper, for the sake of pedagogy, we start by considering the most simplified version of the problem (angularly and spatially averaged budgets) and then successively lift some averaging operations up to the more general version of the two-point transport equations. Most of the present analysis is rendered feasible thanks to data from numerical simulations. In the following sections, we describe the simulation code and database.
3. Numerical simulations of liquid–gas shear flow
3.1. The ARCHER code
The liquid–gas shear flow is simulated using the high-performance-computing code ARCHER developed at the CORIA laboratory (Ménard, Tanguy & Berlemont Reference Ménard, Tanguy and Berlemont2007). It is based on the one-fluid formulation of the incompressible Navier–Stokes equation which is solved on a Cartesian mesh, viz.
 \begin{equation} \partial_t \rho \boldsymbol{u} + \boldsymbol{\nabla} \cdot \left( \rho \boldsymbol{u} \otimes \boldsymbol{u} \right) ={-} \boldsymbol{\nabla} p + \boldsymbol{\nabla} {\cdot} (2 \mu \boldsymbol{\mathsf{D}}) + \boldsymbol{f} + \gamma \mathcal{H} \delta_s \boldsymbol{n}. \end{equation}
Here,  $p$ is the pressure field,
 $\boldsymbol{\mathsf{D}}$ the strain rate tensor,
 $\boldsymbol {f}$ a source term,
 $\mu$ the kinematic viscosity,
 $\rho$ the density,
 $\gamma$ the surface tension,
 $\boldsymbol {n}$ the unit normal vector to the liquid–gas interface,
 $\mathcal {H}$ its mean curvature and
 $\delta _s$ is the Dirac function characterizing the location of the liquid–gas interface. For solving (3.1), the convective term is written in conservative form and solved using the improved Rudman (Reference Rudman1998) technique presented in Vaudor et al. (Reference Vaudor, Ménard, Aniszewski, Doring and Berlemont2017). The Sussman et al. (Reference Sussman, Smith, Hussaini, Ohta and Zhi-Wei2007) method is used to compute the viscous term. To ensure incompressibility of the velocity field, a Poisson equation is solved. The latter accounts for the surface tension force and is solved using a multigrid preconditioned conjugate gradient algorithm (Zhang Reference Zhang1996) coupled with a ghost-fluid method (Fedkiw et al. Reference Fedkiw, Aslam, Merriman and Osher1999).
A coupled level-set and volume-of-fluid solver is used for transporting the interface, the level-set function accurately describing the geometric features of the interface (its normal and curvature) and the volume-of-fluid function ensuring mass conservation. The density is calculated from the volume of fluid (or liquid volume fraction) as  $\rho = \rho _l \phi + \rho _g(1-\phi )$, where
 $\rho _l, \rho _g$ is the density of the liquid and gas phase. The dynamic viscosity (
 $\mu _l$ or
 $\mu _g$) depends on the sign of the level-set function. In cells containing both a liquid and a gas phase, a specific treatment is performed to evaluate the dynamic viscosity, following the procedure of Sussman et al. (Reference Sussman, Smith, Hussaini, Ohta and Zhi-Wei2007). For more information about the ARCHER solver, the reader can refer to e.g. Ménard et al. (Reference Ménard, Tanguy and Berlemont2007), Duret et al. (Reference Duret, Luret, Reveillon, Ménard, Berlemont and Demoulin2012) and Vaudor et al. (Reference Vaudor, Ménard, Aniszewski, Doring and Berlemont2017).
3.2. Numerical domain and flow features
The flow configuration is that of a planar liquid layer being sheared by a gas stream. The flow is directed towards the  $x$ axis, and
 $z$ denotes the spanwise and
 $y$ the vertical axis, respectively. The calculation domain is
 $L_x \times L_y \times L_z = 8 \times 4 \times 4\ \textrm {{cm}}^{3}$ in the streamwise, vertical and spanwise directions, respectively. The liquid and gas properties correspond to those of water and air at ambient pressure. The dynamic viscosity
 $\mu$ (
 $\textrm {kg}\ \textrm {m}^{-1}\ \textrm {s}^{-1}$) is
 $\mu _l = 1.0 \times 10^{-3}$ and
 $\mu _g = 1.8 \times 10^{-5}$ for the liquid and gas phases, respectively. The fluid density
 $\rho$ (
 $\textrm {kg}\ \textrm {m}^{-3}$) is
 $\rho _l = 1.0 \times 10^{3}$ and
 $\rho _g = 1.2$, respectively. The surface tension
 $\gamma = 0.072\ \textrm {N}\ \textrm {m}^{-1}$.
Close to the liquid–gas interface, an error function profile for the streamwise velocity  $u$ is initially prescribed and is given by
 \begin{equation} u(x,y,z) = \frac{u_g}{2} \left[1+ \text{erf} \left\{ 86.83 \left(\frac{y}{L_y} -\frac{1}{2} \right) \right\} \right]. \end{equation}
The spanwise  $w$ and vertical v velocity components
 $v(x,y,z) = w(x,y,z) = 0$.
 $u_g = 7.5 \ \textrm {m}\ \textrm {s}^{-1}$ denotes the maximum gas velocity. The constant
 $86.83$ corresponds to a vorticity thickness of
 $\delta _\omega = 1.15\ \textrm {{mm}}$. This was set so that the most unstable wavelength of the Kelvin–Helmholtz instability is expected to be half of
 $L_x$ and the spanwise Rayleigh–Taylor instability has a wavelength of approximately
 $L_z/6$ (Marmottant & Villermaux Reference Marmottant and Villermaux2004). These two modes were forced in the present simulation by superimposing on the liquid–gas interface a small sinusoidal perturbation with period
 $L_x/2$ and
 $L_z/6$ in the streamwise and spanwise directions, respectively. This was done to trigger the destabilization of the liquid layer and consequently reduce the overall computational time. The initialized level-set function
 $G$ was set as follows:
 \begin{equation} G(x,y,z) = \left(\frac{L_y}{2}-y\right) + \frac{L_y}{200} \left[ \sin \left(4 {\rm \pi}\frac{x}{L_x}\right) + \sin \left(12 {\rm \pi}\frac{z}{L_z}\right) \right]. \end{equation}
Periodic boundary conditions are used in the streamwise and spanwise direction. A no-slip boundary condition is applied to the bottom frontier while an outflow condition is used at the uppermost boundary of the calculation domain. The mesh size consisted of  $N_x \times N_y \times N_z = 512 \times 256 \times 256$ cells and 1024 processors were used. This corresponds to a cell size
 $\Delta x = \Delta y = \Delta z \approx 0.156\ \textrm {mm}$. The question of the adequacy of a given resolution depends on the physical quantity of interest. Indeed, the resolution needed for some large-scale quantities, such as the turbulent kinetic energy or the liquid volume fraction, to be grid independent is most likely not the same as the one needed for some small-scale quantities (e.g. the enstrophy) to be faithfully resolved. As emphasized in subsequent sections, the budgets given by (2.3a) and (2.3b) will be proved to be nicely closed proving that the present resolution is adequate, at least as far as the liquid–gas interface properties are concerned.
The initial Weber number based on the gas velocity  $u_g$ and the shear-layer vorticity thickness
 $\delta _\omega$ is
 $We_g = \rho _g u_g^2 \delta _\omega / \gamma = 1.08$. As per Taguelmimt, Danaila & Hadjadj (Reference Taguelmimt, Danaila and Hadjadj2016), we define the Reynolds number by use of the average dynamic viscosity, i.e.
 $Re =2 u_g \delta _\omega / (\nu _g + \nu _l) = 1078$.
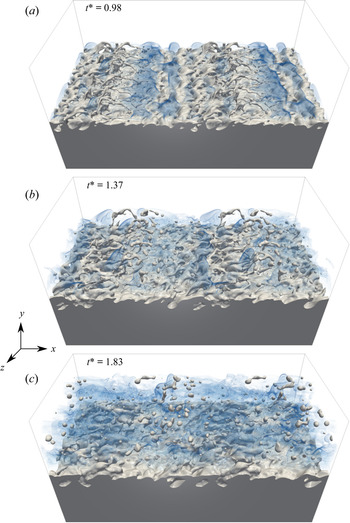
Typical snapshots of the flow simulation are presented in figure 2. The overall phenomenology of this flow is quite similar to what is commonly referred to as an air-assisted atomization process, as documented by e.g. Lasheras & Hopfinger (Reference Lasheras and Hopfinger2000), Marmottant & Villermaux (Reference Marmottant and Villermaux2004) and Fuster et al. (Reference Fuster, Matas, Marty, Popinet, Hoepffner, Cartellier and Zaleski2013). The rapid destabilization of the liquid–gas interface is observed to be followed by the oblique ejection of ligaments, which subsequently break into a myriad of droplets. Qualitatively, one observes that the degree of tortuousness of the liquid–gas interface is increasing from  $t^* = 0.98$ up to
 $t^* = 1.37$ and then becomes smoother at
 $t^* = 1.83$. Further, while liquid structures manifest mainly as ligaments at
 $t^* = 0.98$ and
 $t^* = 1.37$, some detached droplets are clearly identified at
 $t^* = 1.83$. The break-up mechanism thus occurs between
 $t^* = 1.37$ and
 $t^* = 1.83$. Still, at
 $t^* = 1.83$, the interface separating the liquid and gas phases located near the centreline of the shear layer is experiencing a relaxation mechanism most likely attributable to the increasing influence of surface tension relative to the decreasing shear rate. This flow configuration thus reveals some multi-scale features and a concomitant transport of the liquid phase in scale and flow position space. It is therefore a very nice candidate for being explored with two-point statistical equations. However, it is worth stressing that the present simulation reveals a much less complex physics than the one presented by e.g. Fuster et al. (Reference Fuster, Matas, Marty, Popinet, Hoepffner, Cartellier and Zaleski2013) and Ling et al. (Reference Ling, Fuster, Zaleski and Tryggvason2017, Reference Ling, Fuster, Tryggvason and Zaleski2019). Indeed, the liquid–gas interface being forced with perturbations of finite amplitude probably bypasses some mechanisms revealed in a striking manner by Ling et al. (Reference Ling, Fuster, Zaleski and Tryggvason2017, Reference Ling, Fuster, Tryggvason and Zaleski2019) using very detailed simulations. Here, the focus of the paper is mostly on discussing the potential of two-point statistics to extract some information about a given flow and we do not pretend that the simulation configuration presented here can be considered as representative of real liquid-sheet shear-induced atomization configurations.
Typical snapshots of the simulation. The flow is from left to right. The liquid–gas interface is initially perturbed with a sinusoidal pattern which promotes the destabilization of the flow, thereby reducing the overall computational cost. From (a–c)  $t^*= tL_x/u_g = 0.98, 1.37, 1.83$.

For assessing the two-point budgets which will be described in the subsequent section, we saved the velocity, the level-set and the volume of fluid fields for 90 time steps during the simulation, each separated by  $3.75\times 10^{-4}\ \textrm {s}$. This ensured that the time derivative terms were accurately estimated. Two-point statistics were computed using an in-house Python/Fortran code which makes use of a hybrid OpenMP–MPI parallelization. Structure functions were calculated in the range of scales
 $- L_y/2 \leq (r_x, r_y, r_z) \leq L_y/2$ so that the large-scale dynamics of the flow is well captured. This imposes the minimum and maximum reachable positions for the mid-point
 $Y$, as the coordinates
 $y^+ = \max (Y) + \max (r_y)/2$ and
 $y^- = \min (Y) + \min (r_y)/2$ should stay within the computational domain, i.e. stay within the interval
 $(-L_y/2 ; L_y/2)$. Choosing
 $- L_y/2 \leq (r_x, r_y, r_z) \leq L_y/2$, leads to
 $-L_y/4 \leq Y \leq L_y/4$ as represented in figure 3.
Representation of the maximum and minimum reachable positions for the mid-point  $Y$.

Contrary to Thiesset et al. (Reference Thiesset, Dumouchel and Ménard2019a, Reference Thiesset, Duret, Ménard, Dumouchel, Reveillon and Demoulin2020), the angular averages were here preferred to the spherical average. The reason is that  $\langle \bullet \rangle _\varOmega$ relies only on a double integral which, given the size of the present database, yields substantial reduction of the computational effort. This operation is performed as follows. First, each two-point quantity at a given plane
 $Y$ is interpolated from Cartesian
 $(r_x, r_y, r_z)$ to spherical coordinates
 $(r, \theta , \phi )$ using the radial basis function ‘Rbf’ algorithm of the SciPy-interpolation library. We employed a linear radial basis function. Then, the double integral was calculated using the ‘dblquad’ method of the SciPy-integration library. The overall database represents approximately 0.9 TB and approximately 250 000 CPU hours were necessary for the simulation and post-processing. Given this quite high number of computational resources, we considered here only one set of parameters. The library employed here to compute two-point statistics could be substantially optimized using the methodology described by Gatti et al. (Reference Gatti, Remigi, Chiarini, Cimarelli and Quadrio2019). Hence, we expect to be able, in the short term, to reduce significantly this amount of computational time to post-process larger simulation domains.
Instead of investigating an inhomogeneous and time-evolving shear layer, one could have thought of a simpler homogeneous configuration for which a steady state could have been possibly reached. The first that comes to mind is homogeneous sheared turbulence, as was recently addressed by Rosti et al. (Reference Rosti, Ge, Jain, Dodd and Brandt2019). This flow can potentially reach a steady state, hence the time derivative terms in (2.2a) and (2.2b) are zero. This flow is further homogeneous, i.e. the gradient of mean liquid volume fraction is zero and hence the two production terms in (2.2b) are zero. The transfer in  $\boldsymbol {X}$-space can also be proven to be zero using the Green–Ostrogradski theorem (see (B5) of Thiesset et al. Reference Thiesset, Duret, Ménard, Dumouchel, Reveillon and Demoulin2020). By difference, the only remaining term (the
 $r$-transfer) is also zero. Hence, homogeneous sheared two-phase flows leads to the very simple conclusion that all terms in the budget are zero. This conclusion is quite obvious given that a stationary flow configuration means that liquid structures have reached statistical equilibrium and hence there is no transfer between scales or between different positions within the flow. Consequently, this configuration, which is very common when dealing with shear turbulence, does not allow us to extract any relevant information about the statistical behaviour of liquid–gas shear turbulence. Note also that the steady state can only be achieved artificially in the case of a bounded numerical domain (e.g. Pumir Reference Pumir1996). Otherwise, the turbulent length scales and kinetic energy grow in time. Another configuration is Taylor–Couette flow, for which the presence of the wall on the upper and lower boundaries yields the exact same conclusions. In addition, it requires handling the interaction (the contact) between the liquid and the sliding walls, which could lead to numerical complexities. Because the present study focuses on the phase indicator (a scalar field), one can further think of a configuration similar to homogeneous scalar mixing in forced turbulence fed by a uniform scalar gradient (e.g. Yeung, Donzis & Sreenivasan Reference Yeung, Donzis and Sreenivasan2005, and references therein). Here again, a steady state is achieved only using a bounded domain. This additionally requires imposing a uniform liquid gradient in the domain, which appears hardly feasible numerically. In addition, since
 $\phi$ is a non-diffusive scalar, (there is no diffusion term in the transport equation for
 $\phi$), the dissipation of
 $\phi$ variance is zero. It is thus not even sure that, in this situation, the statistics of
 $\phi$ reach a steady state in bounded domains as there is no dissipative process (except maybe a surface tension effect) to compensate for
 $\phi$ scalar production. To conclude, all these configurations, though attractive, may reveal more drawbacks than advantages.
4. Physical interpretation of the phase indicator increments
We now aim at substantiating the physical meaning of the second-order structure of the phase indicator field. First, its relation to the more widely used correlation function is presented, allowing the large-scale limit of  $(\delta \phi )^2$ to be estimated. Secondly, the two-point statistics are interpreted in terms of disjunctive union of sets, thereby providing a graphical representation for this quantity. Next, light is shed on the small-scale limit of the second-order structure function which is extended to anisotropic, inhomogeneous media and validated for synthetic fields and the shear-layer data. Finally, the relation between the transport equation for the two-point statistics and the surface density is highlighted.
4.1. Relation to the correlation function
Straightforward calculations allow us to write the second-order structure function in terms of the correlation function, viz.
 \begin{equation} \left\langle(\delta \phi)^2 \right\rangle_{\mathbb{E}} = \left\langle\phi^2(\boldsymbol{x}^+ ) \right\rangle_{\mathbb{E}} + \left\langle\phi^2(\boldsymbol{x}^- ) \right\rangle_{\mathbb{E}} - 2 \left\langle\phi(\boldsymbol{x}^+ )\phi(\boldsymbol{x}^- ) \right\rangle_{\mathbb{E}}. \end{equation}
The right-most term on the right-hand side of (4.1) is the correlation function of the phase indicator. It is worth stressing that this is not the first time that the correlation function of the indicator function has been defined. Indeed, it is widely used for characterizing porous media (Debye, Anderson Jr & Brumberger Reference Debye, Anderson and Brumberger1957; Adler, Jacquin & Quiblier Reference Adler, Jacquin and Quiblier1990; Torquato Reference Torquato2002, to cite but a few), colloids (Grimson Reference Grimson1983) and fractal aggregates (Sorensen Reference Sorensen2001). For all these physical situations, it is used as an indicator of the geometrical features of the pore or aggregate structure. The correlation function of the phase indicator can also be experimentally measured through the use of small-angle-scattering techniques, which opens up nice perspectives in the context of two-phase flows. This remains far beyond the scope of the present study.
Equation (4.1) reveals that, for a homogeneous medium, i.e. for which  $\langle \phi ^2(\boldsymbol {x}^+ ) \rangle _{\mathbb {E}} = \langle \phi ^2(\boldsymbol {x}^- ) \rangle _{\mathbb {E}} = \langle \phi \rangle _{\mathbb {E}}$, the large-scale limit of the phase indicator structure function is (see Thiesset et al. Reference Thiesset, Duret, Ménard, Dumouchel, Reveillon and Demoulin2020)
 \begin{equation} \lim_{r \to \infty} \langle (\delta \phi)^2 \rangle_{\mathbb{E}} = 2 \langle \phi \rangle_{\mathbb{E}} - 2\langle \phi \rangle_{\mathbb{E}}^2 = 2 \langle \phi \rangle_{\mathbb{E}} (1-\langle \phi \rangle_{\mathbb{E}}). \end{equation}
This can be readily demonstrated by recalling that the correlation function  $\langle \phi (\boldsymbol {x^+}) \phi (\boldsymbol {x^-}) \rangle _{\mathbb {E}}$ asymptotes to the value
 $\langle \phi \rangle _{\mathbb {E}}^2$ at large scales (Fitzhugh Reference Fitzhugh1983). In very diluted media, i.e.
 $\langle \phi \rangle _{\mathbb {E}} \ll 1$, the limit value at large scales is thus
 $2\langle \phi \rangle _{\mathbb {E}}$. In the inhomogeneous case, it depends on the volume fraction at points
 $\boldsymbol {x^+}$ and
 $\boldsymbol {x^-}$ and on the way the autocorrelation
 $\langle \phi (\boldsymbol {x^+}) \phi (\boldsymbol {x^-}) \rangle _{\mathbb {E}}$ varies with respect to
 $\boldsymbol {r}$. It is not even sure that, in this situation,
 $\langle (\delta \phi )^2 \rangle _{\mathbb {E}}$ tends towards a plateau at large scales. Hence, the physical interpretation of the large-scale limit of
 $\langle (\delta \phi )^2 \rangle$ in inhomogeneous cases is much more complex. In what follows, we present a simple case where the limit at large scales can be obtained even though the medium is inhomogeneous.
4.2. Geometrical representation of the phase indicator two-point statistics
Further,  $(\delta \phi )^2 (\boldsymbol {X}, \boldsymbol {r})$ can be interpreted by resorting to some geometrical reasoning. From the definition of
 $(\delta \phi )^2 (\boldsymbol {X}, \boldsymbol {r})$ and figure 1, one easily remarks that, when the points
 $\boldsymbol {x}^+$ and
 $\boldsymbol {x}^-$ lie together within the liquid or gas phase, then
 $(\delta \phi )^2$ is zero. On the contrary,
 $(\delta \phi )^2$ is activated as soon the phases found at the two points
 $\boldsymbol {x}^+$ and
 $\boldsymbol {x}^-$ are different. Consequently,
 $(\delta \phi )^2$ measures the scale/space distribution of jumps between the two phases.
Further insights into the physical meaning of the structure and correlation functions can be gained by recalling that the spatial average over  $\boldsymbol {x}$ of the correlation function
 $\phi (\boldsymbol {x}) \phi (\boldsymbol {x} + \boldsymbol {r})$ is the convolution of
 $\phi (\boldsymbol {x})$ with its translated version at a distance
 $\boldsymbol {r}$,
 $\phi (\boldsymbol {x}+ \boldsymbol {r})$ (Sorensen Reference Sorensen2001). Geometrically, it thus reads as the intersection of the ensemble
 $E^- = \{ \boldsymbol {x} \in \mathbb {R} | \phi (\boldsymbol {x}) = 1 \}$ with the ensemble
 $E^+=\{ \boldsymbol {x} \in \mathbb {R} | \phi (\boldsymbol {x} + \boldsymbol {r})=1 \}$, which can conveniently be written
 $E^- \cap E^+$. Analogously, the spatially averaged structure function of
 $\phi$ can be defined as the symmetric difference (disjunctive union) of the ensemble
 $E^-$ with the ensemble
 $E^+$, or
 $E^- \triangle E^+$.
This is illustrated in figure 4 in the case of a single closed set. It is seen that, when  $|\boldsymbol {r}| \to 0$, the structure function (orange zones) tends to zero while the correlation function (green zones) is equal to the volume of
 $E^-$, which is here
 $\langle \phi \rangle _{\mathbb {R}}$. When the separation
 $|\boldsymbol {r}|$ is larger than the extent of
 $E^-$, the opposite is observed: the correlation function is zero while the structure function is equal to the volume of
 $E^-$ plus the volume of
 $E^+$, i.e. twice the volume of
 $E^-$, or
 $2 \langle \phi \rangle _{\mathbb {R}}$. As said previously for homogeneous cases, the structure function tends towards
 $2\langle \phi \rangle _{\mathbb {R}}(1-\langle \phi \rangle _{\mathbb {R}})$ at large scale. For the case presented in figure 4, there is only one structure surrounded by an arbitrarily large volume, and hence
 $\langle \phi \rangle _{\mathbb {R}} \ll 1$ so that the structure function tends towards a plateau whose value is obtained by the limit
 $2\langle \phi \rangle _{\mathbb {R}}(1-\langle \phi \rangle _{\mathbb {R}}) \to 2 \langle \phi \rangle _{\mathbb {R}}$.
Graphical representation of the spatially averaged phase indicator correlation function (green) and structure function (orange) given  $\phi (\boldsymbol {x})$ (blue) and
 $\phi (\boldsymbol {x}+\boldsymbol {r})$ (yellow).

For intermediate scales, the intersection and symmetric difference of  $E^-$ with
 $E^+$ depends on the morphology of the media under consideration. For instance, it is extremely well known from the literature dedicated to porous media that the two-point statistics of the phase indicator are often used to assess information about the tortuousness of the interface (Adler et al. Reference Adler, Jacquin and Quiblier1990; Torquato Reference Torquato2002, and references therein). Similarly, the fractal facets of aggregates are often appraised by use of correlation function of the phase indicator at intermediate scales (see e.g. Sorensen Reference Sorensen2001). In particular, Morán et al. (Reference Morán, Fuentes, Liu and Yon2019) showed that, when increasing the ratio between the largest scales (the aggregate radius of gyration) and the smallest scales (the radius of the primary particle), the correlation function reveals an increasing range of scales complying with a fractal scaling (a power law). When several structures are present, it also depends on the way the different liquid structures are organized in space.
When  $|\boldsymbol {r}|$ is small, figure 4 reveals that
 $E^- \triangle E^+$ delineates the contours of
 $E^-$. It is thus expected that
 $(\delta \phi )^2 (\boldsymbol {X}, \boldsymbol {r})$ is related to the surface area for small values of the separation
 $r$. A more specific discussion on this aspect is detailed in the next subsections.
To summarize, the phase indicator correlation function provides information about the liquid volume, morphology/tortuousness and surface area at large, intermediate and small scales, respectively. In this regard, two-point statistics of the phase indicator field thus appear as a nice candidate for asserting the multi-scale features of the liquid/gas interface. In the next subsections, we provide more details on this aspect.
4.3. Small-scale expansion of the structure function
In Thiesset et al. (Reference Thiesset, Duret, Ménard, Dumouchel, Reveillon and Demoulin2020), the authors came up with the fortunate observation that, in the limit of small  $|\boldsymbol {r}|$,
 \begin{equation} \lim_{r \to 0} \langle (\delta \phi)^2 \rangle_{\mathbb{R},\mathbb{S}} \propto \langle \varSigma \rangle_{\mathbb{R}} r, \end{equation}
where  $\langle \varSigma \rangle _{\mathbb {R}}$ is the surface density defined as the amount of surface of the liquid–gas interface within the computational domain
 $\mathbb {R} \in \{ X,Y,Z \}$. Therefore, it appears that
 $(\delta \phi )^2$ contains information about the geometry of the liquid–gas interface, namely its surface area. Here again, this observation should be interpreted in the light of previous works dedicated to heterogeneous media.
In this respect, the wide literature pertaining to porous media (Torquato Reference Torquato2002, for instance) discusses in great detail the relationship between the small-scale limit of the correlation function and the surface density. This question dates back to the work by Debye et al. (Reference Debye, Anderson and Brumberger1957), who addressed the special case of isotropic and homogeneous fields, for which correlation functions depend only on  $r = |\boldsymbol {r}|$. Once written in terms of the second-order structure function, they proved that
 \begin{equation} \lim_{r \to 0} \langle (\delta \phi) ^2\rangle_\mathbb{E} = \frac{\langle \varSigma \rangle_{\mathbb{E}} r}{2}. \end{equation}
Equation (4.4) can be readily derived using the same methodology as the one used to solve the Buffon needle problem. Hence, the derivation is quite straightforward. Later, Kirste & Porod (Reference Kirste and Porod1962) and Frisch & Stillinger (Reference Frisch and Stillinger1963) extended the analysis to the next order and proved that, for isotropic–homogeneous media, and by further assuming that the interface separating the two phases is of class  $C^2$
 \begin{equation} \langle (\delta \phi) ^2\rangle_\mathbb{E} = \frac{\langle \varSigma \rangle_{\mathbb{E}} r}{2} \left[ 1- \frac{r^2}{8} \left( \langle \mathcal{H}^2\rangle_{0, \mathbb{E}} - \frac{\langle \mathcal{G}\rangle_{0, \mathbb{E}}}{3} \right) \right] + {O}(r^5). \end{equation}
Here,  $\mathcal {H}$ and
 $\mathcal {G}$ are the mean and Gaussian curvatures, respectively, and
 $\langle \bullet \rangle _{0, \mathbb {E}}$ denotes an area weighted average. Note that there is no square terms in (4.5). Ciccariello (Reference Ciccariello1995) showed that for smooth surfaces, all even-order terms in the expansion of
 $\langle (\delta \phi ) ^2\rangle$ with respect to
 $r$ vanish. Wu & Schmidt (Reference Wu and Schmidt1971) and Ciccariello (Reference Ciccariello1995) provided the next
 $r^5$ and
 $r^7$ terms in the expansion, which are not added here for the sake of simplicity.
When the medium is anisotropic yet homogeneous, Berryman (Reference Berryman1987) proved that (4.4) remains valid when the (anisotropic) correlation function is angularly averaged. To better understand this result, it is worth noting that, since the geometrical variables appearing in (4.5) are intrinsic to the interface, they are invariant to rotation and translation. The angular average can thus be thought of as being equivalent to an average operation over several randomly oriented structures characterized by the same surface density and curvature. Similarly, the spatial average is equivalent to calculating an average over several randomly located, yet geometrically equivalent, structures. Therefore, it is worth testing if the third-order expansion (4.5), which was derived rigorously for isotropic homogeneous media, applies to anisotropic inhomogeneous media after application of an angular and a spatial average.
4.4. Assessment of geometrical measures using synthetic fields
For doing this, we consider the simple toy model of a spheroid characterized by its eccentricity  $e = \sqrt {1-(a/c)^2}$ (
 $a$ is the semi-axis and
 $c$ is the distance from centre to pole), placed in the centre of a domain. We consider different values for the eccentricity
 $e= 0\,\%, 58\,\%, 70\,\%, 87\,\%$ by modifying the value of
 $c$ while keeping
 $a$ constant. This obviously results in different degrees of anisotropy. In addition, the spheroid being placed at the centre of a wider domain, the field is also inhomogeneous. Two-point statistics are obtained by averaging over space
 $\mathbb {R} = \{ X,Y,Z \}$ and further angularly averaged as per (2.4). Results are presented in figure 5. It is observed that, at small scales, spatially and angularly averaged structure functions perfectly match the ‘homogenized’ and ‘isotropized’ version of (4.5) which writes
 \begin{equation} \langle (\delta \phi) ^2\rangle_{\mathbb{R}, \varOmega} = \frac{\langle \varSigma \rangle_{\mathbb{R}} r}{2} \left[ 1- \frac{r^2}{8} \left( \langle \mathcal{H}^2\rangle_{0,\mathbb{R}} - \frac{\langle \mathcal{G}\rangle_{0,\mathbb{R}}}{3} \right) \right] + {O}(r^5). \end{equation}
The area weighted Gaussian curvature was here estimated by use of the Gauss–Bonnet theorem, i.e.  ${S_{sph}}\langle \mathcal {G}\rangle _{0,\mathbb {R}} = 4 {\rm \pi}$, where
 $S_{sph}$ is the surface area of a spheroid. The value of
 $\langle \mathcal {H}^2\rangle _{0,\mathbb {R}}$ was estimated numerically by using the routines described by Essadki et al. (Reference Essadki, Drui, Larat, Ménard and Massot2019) and Di Battista et al. (Reference Di Battista, Bermejo-Moreno, Ménard, de Chaisemartin and Massot2019) now available through the project Mercur(v)e (http://docs.mercurve.rdb.is/). Further, when increasing the eccentricity, both the slope at small scales (recall that
 $a$ is kept constant) and the limiting value at large
 $r$ increase. Figure 5 further shows that (4.6) holds very nicely up to a separation
 $r \approx 2 a$. Kirste & Porod (Reference Kirste and Porod1962) and Frisch & Stillinger (Reference Frisch and Stillinger1963) proved that (4.5) should hold up to a separation
 $r$ equal to twice the ‘reach’ of the surface, the ‘reach’ being defined as the minimal normal distance from the surface to the medial axis (Federer Reference Federer1959). In the present case, the latter is close to
 $a$. It is also verified that the second-order structure function can be used to estimate the geometrical properties of the liquid field, namely its volume (limit at large
 $r$ which is
 $2\langle \phi \rangle _{\mathbb {R}}$), its surface density (first-order expansion at small scales) and a measure of surface curvature
 $\langle \mathcal {H}^2\rangle _{0,\mathbb {R}} - {\langle \mathcal {G}\rangle _{0,\mathbb {R}}}/{3}$ (third-order expansion at small scales). Results are gathered in table 1, where estimates obtained by the structure function perfectly match those obtained either analytically (volume, surface area and area weighted Gaussian curvature) or numerically (for
 $\langle \mathcal {H}^2 \rangle _{0,\mathbb {R}}$) using the routines of Essadki et al. (Reference Essadki, Drui, Larat, Ménard and Massot2019) and Di Battista et al. (Reference Di Battista, Bermejo-Moreno, Ménard, de Chaisemartin and Massot2019). The maximum error is for
 $\langle \mathcal {H}^2\rangle _{0,\mathbb {R}} - {\langle \mathcal {G}\rangle _{0,\mathbb {R}}}/{3}$, for which the departure from the theoretical prediction is very limited (approximately 1 %). The surface area and volume are within less than a per cent.
Angularly averaged structure functions of the phase indicator field for prolate spheroids with different eccentricities (anisotropies)  $e = \sqrt {1-(a/c)^2} = 0\,\%, 58\,\%, 70\,\%, 87\,\%$ (
 $a$ is the semi-axis and
 $c$ is the distance from centre to pole). Symbols corresponds to the direct estimation and lines are given by (4.6).

Comparison of theoretical values for the volume, surface density and curvature (bold font) to those inferred from the limiting behaviour of  $\langle (\delta \phi )^2\rangle _\mathbb {R}$ at either large or small scales (normal font). The error is given within the parantheses.

Equation (4.6) is further tested for a planar geometry ( $\mathcal {G}=0$) with two facing interfaces perturbed with a controlled multi-scale sinusoidal perturbation. We have considered four cases, with (a) one, (b) three, (c) four and (d) five forcing wavelengths, respectively. For case (a), the period is equal to
 $L_x$, for (b) the periods are
 $L_x$,
 $2L_x$ and
 $4L_x$. For (c), we had a fourth sinusoid with period
 $8L_x$. For (d), a fifth wavelength is added with period equal to
 $16L_x$. Their respective amplitudes are kept constant (
 $\equiv L_y/64$) and their phases are shifted by
 $2 {\rm \pi}/ 10$. The resulting phase indicator fields are portrayed in figure 6. It is readily shown that increasing the number of sinusoids increases the tortuousness and the scale content of the interface. It also results in a decrease of the reach of the media, i.e. the minimal normal distance from surface to the medial axis decreases. Hence, it is expected that the range of scales over which (4.6) applies shortens from (a) to (d).
(a–d) The phase indicator field of four sinusoidally perturbed media and (e) their respective angularly averaged structure functions. The dashed lines correspond the numerical estimation of the scale distribution and the full lines represent the theoretical expression given by (4.6).

The angularly averaged second-order structure functions for these four fields are portrayed in figure 6. We have made the choice of normalizing the separation  $r$ by the surface density to appraise the scaling
 $\langle (\delta \phi )^2\rangle _{\mathbb {R}, \varOmega }$ at small scales. Scrutinizing this particular range of scales, one observes that the collapse is very well satisfied, proving again that the first-order expansion of (4.6) applies well. Pushing the analysis to the third order, figure 6 reveals that (4.6) applies satisfactorily for case (a) and (b) and over a narrower portion of scales when moving from case (c) to (d). This simply translates to the diminution of the reach.
Travelling along larger scales where (4.6) no longer applies, the different curves depart from each other when increasing the tortuousness of the interface. This indicates that, as expected, the structure function contains information about the morphology of the media under consideration which differs significantly from case (a) to case (d). We also point out that increasing the scale content of the interface (the number of sinusoids), results in broader distributions of  $\langle (\delta \phi ) ^2\rangle _{\mathbb {R}, \varOmega }$. This shows that the second-order structure function has great potential for appraising the multi-scale features of heterogeneous media and thus appears to be a nicely tailored tool for characterizing two-phase flows in particular.
In summary, using synthetic fields, we have emphasized a close relationship between the second-order structure functions at small scales and the geometrical properties of the interface (surface area and curvatures). At very large scales, it provides a measure of liquid volume. At intermediate scales (larger than the reach but smaller than the extent of the typical liquid structures), the structure function provides information about the morphology of the medium and its scale content. Therefore, the reach of the surface plays an important role here as it separates the range of scales for which geometry applies (viz.  $\varSigma$,
 $\mathcal {H}$ and
 $\mathcal {G}$ together with (4.6) are sufficient to describe the media under consideration) and the range of scales for which two-point statistics become a morphological descriptor (Torquato Reference Torquato2002) for which both the geometry and the additional information about the medial axis are required for the structure to be characterized. For scales larger than the reach, the separation
 $r$ should be referred to as the morphological parameter, as is generally done in morphological analysis using e.g. integral geometrical measures (Minkowski functional) of parallel sets (Arns, Knackstedt & Mecke Reference Arns, Knackstedt and Mecke2004).
By virtue of (2.5), (4.6) implies
 \begin{equation} \langle (\delta \phi) ^2\rangle_{\mathbb{R}, \mathbb{S}} = \frac{3 \langle \varSigma \rangle_\mathbb{R} r}{8} \left[ 1- \frac{r^2}{12} \left( \langle \mathcal{H}^2\rangle_{0, \mathbb{R}} - \frac{\langle \mathcal{G}\rangle_{0, \mathbb{R}}}{3} \right) \right] + {O}(r^5). \end{equation}
In Thiesset et al. (Reference Thiesset, Duret, Ménard, Dumouchel, Reveillon and Demoulin2020), it was observed that a prefactor of  $1/3$ should be preferably used in (4.7) instead of the value of
 $3/8$. The origin of this difference was not yet explained. By re-analysing the data of Thiesset et al. (Reference Thiesset, Duret, Ménard, Dumouchel, Reveillon and Demoulin2020), it appeared that this difference is attributed to the post-processing procedure and particularly an imprecise estimation of spherical averages at small scales. Indeed, in Thiesset et al. (Reference Thiesset, Duret, Ménard, Dumouchel, Reveillon and Demoulin2020), use was made of a simple (and computationally light) linear interpolation for transforming two-point statistics from Cartesian to spherical coordinates which was the source of the error. Here, the radial basis function algorithm is used instead with a much more accurate estimation, thereby confirming that the prefactor in (4.7) is indeed
 $3/8$.
Another difference between the present work and that of Thiesset et al. (Reference Thiesset, Duret, Ménard, Dumouchel, Reveillon and Demoulin2020) is the scalar field which is employed as being representative of the liquid phase. Thiesset et al. (Reference Thiesset, Duret, Ménard, Dumouchel, Reveillon and Demoulin2020) considered the two-point equation for the liquid volume fraction whereas, here, the phase indicator is used instead. The latter field can take only 0 or 1 values while the former can take any value between 0 and 1 in cells containing an interface. When the mesh cell size goes to zero, the liquid volume fraction tends to the phase indicator. The motivation for the choice of phase indicator is that comparisons are here made with some theoretical elaborations (Berryman Reference Berryman1987; Kirste & Porod Reference Kirste and Porod1962; Frisch & Stillinger Reference Frisch and Stillinger1963) pertaining to porous media, whose description is made on the basis of the phase indicator but not the (solid) volume fraction. Another argument in favour of the colour-function field is the dependence of the two-point statistics of the liquid volume fraction field on the numerical resolution. For more details on this aspect, the reader is referred to the technical report of Thiesset & Poux (Reference Thiesset and Poux2020).
4.5. Assessment of geometrical measures in the shear layer
Equation (4.6) can further be generalized by lifting the spatial average. In this case,  $\langle (\delta \phi )^2 \rangle _\varOmega$ is expected to relate to the local values of
 $\varSigma , \mathcal {H}^2 , \mathcal {G}$. For the shear-layer flow considered in the present study, this can be written as
 \begin{equation} \langle (\delta \phi) ^2\rangle_{\mathbb{P}, \varOmega} = \frac{\langle \varSigma \rangle_{\mathbb{P}} r}{2} \left[ 1- \frac{r^2}{8} \left( \langle \mathcal{H}^2\rangle_{0, \mathbb{P}} - \frac{\langle \mathcal{G}\rangle_{0, \mathbb{P}}}{3} \right) \right] + {O}(r^5), \end{equation}
where  $\langle \varSigma \rangle _{\mathbb {P}}$,
 $\langle \mathcal {H}^2\rangle _{0, \mathbb {P}}, \langle \mathcal {G}\rangle _{0, \mathbb {P}}$, which depend on
 $Y$ and
 $t$, are respectively the surface density, the area weighted average of
 $\mathcal {H}^2$ and
 $\mathcal {G}$ within a volume of size
 $L_x L_z \Delta y$.
In figure 7 we compare the values of  $\langle \varSigma \rangle _{\mathbb {P}}$ as estimated directly from the zero level-set surface (we used the routines described by Di Battista et al. Reference Di Battista, Bermejo-Moreno, Ménard, de Chaisemartin and Massot2019; Essadki et al. Reference Essadki, Drui, Larat, Ménard and Massot2019) or from the limit to small scales of
 $2 \langle (\delta \phi ) ^2\rangle _{\mathbb {P}, \varOmega }/r$. The agreement is nearly perfect, with the absolute difference within less than a per cent, confirming that (4.8) holds with a very nice degree of confidence. The agreement is also verified for the spatially averaged values of
 $\langle \varSigma \rangle _{\mathbb {P}, \mathbb {Y}}$. Again, the difference between the two methods is within a per cent (see figure 7). Here, the analysis was carried out only for the first-order expansion of (4.8) and did not incorporate the dependence on the
 $r^3$ term. The reason is that the flow is populated by some rather small liquid structures with a small local radius of curvature. Hence, since (4.8) is expected to hold up to a separation
 $r/2$ smaller than the smallest radius of curvature, the present numerical resolution was not sufficient for efficiently assessing the
 $r^3$ scaling of the second-order structure function. This could be done in future work using a refined simulation.
Values of  $\langle \varSigma \rangle _{\mathbb {P}}$ and
 $\langle \varSigma \rangle _{\mathbb {P}, \mathbb {Y}}$ as estimated either from the tessellation of the zero level surface (dashed grey curve) or from the limit of the second-order structure function (full line). The grey dash-dotted line in (a) and the circles in (b) illustrate the three typical snapshots used to compute the scale space budgets.

4.6. Transport equation for the surface density
Since, at small scales,  $\langle (\delta \phi )^2 \rangle _\varOmega$ is proportional to the surface density, the angular average of (2.2a) should approach the transport equation for the surface density when
 $r \to 0$. The latter written by Pope (Reference Pope1988), Candel & Poinsot (Reference Candel and Poinsot1990) and Drew (Reference Drew1990) was
 \begin{equation} \partial_t \varSigma + \boldsymbol{w} \cdot \boldsymbol{\nabla}_{\boldsymbol{x}} \varSigma = \mathcal{K} \varSigma, \end{equation}
where  $\mathcal {K}$ is the stretch rate, which for a liquid–gas interface in an incompressible flow is equal to the tangential strain rate
 $\boldsymbol {\nabla _t} \boldsymbol {\cdot } \boldsymbol {u}_t$, where
 $\boldsymbol {u}_t$ is the tangential velocity at the interface and
 $\boldsymbol {\nabla _t}$ is the surface gradient (Giannakopoulos et al. Reference Giannakopoulos, Frouzakis, Mohan, Tomboulides and Matalon2019). Here,
 $\boldsymbol {w}$ is the velocity of the interface, which is equal to the velocity at the interface
 $\boldsymbol {u}$ when there is no phase change. Since
 $\sigma \boldsymbol {u} \to \boldsymbol {u}$ and
 $\boldsymbol {\nabla }_{\boldsymbol {X}} \to \boldsymbol {\nabla }_{\boldsymbol {x}}$ as
 $r \to 0$, the transfer in
 $\boldsymbol {X}$-space tends to
 $\boldsymbol {u} \cdot \boldsymbol {\nabla }_{\boldsymbol {x}} \varSigma$, i.e. the convective term in (4.9). Consequently, the limit towards small scales of the
 $\boldsymbol {r}$-transfer term corresponds to the right-hand side of (4.9). In other words, at small scales, the transfer term is proportional to the stretch rate
 $\mathcal {K}$. A similar conclusions was drawn by Thiesset et al. (Reference Thiesset, Duret, Ménard, Dumouchel, Reveillon and Demoulin2020) using different arguments. This again reinforces the conclusion of Thiesset et al. (Reference Thiesset, Duret, Ménard, Dumouchel, Reveillon and Demoulin2020) that the stretch rate plays for the phase indicator field (a non-diffusive scalar) the same role as the scalar dissipation rate in diffusive scalar turbulence. Pushing the analysis to the third order, one expects the transport equation for
 $\langle \mathcal {H}^2\rangle - {\langle \mathcal {G}\rangle }/{3}$ to be recovered. Hence, the two-point equation for the phase indicator embeds the transport equation for both the surface density and a measure of the surface curvatures.
5. Results for the total field
We now explore the contribution of the different terms of the scale/space/time budget of the total field (2.3a).
5.1. Spatially and angularly averaged budget
We start by studying the budget after applying the angular (2.4) and spatial averages (2.6). Recall that, by doing so, the different terms have argument list  $(r,t)$ and thus light is shed on the scale and time dependence of the transport of liquid. The information about the vertical position within the shear layer and the orientation of the liquid structures are hidden.
Results are presented in figure 8 for three typical snapshots during the simulation. These were selected because they are typical of the surface density production period ( $t^*= t L_x/u_g = 0.98$), the period of maximum surface density (
 $t^* =1.37$) and the relaxation period (
 $t^*=1.83$), respectively (see figures 2 and 7).
Angularly and spatially averaged budgets of the total phase indicator field for the three snapshots displayed in figures 2 and 7. From (a–c) the production period ( $t^*=0.98$), the maximum surface density (
 $t^*=1.37$) and the relaxation period (
 $t^*=1.83$). The inset represents a closer look at small scales of the
 $r$-transfer term.

By comparing in figure 8 the time derivative term to the right-hand side of (2.3a), it first becomes evident that the budget is accurately closed. This is a stringent test which ensures that the simulation resolution and post-processing methods are adequate.
A careful examination of figure 8 further reveals that, in the range of scales  $r \lesssim 0.15L_x$, the transfer in
 $Y$-space is negligible (if not zero) compared to the one in
 $r$-space. By virtue of (2.7), this is due to the flux
 $\langle (\sigma v') (\delta \phi )^2 \rangle _{\mathbb {P}}$ at the plane
 $Y = - L_x/4$ being almost (if not strictly) equal to the flux at
 $Y=L_x/4$. Therefore, over this range of scales, the angularly and spatially average budget (2.3a) can be approximated by that of a homogeneous flow, the configuration explored by Thiesset et al. (Reference Thiesset, Duret, Ménard, Dumouchel, Reveillon and Demoulin2020). When not zero, the
 $Y$-transfer term is negative, meaning that the flux
 $\langle (\sigma v') (\delta \phi )^2 \rangle _{\mathbb {P}}$ flowing through the plane
 $Y=L_x/4$ is slightly larger than the one crossing
 $Y=-L_x/4$. In other words, when averaged over the set
 $\mathbb {Y} = \{ Y | -L_y/4 \leq Y \leq L_y/4 \}$, the
 $Y$-transfer term evidences a net transport of liquid in the direction of positive
 $Y$, i.e. in the upward direction. At scales
 $r \gtrsim 0.15L_x$, the
 $Y$-transfer term is of same amplitude as the
 $r$-transfer term with opposite sign, and thus the time derivative term tends to zero at large scales. This means that the quantity
 $\langle (\delta \phi )^2\rangle _{\mathbb {P}, \mathbb {Y}, \varOmega }$ is conserved when
 $r \to \infty$. The same deduction was carried out in the homogeneous configuration studied by Thiesset et al. (Reference Thiesset, Duret, Ménard, Dumouchel, Reveillon and Demoulin2020).
Let us now focus on the scale/time evolution of the  $r$-transfer term displayed in figure 8. This term is found to be positive over almost the whole range of scales and irrespective of the investigated time. This indicates that, on average, the transfer between the different scales is directed towards small scales, following a direct cascade mechanism. The
 $\boldsymbol {r}$-transfer term peaks at scales
 $r \approx 0.03, 0.05, 0.08 L_x$ at times
 $t^* = 0.98, 1.37, 1.83$, respectively, meaning that the cascade process is maximum at these scales. The time evolution of the peak location could be related to the increase of the shear-layer thickness. However, we do not yet have any physical argument for proving this.
By carefully scrutinizing around  $r \to 0$ (see the inset of figure 8), it further appears that the slope of the
 $\boldsymbol {r}$-transfer term, which provides information about the stretch rate, is positive, approximately zero and negative at
 $t^* = 0.98, 1.37, 1.83$, respectively. This yields a time evolution of
 $\langle (\delta \phi )^2\rangle _{\mathbb {P}, \mathbb {Y}, \varOmega }$ at small scales in agreement with the evolution of
 $\langle \varSigma \rangle _{\mathbb {P},\mathbb {Y}}$ where at
 $t^* = 0.98$ the surface area is increasing, then at
 $t^*= 1.37$ the surface density is maximum and finally at
 $t^*= 1.83$ the surface area starts decreasing (see figure 7). At
 $t^*= 1.83$, the narrow portion of scales (
 $r \lesssim 0.02L_x$) where the
 $\boldsymbol {r}$-transfer term is negative while larger scales follow a direct cascade mechanism, suggests that, while the largest scales continue transferring the ‘energy’ towards the small scales, a small portion of the smallest scales start relaxing into liquid structures of larger size. This inverse cascade mechanism was found to dominate in decaying liquid/gas turbulence (Thiesset et al. Reference Thiesset, Duret, Ménard, Dumouchel, Reveillon and Demoulin2020) and was attributed to the prominent role of merging and relaxation by the capillarity effect of liquid structures. By analogy, it is likely that, in the shear layer, this negative
 $\boldsymbol {r}$-transfer at small scales is attributable to the effect of surface tension which acts in ‘sphericalizing’ some elongated liquid structures of typical size less than
 $0.02L_x$.
5.2. Angularly averaged budget
We now turn our attention to the evolution of the different terms of (2.3a) with the average over the inhomogeneity direction  $Y$ being lifted. The dependence on the orientation of the vector
 $\boldsymbol {r}$ remains hidden by the application of the angular average. The terms now depend on three arguments
 $(Y, r, t)$. Recall that the centreline of the shear layer is located at
 $Y=0$. Results are presented again for
 $t^*=0.98, 1.37, 1.83$ in figure 9 and discussed below.
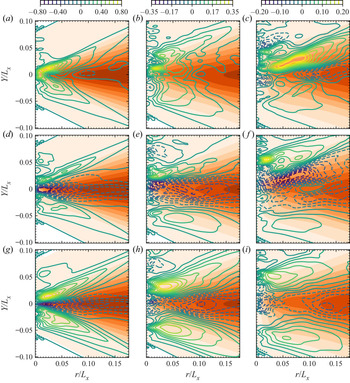
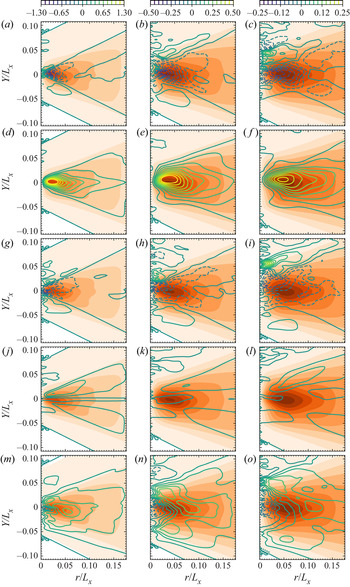
Terms of the angularly averaged budget of the total phase indicator field. The orange filled contours represent  $\langle (\delta \phi )^2\rangle _{\mathbb {P},\varOmega }$ (light to dark corresponds to values from 0 to 1). The coloured lines correspond to the contours of the different terms normalized by
 $u_g/L_x$. Positive (negative) values are displayed by full (dashed) lines. From left to right:
 $t^*=0.98, 1.37, 1.83$; (a–c)
 $r$-transfer term, (d–f)
 $Y$-transfer term, (g–i) time derivative term.

It is again observed that, for the majority of scales and irrespective of  $t^*$, the
 $r$-transfer term is positive throughout the shear layer. This means that the cascade is mostly directed towards small scales. The peak is observed at approximately the same scale as in figure 8 and appears to move upward with increasing time, i.e. from approximately
 $Y=0.01L_x$ at
 $t^*=0.98$ up to
 $Y=0.03L_x$ at
 $t^*=1.83$. This is again most likely attributable to the increase of the shear-layer thickness. At
 $t^*=1.83$, the
 $r$-transfer term reveals a pocket of negative values around
 $(Y, r) \approx (-0.01L_x, 0.01L_x)$. This indicates that the scale distribution close to the centreline undergoes an inverse cascade process. Arguably, this inverse cascade is consistent with the relaxation mechanism of the interface by capillary effect and a diminishing influence of velocity shear which was already identified in figure 2.
Close to the centreline ( $Y = 0$), the
 $Y$-transfer term is negative, meaning that all scales tend to be convected upwards. The local minimum appears at
 $(Y, r) \approx (0, 0.02L_x)$. On the contrary, this term appears positive (i.e. downward transport) on both sides of the centreline. Analysing together the
 $r$-transfer and
 $Y$-transfer terms reveals an interesting picture for the scale/space transport of the liquid phase in a turbulent shear layer. Indeed, our analysis suggests that the liquid structures located close to the centreline are first dominantly convected in the upward direction. Then, once sufficiently pulled away from the centreline, these structures start transferring their ‘energy content’ predominantly in the direction of small scales, thereby following a direct cascade process. When these two processes are summed this yields the time derivative of
 $\langle (\delta \phi )^2\rangle _{\mathbb {P},\varOmega }$ which is negative close to the centreline and positive on the edge of the shear layer. This observation applies for all
 $t^*$. This is a key characteristic of the vertical expansion of the shear layer. This expansion is felt by all scales, i.e. it is found that, independently of the probed scale, the probability of crossing an interface (i.e.
 $\langle (\delta \phi )^2\rangle _{\mathbb {P},\varOmega }$) is decreasing close to the centreline while it increases on both sides of the centreline. This is readily observed when comparing the scale distributions
 $\langle (\delta \phi )^2\rangle _{\mathbb {P},\varOmega }$ from time
 $t^* = 0.98$ to
 $t^* = 1.83$.
5.3. Anisotropic scale/space fluxes
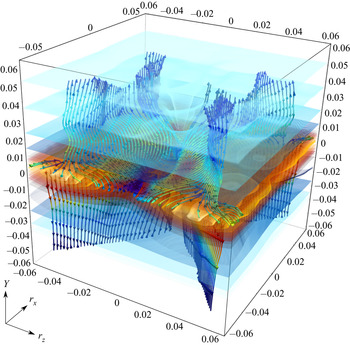
We now lift the angular average so as to appraise the full scale/space/time transport of liquid within the shear layer. The different terms of (2.3a) have now argument list  $(Y, \boldsymbol {r}, t)$, i.e. a 5-D manifold. Hence, one has to face the difficulty of displaying the results in such a large parameter space. An attempt of a possible 3-D representation of both the scale distribution
 $\langle (\delta \phi )^2\rangle _{\mathbb {P}}$ and energy fluxes
 $(\langle (\delta u)(\delta \phi )^2 \rangle _{\mathbb {P}}, \langle (\delta w^\prime )(\delta \phi )^2 \rangle _{\mathbb {P}}, \langle (\sigma v^\prime )(\delta \phi )^2 \rangle _{\mathbb {P}})$ in the subset
 $(r_x, r_z, Y, r_y=0)$ is given in figure 10. This figure exemplifies the very complex patterns of liquid transport within the shear layer. The flow appears to be highly inhomogeneous, with a noticeable dependence of
 $\langle (\delta \phi )^2\rangle _{\mathbb {P}}$ and its fluxes on the location
 $Y$. Furthermore, the anisotropic character of the two-point statistics is striking. Indeed, isotropy would have revealed itself as concentric circles for
 $\langle (\delta \phi )^2\rangle _{\mathbb {P}}$. This obviously does not apply to the present data. A careful analysis of figure 10 further indicates that the streamlines of the energy fluxes are mostly directed towards positive (negative)
 $Y$ for scales located at positive (negative)
 $Y$, thereby yielding a vertical expansion of the scale distribution. For positive
 $Y$, the paths of fluxes are directed towards positive (negative)
 $r_z$, suggesting a redistribution of the ‘energy’ content in the spanwise direction.
Three-dimensional visualization of the second-order structure function in the subset  $(r_x, r_z, Y,r_y=0)$ at
 $t^* = 0.98$ (small to large values are displayed by light blue to yellow). The streamlines indicate the path of ‘energy’ flux
 $(\langle (\delta u)(\delta \phi )^2 \rangle _{\mathbb {P}}, \langle (\delta w^\prime )(\delta \phi )^2 \rangle _{\mathbb {P}}, \langle (\sigma v^\prime )(\delta \phi )^2 \rangle _{\mathbb {P}})$ and are coloured by the magnitude of the local fluxes (small to large values: blue to red). The three axes are normalized by
 $L_x$. An interactive 3-D file for this figure is given as supplementary material available at https://doi.org/10.1017/jfm.2020.1152.

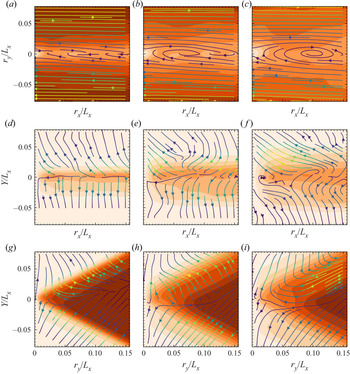
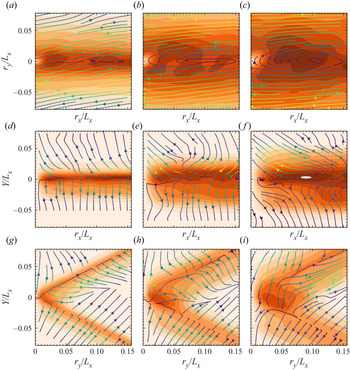
Although the 3-D representation of the two-point statistics provided in figure 10 allows us to substantiate the complex nature of liquid transport in this particular flow field, a more quantitative analysis is required. To do this, we made the choice of displaying the results for only a few relevant sub-planes of the full 5-D manifold, all them containing at least one component in an inhomogeneity direction,  $Y$ or
 $r_y$. In figure 11, we represent the contours of
 $\langle (\delta \phi )^2\rangle _{\mathbb {P}}$ together with the flux components in the following sub-planes:
(i) the
$(r_x, r_y)$-plane ($Y = r_z = 0$) with flux components $(\langle (\delta u)(\delta \phi )^2 \rangle _{\mathbb {P}}, \langle (\delta v^\prime )(\delta \phi )^2 \rangle _{\mathbb {P}})$;(ii) the
$(r_x, Y)$-plane ($r_y = r_z=0$) with flux components $(\langle (\delta u)(\delta \phi )^2 \rangle _{\mathbb {P}}, \langle (\sigma v^\prime )(\delta \phi )^2 \rangle _{\mathbb {P}})$; and(iii) the
$(r_y, Y)$-plane ($r_x = r_z =0$) with flux components $(\langle (\delta v^\prime )(\delta \phi )^2 \rangle _{\mathbb {P}}, \langle (\sigma v^\prime )(\delta \phi )^2 \rangle _{\mathbb {P}})$.


Iso-values of  $\langle (\delta \phi )^2\rangle _{\mathbb {P}}$ (orange filled contours, from (light) 0 to (dark) 1) and flux components (streamlines coloured by the flux magnitude) in different sub-planes of the full manifold; (a–c)
 $(r_x, r_y)$-plane, (d–f)
 $(r_x, Y)$-plane, (g–i)
 $(r_y, Y)$-plane. Left to right:
 $t^* = 0.98, 1.37, 1.83$

Note that the two-point statistics possess a central symmetry with respect to  $(r_x, r_y, r_z) = (0, 0, 0)$. Thus, only the positive halves of the abscissae are represented in figure 11. The distribution of
 $\langle (\delta \phi )^2\rangle _{\mathbb {P}}$ and its respective flux components reveal again the very complex nature of energy transfer in this particular flow field. Two-point statistics are strongly dependent to the orientation of the separation vector
 $\boldsymbol {r}$ (see e.g. figure 11a–c), suggesting a very high degree of anisotropy. The dependence on the location
 $Y$ within the flow is also readily perceptible (see figures 11d–f and 11g–i) meaning that, obviously, inhomogeneity effects are further at play in the shear layer.
Firstly, let us focus on figure 11(a–c). For  $|r_y| \gtrsim 0.025L_x$, the flux component in the
 $r_x$ direction, i.e.
 $\langle (\delta u)(\delta \phi )^2 \rangle _{\mathbb {P}}$ clearly dominates over that in the
 $r_y$ direction
 $\langle (\delta v^\prime )(\delta \phi )^2 \rangle _{\mathbb {P}}$. This can be largely explained by the strong velocity shear and thus the large difference between the gas and the liquid streamwise velocities. Indeed, the increment of streamwise velocity
 $\delta u$ can be decomposed as
 $\delta u = \delta \langle u \rangle _{\mathbb {P}} + \delta u^\prime$ while the statistical symmetry with respect to the
 $x$ and
 $z$ directions implies
 $\langle v \rangle _{\mathbb {P}} = 0$ and thus
 $\delta v = \delta v^\prime$ and
 $\sigma v = \sigma v^\prime$. Therefore, for large
 $r_y$ separations, the
 $r_x$ flux dominates over the
 $r_y$ flux because
 $\delta \langle u \rangle _{\mathbb {P}} \approx u_g \gg \delta u^\prime \sim \delta v^\prime$. Figure 11(a–c) further evidences that, for positive values of
 $r_y$, the flux components are mostly directed towards positive
 $r_x$ while, by symmetry, the opposite is observed for negative values of
 $r_y$. Consequently, the fluxes in the
 $(r_x, r_y)$ plane act in distributing the ‘energy’ content from the
 $r_y$ component to the
 $r_x$ component. Pragmatically speaking, this indicates, due to the velocity shear, liquid structures will tend to tilt in the clockwise direction. For
 $|r_y| \lesssim 0.025L_x$, the
 $r_x$ and
 $r_y$-fluxes are of the same order of magnitude, and reveal a complex spiralling behaviour which, interestingly, appears rather similar to the one observed for the total kinetic energy in turbulent channel flows Cimarelli, De Angelis & Casciola (Reference Cimarelli, De Angelis and Casciola2013).
Figure 11(d–f) represents the scale distribution  $\langle (\delta \phi )^2\rangle _{\mathbb {P}}$ and fluxes
 $(\langle (\delta u)(\delta \phi )^2 \rangle _{\mathbb {P}}, \langle (\sigma v^\prime ) (\delta \phi )^2 \rangle _{\mathbb {P}})$ in the
 $(r_x, Y, r_y=0, r_z=0)$-plane. At
 $t^* = 0.98$, i.e. during the surface production period, the flux in the
 $Y$ direction dominates over the one in the
 $r_x$ direction. This reflects the strong vertical expansion of
 $\langle (\delta \phi )^2\rangle _{\mathbb {P}}$. This is also readily visible by comparing the scale distribution
 $\langle (\delta \phi )^2\rangle _{\mathbb {P}}$ which appears to spread in the
 $Y$ direction from
 $t^* = 0.98$ to
 $t^* = 1.83$. This expansion mechanism appears to be roughly independent of
 $r_x$ for all scales
 $r_x \gtrsim 0.025L_x$. Still, at
 $t^* = 0.98$, the fluxes’ amplitude and direction appear to follow those of the gradient of
 $\langle (\delta \phi )^2\rangle _{\mathbb {P}}$. During the relaxation period, i.e.
 $t^* = 1.83$, and for positive
 $Y$, the fluxes are directed towards the direction of smaller
 $r_x$, revealing a direct cascade mechanism.
The scale distribution  $\langle (\delta \phi )^2\rangle _{\mathbb {P}}$ in the
 $(r_y, Y, r_x=0, r_z=0)$-plane together with the corresponding fluxes
 $(\langle (\delta v^\prime )(\delta \phi )^2 \rangle _{\mathbb {P}}, \langle (\sigma v^\prime )(\delta \phi )^2 \rangle _{\mathbb {P}})$ are portrayed in figure 11(g–i). Here,
 $\langle (\delta \phi )^2\rangle _{\mathbb {P}}$ displays a kind of triangular shape, which is characteristic of the strong inhomogeneity in this particular flow. At
 $t^* = 0.98$,
 $t^* = 1.37$ and maybe in a less obvious manner at
 $t^* = 1.83$, the magnitude and direction of the fluxes nicely align with the amplitude and direction of the gradient of
 $\langle (\delta \phi )^2\rangle _{\mathbb {P}}$. Here again, fluxes appear to be mostly oriented towards smaller scales (direct cascade);
 $(\langle (\delta v^\prime )(\delta \phi )^2 \rangle _{\mathbb {P}}, \langle (\sigma v^\prime )(\delta \phi )^2 \rangle _{\mathbb {P}})$ also tend to transport
 $\langle (\delta \phi )^2\rangle _{\mathbb {P}}$ on both sides of the centreline, i.e. towards positive (negative)
 $Y$ for all scales located at planes
 $Y>0$ (
 $Y< 0$). Consequently, at time increases,
 $\langle (\delta \phi )^2\rangle _{\mathbb {P}}$ appears to spread in the
 $Y$ and
 $r_y$ directions.
In summary, figure 11 suggests the following picture for the scale/space/time transport of liquid in the shear layer. The time evolution of the scale distribution  $\langle (\delta \phi )^2\rangle _{\mathbb {P}}$ is first affected by a strong contribution of the flux in
 $Y$-space, which results in vertical expansion of the two-point statistics towards both sides of the shear-layer centreline. Further, the strong velocity shear
 $\partial _Y \langle u \rangle _\mathbb {E}$ is responsible for the predominant contribution of the
 $r_x$ flux process and the strong anisotropy of the fluxes in the
 $(r_x, r_y)$-plane. The shear rate also acts in distributing the ‘energy’ content from the
 $r_y$ component to the
 $r_x$ component, i.e. liquid structures tend to rotate in the clockwise direction.
A last comment is to be made at this stage. In Thiesset et al. (Reference Thiesset, Dumouchel and Ménard2019a, Reference Thiesset, Duret, Ménard, Dumouchel, Reveillon and Demoulin2020), it was shown that the fluxes in scale and physical space can be decomposed into local and non-local interactions. The former (later) indicates that the transfer process occurs between adjacent (separate) scales or positions. Here, at several occasions in figure 11, it was emphasized that the paths of local fluxes in the combined physical/scale space match quite well in direction and amplitude with local gradients of  $\langle (\delta \phi )^2\rangle _{\mathbb {P}}$. These correspond to the zones where the transfer is mostly local. In such zones, it is worth mentioning that a closure for the fluxes in the form of a diffusion by a gradient process can be invoked, with a diffusion coefficient which remains yet to be evaluated. However, there are also many regions in the
 $(\boldsymbol {X}, \boldsymbol {r})$-space where local paths of energy do not follow the local gradients of
 $\langle (\delta \phi )^2\rangle _{\mathbb {P}}$. Here, non-local interactions are at play and some other type of closure scheme ought to be considered.
6. Results for the fluctuating field
Previous considerations were dedicated to the total phase indicator field  $\phi$. However, the present flow configuration reveals a strong statistical inhomogeneity which notably manifests itself as a significant gradient of the liquid volume fraction
 $\langle \phi \rangle _\mathbb {P}$ in the
 $Y$ direction. Such an inhomogeneity does not appear explicitly in the equation for the total field (2.3a). With the goal of better quantifying its effect, one has to push the analysis to the fluctuating field
 $\phi ^\prime = \phi -\langle \phi \rangle _\mathbb {P}$ by using (2.3b). By doing so, the production terms in the directions
 $Y$ and
 $r_y$ are made explicit. The latter can be interpreted as an exchange of energy from the mean field to the randomly fluctuating field.
6.1. Spatially and angularly averaged budget
As was done in § 5, we start with the spatially and angularly averaged version of (2.3b) and then progressively go deeper into detail by lifting first the spatial average and then the angular average.
The right-hand side of the spatially and angularly averaged budget of the fluctuating field (2.3b) contains two transfer terms and two production terms which are represented in figure 12, for the three same time steps  $t^* = 0.98, 1.37, 1.83$.
Angularly and spatially averaged budgets for the fluctuating phase indicator field. From (a–c),  $t^*=0.98, 1.37, 1.83$.

Here again, it is worth noting that, once angularly and spatially averaged, the time derivative term and the right-hand side of (2.3b) collapse very nicely. This again shows that the balance between the different terms of the budget is well satisfied, which reinforces our statement that the resolution and numerical procedures are adequate. The time derivative term appears to be positive irrespective of the probed scale  $r$ (except maybe at very small scales during the relaxation period). This means that the portion of randomly fluctuating scales is increasing as the shear layer develops in time. Note that, contrary to figure 8, the time derivative term is not zero at large scales, suggesting that
 $\langle (\delta \phi ^\prime )^2 \rangle _{\mathbb {P}, \mathbb {Y}, \varOmega }$ is not conserved, but increasing, and that, on the contrary, the ‘energy’ content of the mean field is decreasing.
As it was observed for the total field (figure 8), the  $Y$ transfer term is negligible. The same reasoning thus applies: the
 $Y$-flux crossing the plane located at
 $Y = -L_x/4$ is comparable (if not equal) to the one flowing through the plane
 $Y = L_x/4$. The amplitude of the
 $r$-transfer term also appears to be rather small and contributes negatively at small scales. This reveals that the cascade process for the fluctuating field is mostly directed towards larger scales, an inverse cascade mechanism. In other words, the negative
 $r$-transfer term indicates that the random nature of the fluctuating field is first felt at small scales and is progressively transported towards larger scales. The terms that contribute the most to the budget are the two production terms in the
 $r$- and
 $Y$-space. Note that the production process due to gradient of
 $\langle \phi \rangle _\mathbb {P}$ with respect to
 $r_y$ is predominant at small scales, while the
 $Y$-production mechanisms is monotonically increasing for increasing scales. That means that, at small scales, the time evolution of
 $\langle (\delta \phi ^\prime )^2 \rangle _{\mathbb {P}, \mathbb {Y},\varOmega }$ is almost entirely piloted by the
 $r_y$-production term, while at large scales, both the
 $r_y$- and
 $Y$- production terms are at play.
As stated previously, the production terms can be interpreted as the exchange of ‘energy’ between the mean and the fluctuating fields. Therefore, the liquid/gas shear layer explored here is consistent with the classical vision of sheared turbulence where the inhomogeneity of the mean field is responsible for the generation of turbulent (randomly fluctuating) scales. This picture is usually thought to apply to the velocity and diffusive scalar field. Our data suggest that it also applies to the phase indicator field in turbulent liquid/gas shear flow.
6.2. Angularly averaged budget
With the goal of probing the region within the flow where the processes of transfer and production are at play, we now lift the spatial average and focus on the angularly averaged version of (2.3b). Results are presented in figure 13 in the form of 2-D plots in the  $(Y,r)$ planes for times
 $t^*=0.98, 1.37, 1.83$.
Budget of the fluctuating phase indicator field. Orange filled contours represent  $\langle (\delta \phi ^\prime )^2\rangle _{\mathbb {P},\varOmega }$ (light to dark corresponds to values from 0 to 0.5). The coloured lines correspond to the contours of the different terms normalized by
 $u_g/L_x$. Positive (negative) values are displayed by full (dashed) lines. From left to right:
 $t^*=0.98, 1.37, 1.83$. From top to bottom:
 $r$-transfer term,
 $r$-production term,
 $Y$-transfer term,
 $Y$-production term, time derivative term.

While in figure 9 the distribution of the total phase indicator field  $\langle (\delta \phi )^2\rangle _{\mathbb {P},\varOmega }$ was prominently located around large scales (
 $r \gtrsim 0.10 L_x$), the distribution of the fluctuating field
 $\langle (\delta \phi ^\prime )^2\rangle _{\mathbb {P},\varOmega }$ is concentrated at smaller scales (
 $r \lesssim 0.10 L_x$) and is centred around the shear-layer centreline. Note also that, while the ‘energy’ content of the total field was diminishing with respect to time, that of the fluctuating field is substantially increasing from
 $t^* = 0.98$ to
 $t^* = 1.83$. This again reinforces the statement that part of the mean field ‘energy’ is transferred to the randomly fluctuating field.
A careful analysis of figure 9 provides further substance and confirms this. Indeed, it is readily perceived that the contours of  $\langle (\delta \phi ^\prime )^2\rangle _{\mathbb {P},\varOmega }$ match almost perfectly those of the
 $r_y$-production term. To a large extent, the time increase in
 $\langle (\delta \phi ^\prime )^2\rangle _{\mathbb {P},\varOmega }$ is thus due to this production mechanism, which further appears to be dominant over the whole extent of the shear layer and for almost all scales. In the zones where
 $\langle (\delta \phi ^\prime )^2\rangle _{\mathbb {P},\varOmega }$ is maximum, the transfers in both
 $r$- and
 $Y$-space are negative and also contribute quite significantly to the budget. In these zones, these two terms thus act in redistributing the energy either towards larger scales or in the direction of positive
 $Y$, respectively. The production in
 $Y$-space does not contribute much, except maybe at rather large scales where it is positive.
The analysis of figure 9 allows us to draw the following portrait for the scale/space transport of the fluctuating liquid field in the shear layer. The driving mechanism is the production of fluctuating quantities due to gradient of the mean liquid volume fraction in the  $r_y$ direction. ‘Energy’ is produced in the zone where inhomogeneities are the largest, here, on the centreline of the shear layer. Then, the transfer mechanisms in either scale space and geometrical space act in redistributing this produced ‘energy’ over larger scales and in the upward direction, respectively. Summing up these different contributions yields the time variations of
 $\langle (\delta \phi ^\prime )^2\rangle _{\mathbb {P},\varOmega }$ which increases for almost all scales and all vertical positions within the shear layer. Note that the rate at which
 $\langle (\delta \phi ^\prime )^2\rangle _{\mathbb {P},\varOmega }$ increases in time is the highest on both sides of the centreline, in compliance with a vertical enlargement of the shear layer.
6.3. Anisotropic scale/space fluxes
The dependence on the orientation of the separation vector  $\boldsymbol {r}$ is now incorporated into the analysis by lifting the angular average. As in § 5, we selected the same sub-planes of the full 5-D manifold:
(i) the
$(r_x, r_y)$-plane ($Y, r_z = 0$) with flux components $(\langle (\delta u)(\delta \phi ^\prime )^2 \rangle _{\mathbb {P}}, \langle (\delta v^\prime )(\delta \phi ^\prime )^2 \rangle _{\mathbb {P}})$;(ii) the
$(r_x, Y)$-plane ($r_y, r_z=0$) with flux components $(\langle (\delta u)(\delta \phi ^\prime )^2 \rangle _{\mathbb {P}}, \langle (\sigma v^\prime )(\delta \phi ^\prime )^2 \rangle _{\mathbb {P}})$; and(iii) the
$(r_y, Y)$-plane ($r_x, r_z =0$) with flux components $(\langle (\delta v^\prime )(\delta \phi ^\prime )^2 \rangle _{\mathbb {P}}, \langle (\sigma v^\prime )(\delta \phi ^\prime )^2 \rangle _{\mathbb {P}})$.


Results are presented in figure 14 where both contours of the scale distribution  $\langle (\delta \phi ^\prime )^2\rangle _{\mathbb {P}}$ and streamlines of fluxes in the combined physical/scale space are portrayed. Here again, one is struck by the very complex nature of the energy paths in this shear dominated flow. Nevertheless, one can retrieve in figure 14 many of the key observations that were drawn previously for the angularly averaged budget of the fluctuating liquid field. The most obvious is probably the increase in the energy content throughout the different sub-planes when time increases from
 $t^* = 0.98$ to
 $t^*1.83$. The scale distribution
 $\langle (\delta \phi ^\prime )^2\rangle _{\mathbb {P}}$ appears to evolve mainly towards larger scales and also spreads in the vertical direction. By comparing figures 11 and 14, one also recovers several common points between the total and the fluctuating fields.
Iso-values of  $\langle (\delta \phi ^\prime )^2\rangle _{\mathbb {P}}$ (orange filled contours, from (light) 0 to (dark) 0.5) and flux components (streamlines coloured by the flux magnitude) in different sub-planes of the full manifold; (a–c)
 $(r_x, r_y)$-plane, (d–f)
 $(r_x, Y)$-plane, (g–i)
 $(r_y, Y)$-plane. Left to right:
 $t^* = 0.98, 1.37, 1.83$.

Firstly, by scrutinizing the results in the  $(r_x, r_y,Y=0, r_z = 0)$-plane, it is clear that, due to the strong shear, the flux in the
 $r_x$ direction dominates over the one in
 $r_y$ direction. One further observes the same propensity of local fluxes to tilt liquid scales in the clockwise direction. In the vicinity of the shear-layer centreline, one recovers the same spiralling behaviour.
Secondly, the paths of energy fluxes in the  $(r_x,Y,r_y=0, r_z = 0)$-plane in figure 14 are very similar to those observed for the total liquid field in figure 11. Here again, one notes a predominant contribution of vertical
 $Y$-fluxes, which results in a significant vertical expansion of the scale distribution
 $\langle (\delta \phi ^\prime )^2\rangle _{\mathbb {P}}$. The expansion of
 $\langle (\delta \phi ^\prime )^2\rangle _{\mathbb {P}}(r_x)$ along the
 $Y$-direction, is readily visible by comparing the results at time
 $t^* = 0.98$ and
 $t^*=1.83$. It appears to be roughly of the same amplitude for all scales
 $r_x \gtrsim 0.025L_x$.
Thirdly, the distribution of  $\langle (\delta \phi ^\prime )^2\rangle _{\mathbb {P}}$ in the
 $(r_y,Y,r_x=0, r_z = 0)$-plane reveals the same kind of triangular shape as the one of the total field (figure 11) except that the maximum values are located in the region where the gradient of
 $\langle (\delta \phi )^2\rangle _{\mathbb {P}}$ was the strongest. Note also that at
 $t^* = 0.98$ and
 $t^* = 1.37$, the streamlines of the energy fluxes appear to align quite well with the gradient of
 $\langle (\delta \phi ^\prime )^2\rangle _{\mathbb {P}}$. Here again, this suggests that, in this situation, the paths of liquid transport in the combined scale/physical space can be well approximated by local interactions through a classical diffusion by a gradient process.
7. Conclusions
The theoretical framework firstly documented in Thiesset et al. (Reference Thiesset, Duret, Ménard, Dumouchel, Reveillon and Demoulin2020) for a statistically homogeneous flow is here invoked to explore the dynamics of liquid transport in a liquid–gas shear layer, a strongly inhomogeneous flow. The key quantity in this theory is the second-order structure function of the phase indicator field.
A literature review reveals that this observable is widely employed in other areas of physics dealing with heterogeneous media: e.g. porous media, colloids and fractal aggregates. This vast corpus of research which dates back to the 1950s with the pioneering work by e.g. A. Guinier, G. Porod and P. Debye, has had a tremendous impact in terms of better characterizing the structure of media which reveal a certain degree of heterogeneity at some scales. Positioning the problematic two-phase flows into the wider context of heterogeneous media has allowed us to highlight the close link between the second-order structure function of the phase indicator and some valuable features of the liquid/gas interface. In particular, the first-order expansion for the increments of  $\phi$ at small scales relates to the interface surface density, while the third-order expansion enables a combination of the squared mean curvature and Gaussian curvature to be estimated. At intermediate scales, the second-order structure functions behave as a morphological descriptor with
 $r$ being the morphological parameter. At large scales and under some conditions the liquid volume can also be estimated from two-point statistics.
Most of known theoretical results on the two-point correlation function were obtained for homogeneous/isotropic fields. However, two-phase flows generally encountered in real situations reveal an evolution in a preferential direction due, for instance, to the presence of velocity gradients. Therefore, there is need to generalize such results to inhomogeneous and anisotropic cases. Following along the lines of Berryman (Reference Berryman1987), our data suggest that the relationship between correlation functions and geometric variables remains true when two-point statistics are averaged over all orientations of the separation vector  $\boldsymbol {r}$. It further appears that the homogeneity assumption can further be relaxed, in which case the two-point statistics depend on local values of surface area and curvature. In summary, the results of Kirste & Porod (Reference Kirste and Porod1962) and Frisch & Stillinger (Reference Frisch and Stillinger1963) appear to be possibly generalizable to anisotropic inhomogeneous media. Note, however, that this remains yet to be demonstrated and will most likely pose some mathematical difficulties. Indeed, for anisotropic media, one has to consider the dependence on the vector
 $\boldsymbol {r}$ of the auto-correlation functions, which is not taken into account in previous analyses (except by Berryman Reference Berryman1987, who coped with this dependence by using an angular average). For inhomogeneous cases, one has to tackle the dependence of both the auto-correlation function and liquid volume fraction on the position vector
 $\boldsymbol {X}$, which has never been addressed in previous theoretical work. However, any progress towards such a generalized expression may have important repercussions, not only for treating liquid–gas flows of practical relevance but also for characterizing several classes of heterogeneous media.
The analogy between two-phase flows and e.g. porous media breaks down once one recalls that the liquid phase is a dynamical system. Indeed, contrary to porous media, where it is in general relevant to consider a frozen geometry, liquid–gas flows evolve in time thanks to local two-way interactions with the velocity field. In this regard, one of the merits of the present study is to supplement the analysis of two-point statistics with a transport equation which allows us to explore the space/scale/time evolution of the liquid phase. This framework highlights that the dynamical evolution of the second-order structure function of the phase indicator is associated with some transfer and production terms which act together and concomitantly in a combined scale( $\boldsymbol {r}$)/physical(
 $\boldsymbol {X}$) space. Interestingly, at small scales, this equation asymptotes to the transport equation for the surface density and it was further evidenced that the transfer in scale space is proportional to the stretch rate at sufficiently small values of
 $r$. This is another proof that the stretch rate plays for the phase indicator the same role as the scalar dissipation rate in ‘classical’ scalar turbulence. In its general formulation, one has to deal with a 7-D problem, six dimensions to characterize the dependence on
 $\boldsymbol {r}$ (anisotropy) and
 $\boldsymbol {X}$ (inhomogeneity) and one dimension to account for the time evolution. The liquid–gas shear layer explored in the present work possesses two homogeneity directions, thereby contracting the problem to a 5-D manifold. A solution for further reducing the problem complexity is then provided by considering different averaging procedures. More precisely, (i) the dependence to the orientation of the separation vector
 $\boldsymbol {r}$ and physical position
 $Y$ are first concealed by use of both an angular and spatial average. Then (ii), the dependence on
 $Y$ is incorporated by lifting the spatial average before (iii) withdrawing the angular average, thereby allowing the anisotropic character of the ‘energy’ fluxes to be quantified. We applied this methodology for both the total and the fluctuating fields and explored different time steps during the time evolution of the shear layer, corresponding to the surface area production period, the time of maximum area and to the relaxation period, respectively.
This procedure allowed us to extract some key characteristics of the scale/space/time transport of liquid in the shear layer, some of which are summarized below.
(i) It is first shown that, in this particular flow, the total transfer between scales complies with a direct cascade scenario, where the sense of evolution is directed towards small scales. The opposite was observed for the fluctuating field, suggesting that part of the energy content of the mean field is transferred to the fluctuating field.
(ii) As far as the total phase indicator field is concerned, it was observed that turbulent scales are transported from the centreline towards the edge of the shear layer. As soon as they are sufficiently pulled away, ‘energy’ starts being transferred towards small scales. This observation applies qualitatively for almost all scales and does not change significantly during the time evolution of the shear layer, may it lie within the production or relaxation period.
(iii) The fluctuating component of the phase indicator is substantially influenced by the dominant role of production due to gradients of the mean liquid volume fraction. The
$r_y$ component of the production term is predominant at small scales while the budget indicates a strong contribution of the $r_y$ and $Y$ production processes at larger scales. This indicates that inhomogeneities plays a significant role in the turbulent liquid/gas shear layer.(iv) The very complex nature of liquid transport in the combined scale/physical space is exemplified by quantifying the paths of energy fluxes in some sub-planes of the full 5-D manifold. The effect of velocity shear appears in a striking manner and manifests itself in a dominant flux in the
$r_x$ direction which causes the tilting of liquid scales in the clockwise direction. Further, in some regions of the scale/physical space, it was observed that the paths of energy fluxes align nicely with the gradient of either $\langle (\delta \phi )^2\rangle _{\mathbb {P}}$ or $\langle (\delta \phi ^\prime )^2\rangle _{\mathbb {P}}$. This indicates that these zones are driven by some local interactions so that a closure scheme on the basis of a diffusion by gradient process can be formulated. Some other zones are on the contrary predominantly influenced by non-local interactions which requires a different treatment. Further work is needed to better understand the underlying physics at play for the fluxes to comply with either local or non-local interactions.


As an overall conclusion it may be worth recalling that the theoretical framework invoked here is a descriptive tool which allows scrutinizing of the details of liquid transport in both scale and physical space. The theory is not yet predictive, i.e. two-point equations are not closed since the flux/production terms cannot yet be expressed solely in terms of second-order structure functions of  $\phi$ or
 $\phi ^\prime$. Consequently, the present paper is rather observational and intends to document the peculiarities of the phase indicator evolution, a necessary step before providing some physics-informed modelling strategies. In this regard, we have evidenced that the transfer term in the combined scale/physical space can partly be closed by a gradient diffusion process. We also showed theoretically that the two-point budget contains information on the transport of surface density. There thus exists a close link between the present framework and some modelling strategies (e.g. the Eulerian Lagrangian spray atomization model; see e.g. Lebas et al. Reference Lebas, Menard, Beau, Berlemont and Demoulin2009; Anez et al. Reference Anez, Ahmed, Hecht, Duret, Reveillon and Demoulin2019) which treat liquid/gas flows by use of specific closures for
 $\phi$ and
 $\varSigma$. Second-order structure function of the phase indicator field can also be expressed as a function of some statistical moments of
 $\mathcal {H}$ and
 $\mathcal {G}$. Two-point statistics thus share some similarities with recent theoretical attempts aiming at generalizing the notion of the drop size distribution using either the Minkowski functional (Thiesset et al. Reference Thiesset, Dumouchel, Ménard, Aniszewski, Vaudor and Berlemont2019b), or geometrical metrics and topological invariants (Di Battista et al. Reference Di Battista, Bermejo-Moreno, Ménard, de Chaisemartin and Massot2019; Essadki et al. Reference Essadki, Drui, Larat, Ménard and Massot2019).
Further, although turbulence is by definition a random process and even though atomization is inherently a local process (pinch-off) which yields discontinuities at finite time, we conjecture that, by using a statistical approach, we can recover some degree of regularity and predictability for the statistics. The present data appear to confirm this statement. Indeed, to some extent, the phase indicator field was found to behave rather similarly to a diffusive passive scalar field in single-phase turbulence. For instance, the intricate interaction between the randomly fluctuating and mean fields complies quite well with the classical picture of turbulence in the sense that, at early times in the shear-layer evolution, the scalar ‘energy’ is mainly carried by the mean field, which progressively loses ‘energy’ as time increases by feeding the randomly fluctuating part of the  $\phi$-field. The analogy between the stretch rate for the phase indicator field and the scalar dissipation rate for ‘classical’ scalar turbulence is another example which opens up nice perspectives for modelling purposes.
Supplementary material
Supplementary material is available at https://doi.org/10.1017/jfm.2020.1152.
Acknowledgements
We are thankful to A. Poux, research engineer at CORIA laboratory, who wrote the Fortran kernel for calculating the terms of the scale energy budgets. We are also grateful to M. Massot for sharing the routines allowing us to compute the surface area and curvatures of iso-level-set surfaces. These are now available through the project Mercur(v)e (http://docs.mercurve.rdb.is/).
Funding
Computations have been carried out in CRIANN (Centre Régional Informatique et d'Applications Numériques de Normandie) under the project 2018002. FT also benefited from the financial support from the INSIS institute of the CNRS and the CORIA laboratory which are gratefully acknowledged.
Declaration of interests
The authors report no conflict of interest.