Introduction
The high-elevation inland regions of the Antarctic McMurdo Dry Valleys are unique on Earth. The cold, hyper-arid environment results in a soil structure of dry permafrost overlying buried ice-rich permafrost (Bockheim et al. Reference Bockheim, Campbell and McLeod2007) with extensive and active polygonal-patterned ground (e.g. Péwé Reference Péwé1959, Sletten et al. Reference Sletten, Hallet and Fletcher2003), within a potentially middle-Miocene age landscape (Marchant et al. Reference Marchant, Denton and Swisher1993). Our understanding of the stability, depth and distribution of ice-rich permafrost in the present Antarctic climate is at best weak (Campbell & Claridge Reference Campbell and Claridge1987, Hindmarsh et al. Reference Hindmarsh, van der Wateren and Verbers1998, McKay et al. Reference McKay, Mellon and Friedmann1998, Campbell & Claridge Reference Campbell and Claridge2006, McKay Reference McKay2009). On one hand, studies indicate that ground ice is unstable to substantial loss and recession within hundreds of years (e.g. McKay et al. Reference McKay, Mellon and Friedmann1998) but, on the other hand, polygonal patterned ground, which requires ice-rich permafrost, has developed over tens of thousands of years (or longer) (e.g. Black Reference Black1973, Sletten et al. Reference Sletten, Hallet and Fletcher2003). In this work we show that ground-ice stability and polygonal ground are integrally linked, and that the ground ice and Dry Valleys climate have been stable in their present state on average for tens of thousands of years.
In most cold regions of Earth, the portion of the soil that remains permanently below freezing (the permafrost) is ice-rich and the active layer above the permafrost contains periodic liquid water that can percolate to the permafrost table and ensure its ice-rich status (e.g. MacKay Reference MacKay1972, Washburn Reference Washburn1980). In contrast, the cold, hyper-arid regions found in the Antarctica Dry Valleys lack liquid water (Marchant & Head Reference Marchant and Head2007). The active layer is underlain by dry permafrost from a depth of a few centimetres to more than a metre, below which the permafrost is often ice-cemented (the ice table) (Campbell & Claridge Reference Campbell and Claridge2006).
The occurrence of this dry permafrost structure is considered unique to Antarctica, having not been observed anywhere else on Earth, and represents nearly half the land surface of the Dry Valleys (Bockheim et al. Reference Bockheim, Campbell and McLeod2007). Additionally, Campbell & Claridge (Reference Campbell and Claridge1987, Reference Campbell and Claridge2006) observed that generally younger surfaces exhibited ice-rich permafrost just below the active layer, while progressively older surfaces saw the occurrence of dry permafrost of increasing thickness above the ice table. This observation has led to hypotheses that the ice is generally unstable and is gradually lost by sublimation. Older surfaces would therefore have lost more ice. However, McKay (Reference McKay2009) pointed out that these older surfaces tended also to occur at higher elevations and that local climate may play a role.
Ground ice
This occurrence of dry permafrost has led to a number of studies of the stability of subsurface ice in these inland high-elevation regions of the Dry Valleys. McKay et al. (Reference McKay, Mellon and Friedmann1998) examined high-elevation ice-cemented soil at Linnaeus Terrace in upper Wright Valley, and found that the ice is unstable to sublimation and loss to the atmosphere with the ice table receding at a rate of around 0.5 mm year-1. Since the ice table is only 25 cm deep at this location, this rate of loss implies that the ice may be only a few hundred years old. They concluded that the ice-cemented ground must experience steady or episodic recharge with implications for the recent climate (> 104 years). Similarly, reviews of the stability of the ice table in central Beacon Valley, where massive ice is reported to be over 8 million years old (Sugden et al. Reference Sugden, Marchant, Potter, Souchez, Denton, Swisher and Tison1995), resulted in comparable estimates of ice-loss rates (Hindmarsh et al. Reference Hindmarsh, van der Wateren and Verbers1998, Schorghofer Reference Schorghofer2005). Hagedorn et al. (Reference Hagedorn, Sletten and Hallet2007) examined the lower elevation permafrost in Victoria Valley and found ground ice also to be unstable and receding at around 0.2 mm year-1. Ice-table recharge by vapour diffusion, thin films (McKay et al. Reference McKay, Mellon and Friedmann1998) and snow melt (Hagedorn et al. Reference Hagedorn, Sletten and Hallet2007) have been suggested.
McKay (Reference McKay2009) measured the ice-table depth (i.e. the dry permafrost thickness) in University Valley, a small hanging cirque valley adjacent to Beacon Valley. He found the depth to increase with distance from a small glacier and snowfield at the valley headwall. These observations were further supported and expanded along the valley floor and in adjacent valleys by Marinova et al. (Reference Marinova, McKay, Pollard, Heldmann, Davila, Andersen, Jackson, Lacelle, Paulson and Zacny2012). McKay (Reference McKay2009) proposed that interannual recurrence of surface snow, as the glacial snowfield grows and recedes, might help explain the apparent ground-ice instability by creating episodic periods of high surface humidity to recharge the ice table by vapour diffusion and maintain its shallow depth. He also suggested that the time scale for such recurrence was roughly decadal.
Presently, the stability and age of the ice-rich permafrost and the thickness of dry permafrost over time remain controversial. Measured ice-loss rates and relatively shallow ice-table depths are at odds with the surface age. Evidence is absent for climate change in modern times. While loss rates are inferred from measurements over several seasons at different locations, ice-table recharge has not been observed. Indeed, it is not clear if the ice table is in fact steadily receding, fluctuating widely over time, or maintaining an approximately steady position within the permafrost over short or long timescales. The stability of Antarctic ice-rich permafrost is a fundamental part of understanding the Antarctic climate, and possible climate change in modern times as far back as a few million years.
Patterned ground
Perhaps the most ubiquitous landform found in permafrost is polygonal-patterned ground, which forms by seasonal thermal-contraction cracking in permanently ice-cemented ground (e.g. Lachenbruch Reference Lachenbruch1962). Cracks, which open no more than millimetres in any one year, form a reticulate or honeycomb network to relieve thermal-contraction stress. In arid regions where the active layer remains dry, surface soil falls into the open cracks forming a subsurface accumulation of fine material termed a ‘sand wedge’ (Péwé Reference Péwé1959, Reference Péwé1974). Repeated cracking and wedge growth in the same locations each year integrates the incremental seasonal strain and develops visible, sometimes pronounced, topographic relief over thousands of years or more.
Antarctic Dry Valley polygons were first reported in detail by Péwé (Reference Péwé1959). Polygons are widespread throughout the Dry Valleys. In coastal regions both ice- and sand-wedge forms occur, while inland only sand-wedge polygons are found (Black & Berg Reference Black and Berg1963, Black Reference Black1973, Bockheim Reference Bockheim1995). However, in areas where the ice table is observed to be greater than 100 cm below the surface, polygons are absent (Bockheim et al. Reference Bockheim, Campbell and McLeod2007). Younger polygons usually exhibit shallow surface relief relative to their older counterparts (Péwé Reference Péwé1959, Sletten et al. Reference Sletten, Hallet and Fletcher2003), while polygons in the lag of debris covered glaciers form deep troughs (of order 1.4 m in middle Beacon Valley) due to enhanced sublimation of massive ice (Marchant et al. Reference Marchant, Lewis, Phillips, Moore, Souchez, Denton, Sugden, Potter and Landis2002). Polygon morphology may also be influenced by the relative abundances of rocks and fines at the surface. Polygons are typically 4–6 sided and range from 5–30 m in size (Black & Berg Reference Black and Berg1963). In an effort to estimate the surface age from polygon development Black & Berg hammered metal stakes into the ice-cemented ground at 14 sites and began long-term monitoring of the growth of polygon wedges. From these measurements the polygons were shown to be actively growing, with the wedges increasing in width on average about 0.5–1.5 mm year-1 (e.g. Black Reference Black1973, Malin & Ravine Reference Malin and Ravine1994, Sletten et al. Reference Sletten, Hallet and Fletcher2003).
Within University Valley, sand-wedge polygons and ice-cemented soil are abundantly observed, with no evidence of massive ice or buried glacial deposits on the valley floor. Satellite images reveal that the polygons vary considerably in size, appearing smallest near the snowfield and largest near the mouth of the valley. Observations of ice-table depth (Marinova et al. Reference Marinova, McKay, Pollard, Heldmann, Davila, Andersen, Jackson, Lacelle, Paulson and Zacny2012) and patterned ground in neighbouring Farnell Valley suggest similar but less pronounced trends also occur. Examination of similar polygonal-patterned ground in the permafrost of Mars and numerical modelling indicate that the depth of the ice table plays a key role in polygon development and in particular in setting the size scale of active polygons (Mellon et al. Reference Mellon, Arvidson, Marlow, Phillips and Asphaug2008, Reference Mellon, Malin, Arvidson, Searls, Sizemore, Heet, Lemmon, Keller and Marshall2009). In this work, we examined the size and characteristics of polygonal ground in Beacon Valley and Beacon Heights with an emphasis on University Valley. We link the polygon size and ice-table depth through numerical modelling and show that the two are well correlated. From these results we draw inferences about the history of the ice-rich permafrost, its depth stability and the Dry Valleys climate on approximately 104-year timescales.
Observations
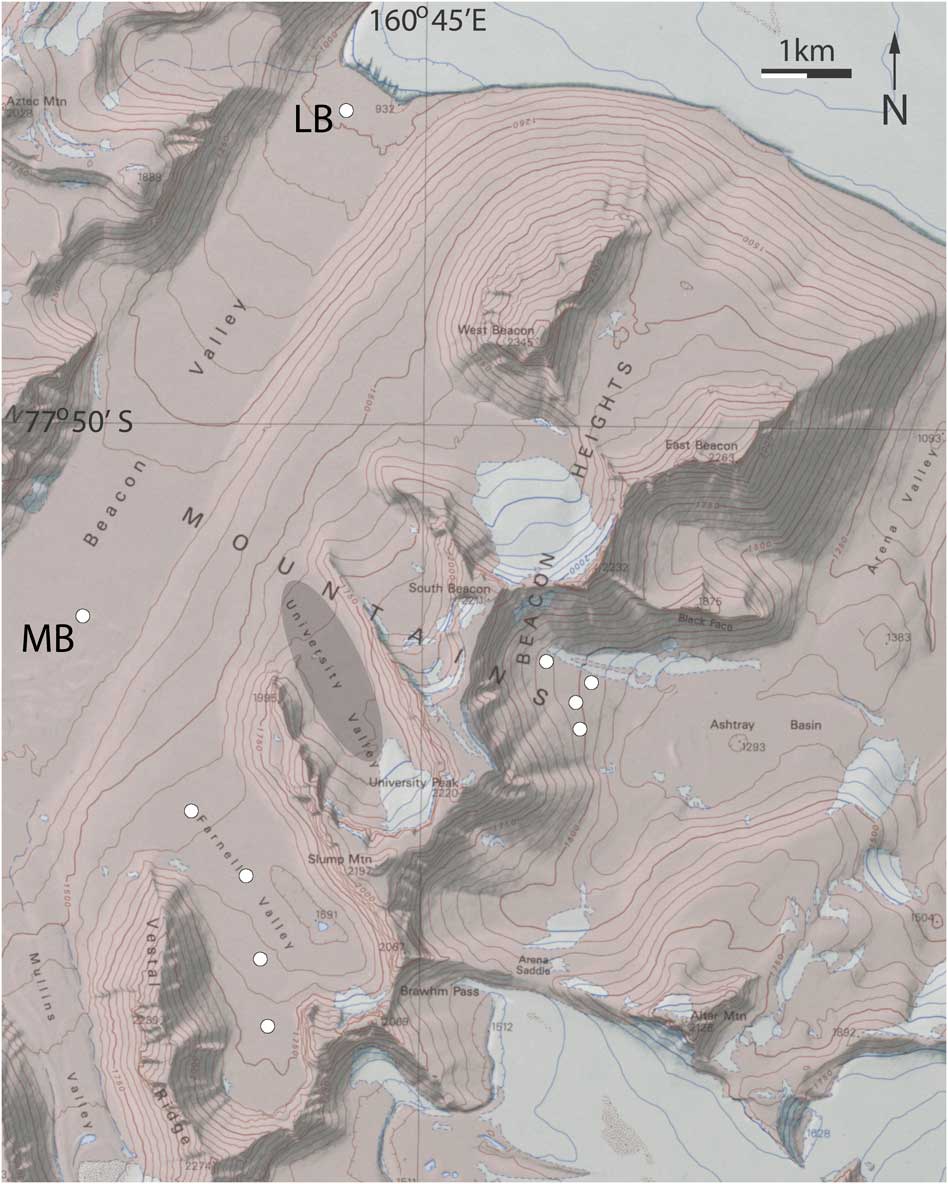
Beacon Valley and adjacent valleys in the Beacon Heights region of the Quartermain Mountains are excellent examples of inland high-elevation regions of the Antarctic Dry Valleys, located at roughly 77.86°S and 160.7°E (Fig. 1). This region is marked by extensive dry permafrost overlying ice-rich permafrost and by polygonal-patterned ground (Black Reference Black1973, Sletten et al. Reference Sletten, Hallet and Fletcher2003, Bockheim et al. Reference Bockheim, Campbell and McLeod2007; Fig. 2). The valley floors are dominated by tills derived from local Beacon Sandstone and Ferrar Dolerite (Ugolini et al. Reference Ugolini, Bockheim and Anderson1973). Within Beacon Valley the addition of small quantities of granitic drift are thought to be the result of past advances of the Taylor Glacier from the north (Marchant et al. Reference Marchant, Denton and Swisher1993). These tills generally have many boulders with scattered-to-widespread armouring of desert pavement, underlain and interspersed with fines of sandy-to-silty soil. To the south-east of Beacon Valley is Beacon Heights with several hanging cirque valleys. Of interest in this study are University Valley and Farnell Valley, and on the east side of Beacon Heights, Arena Valley and Ashtray Basin. Of these valleys the Beacon Valley floor lies at the lowest elevations at 1000–1400 m. The University and Farnell Valley floors are the highest at 1650–1750 m and Ashtray Basin at the upper elevations of Arena Valley is intermediate at 1300–1550 m. The recent geologic history of University Valley, and adjacent valleys in Beacon Heights, is marked by middle-Miocene ice-sheet expansion, followed by a transition to cold, hyper-arid conditions (Marchant et al. Reference Marchant, Denton and Swisher1993). However, the details of the post-glacial climate are a matter of considerable debate, directly related to outstanding questions of the stability of ice-rich ground and buried glacial ice noted above. This region and the small snowfields, such as at the headwall of University Valley, are primarily supplied by snow blowing off the polar plateau (McKay Reference McKay2009).
Regional map of Beacon Valley and Beacon Heights showing approximate locations of polygon study sites (white circles). LB and MB indicate lower and middle Beacon sites, respectively. At University Valley a grey oval bounds the cluster of 19 individual sites, which collectively cover about half of the valley floor.

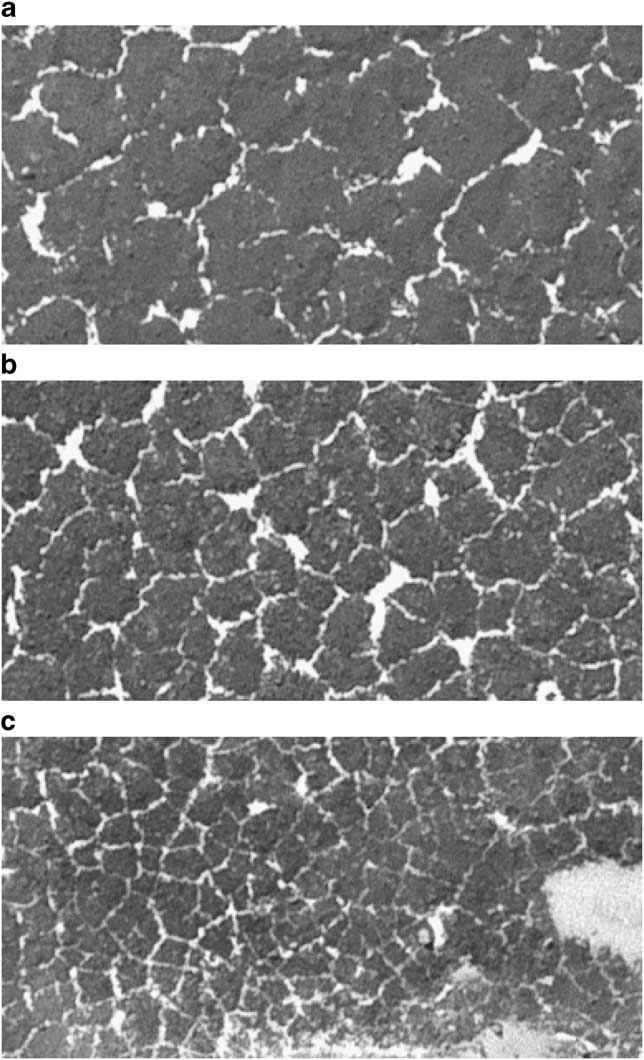
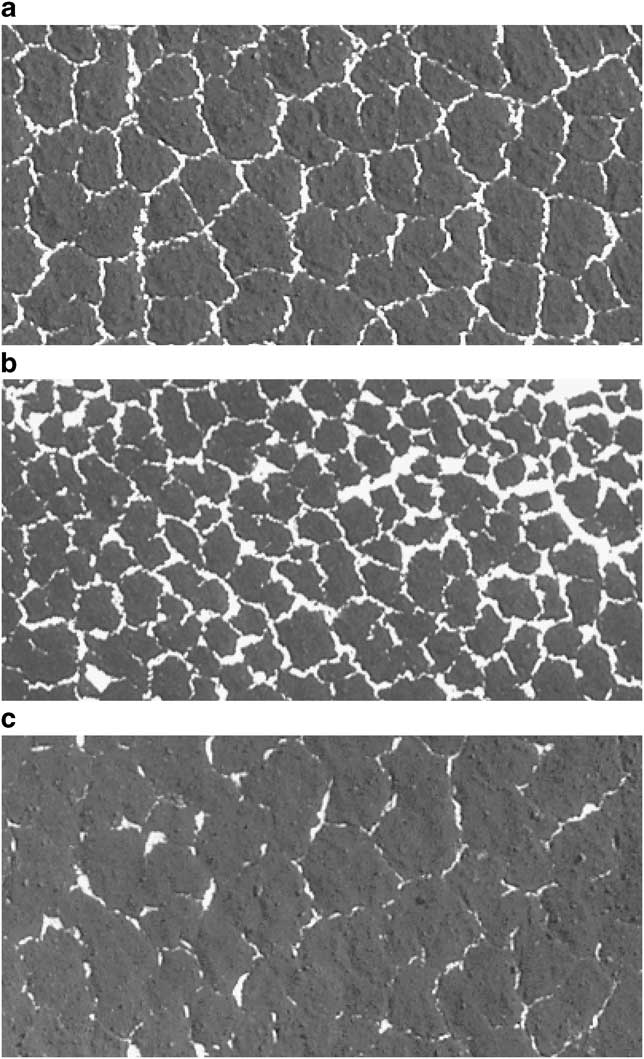
Progression of polygon sizes in University Valley. a. Site 2 near the mouth of the valley. b. Site 9 near mid valley. c. Site 19 nearest to the glacial snowfield. Snow in the shallow polygon troughs helps to delineate polygon boundaries, aided also by shading of snow-free surfaces. Aerial photography image SN7864-1/13 courtesy of the US Geological Survey, Antarctic Resource Center. Subframes cover two hectares (200 m wide) at about 0.51 m pixel-1.

Current climate conditions in the region are similar to other high-elevation areas of the Dry Valleys with annual mean soil surface temperatures on the order of -21°C to -25°C, and seasonal cycles from over +10°C in summer to around -45°C during polar night (e.g. McKay et al. Reference McKay, Mellon and Friedmann1998, Doran et al. Reference Doran, McKay, Clow, Dana, Fountain, Nylen and Lyons2002). The average relative humidity is approximately 50% with dry katabatic winds from the polar plateau driving rapid warming and cooling cycles during the winter.
To analyse polygon size and morphological characteristics we employed two types of image data: a GeoEye-1 satellite image acquired 22 November 2009 sampled at 0.5 m pixel-1 resolution (www.geoeye.com); and a US Geological Survey aerial photograph SN7864-1/13 acquired 21 November 1993 (courtesy of the US Geological Survey, Antarctic Resource Center) at a similar resolution. The two images were acquired under different lighting and surface snow conditions, and thus are used together to interpret landscape characteristics. The data were ingested into a geographic information system (GIS) database and co-registered. Remarkably, snow accumulations in polygon troughs, snow patches, and snowfields are similar between 1993 and 2009; only subtle differences could be noted in shape and extent of snow cover.
To determine the size of polygons for comparison to observations of the ice-table depth we examined 29 two-hectare study sites (e.g. Fig. 2). All areas were chosen on the relative level ground of valley floors. We employed the same methods successfully used to examine polygon size on Mars (Mellon et al. Reference Mellon, Arvidson, Marlow, Phillips and Asphaug2008, Reference Mellon, Malin, Arvidson, Searls, Sizemore, Heet, Lemmon, Keller and Marshall2009). We considered only the median size of polygons within these sites, because subsurface heterogeneities in the permafrost and measurement errors can affect the characteristics of any single polygon. Within each site we determined the north–south and east–west dimension of each visible polygon, measuring from trough centre-to-centre through the approximate midpoint. These values were averaged to determine each polygon's size. Previous analysis showed other axis orientations produced statistically identical results (Mellon et al. Reference Mellon, Arvidson, Marlow, Phillips and Asphaug2008). All clearly demarcated polygons within each two hectare site were measured. Isolated trough segments not obviously associated with a polygonal pattern were not considered. For each site 40–190 polygons were measured. In addition, as an indication of polygon maturity we measured the angles of trough junctions; Sletten et al. (Reference Sletten, Hallet and Fletcher2003) showed that the ratio of 120° to 90° trough junctions increases from < 1 to > 1 as the polygons mature and age.
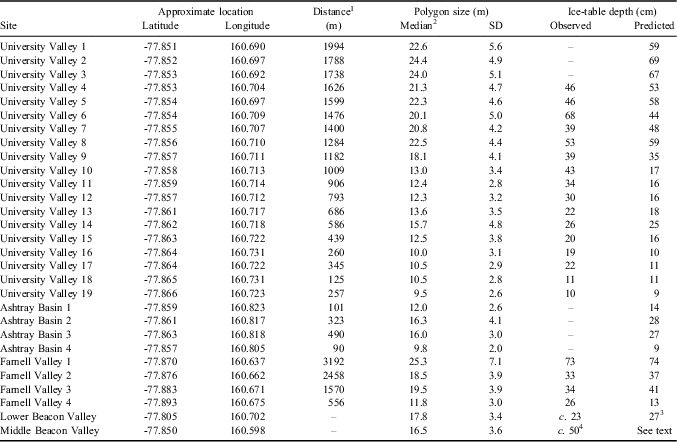
Nineteen of our study sites focus on University Valley for a detailed comparison with ice-table depth at a well-studied location and where these depths are observed to vary strongly along the length of the valley (McKay Reference McKay2009, Marinova et al. Reference Marinova, McKay, Pollard, Heldmann, Davila, Andersen, Jackson, Lacelle, Paulson and Zacny2012). We include four sites in Farnell Valley where the ice-table depth is observed to vary with a shallower pitch down the length of the valley (Marinova et al. Reference Marinova, McKay, Pollard, Heldmann, Davila, Andersen, Jackson, Lacelle, Paulson and Zacny2012), one site in lower Beacon Valley at the Black & Berg polygon-study site (Black Reference Black1973, Malin & Ravine Reference Malin and Ravine1994, Sletten et al. Reference Sletten, Hallet and Fletcher2003) dominated by sand-wedge polygons and ice-cemented soils, one site in middle Beacon Valley where polygonal ground has formed in the sublimation lag above c. 8 million-year-old massive ice (Sugden et al. Reference Sugden, Marchant, Potter, Souchez, Denton, Swisher and Tison1995), and four sites in Ashtray Basin where ground ice has not been previously reported. Table I shows polygon measurement site locations and polygon size results. Included in this table are observed ice-table depths (McKay Reference McKay2009, Marinova et al. Reference Marinova, McKay, Pollard, Heldmann, Davila, Andersen, Jackson, Lacelle, Paulson and Zacny2012). Ice-table depths at Beacon Valley sites are determined from our own field observations within polygon interiors at these exact sites.
Polygon size and ice-table statistics.

1Distance down valley measured relative to the headwall glacier, local snowfield, or the headwall region in the absence of a snowfield.
2Means and medians typically differ by < 0.5 m.
3Assuming 4°C warmer annual mean temperatures than used for higher elevation valleys.
4Typical value in this area. Middle Beacon Valley ice-table depths vary substantially within a single polygon.
Numerical model
Polygonal ground on Earth has been studied extensively and is well known to form by thermal-contraction cracking in ice-rich permanently frozen ground (e.g. Lachenbruch Reference Lachenbruch1962). To examine the nature of similar landforms on Mars, Mellon (Reference Mellon1997) and Mellon et al. (Reference Mellon, Arvidson, Marlow, Phillips and Asphaug2008) developed a physically-based, dynamic numerical model of seasonal stress and strain in permafrost. This model utilizes a finite-element algorithm, TECTON (Melosh & Raefsky Reference Melosh and Raefsky1980, Reference Melosh and Raefsky1981) with adaptations to incorporate thermal contraction and temperature-dependent rheology (Mellon et al. Reference Mellon, Arvidson, Marlow, Phillips and Asphaug2008). Ice-cemented permafrost is treated as a three-dimensional viscoelastic solid (including thermal contraction, elastic stress, viscous creep, and strain) to calculate the cycles in stress and strain fields within a polygon. Diurnal and seasonal temperatures, modelled or measured, serve as the primary input. Laboratory-based rheological properties of ice and ice-cemented soil are assumed (Durham et al. Reference Durham, Kirby and Stern1997, see Mellon et al. Reference Mellon, Arvidson, Marlow, Phillips and Asphaug2008).
From this model the peak tensile stresses, which occur internally within polygons of a given size (crack spacing) and structure, are determined. If these stresses exceed the expected tensile strength of frozen ground, the polygon will subdivide into smaller forms (Lachenbruch Reference Lachenbruch1962). By equating the peak stress with the strength, a characteristic polygon size can be determined. Previous Mars studies showed that the polygon size depends strongly on the ice-table depth, in good agreement with Mars orbital and surface observations (Mellon et al. Reference Mellon, Arvidson, Marlow, Phillips and Asphaug2008, Reference Mellon, Malin, Arvidson, Searls, Sizemore, Heet, Lemmon, Keller and Marshall2009). It was also shown that Martian polygons would become inactive if dry permafrost were deeper than several decimetres (Mellon et al. Reference Mellon, Arvidson, Marlow, Phillips and Asphaug2008).
Since these physical processes are the same on Earth and Mars, this model applies equally well to each. In addition, both Mars middle- and high-latitude regions and the Earth's inland high-elevation regions of the Dry Valleys are dominated by the stratigraphy of dry permafrost over ice-rich permafrost, and a relatively cold and dry climate. The main differences between Mars and the Antarctic Dry Valleys are lower ground temperatures (Mars has a global mean of -69°C) and a longer year (the Martian year is 1.9 Earth years).
Diurnal and seasonal temperature cycles are the primary driver of thermal contraction (Lachenbruch Reference Lachenbruch1962). As a proxy for the Beacon Heights region, we used seasonal surface temperature data from Linneaus Terrace in upper Wright Valley at nearly the same elevation (McKay et al. Reference McKay, Mellon and Friedmann1998), an area with similar soils and dry permafrost stratigraphy. Linneaus Terrace temperatures are comparable to other regions in the Dry Valleys (e.g. Doran et al. Reference Doran, McKay, Clow, Dana, Fountain, Nylen and Lyons2002) and 4°C cooler than Long Term Ecological Record (LTER) observations at the floor of Beacon Valley (Doran et al. Reference Doran, Dana, Hastings and Wharton1995). This difference is expected due to the elevation offset and adiabatic warming. Using a simple heat conduction solution developed by McKay et al. (Reference McKay, Mellon and Friedmann1998) we derive subsurface temperatures which would result from burial of the ice table for a range of depths. When the ice table is less than a few cm from the surface this proximity begins to influence the surface temperature; most observed depths are greater, so this effect is ignored.
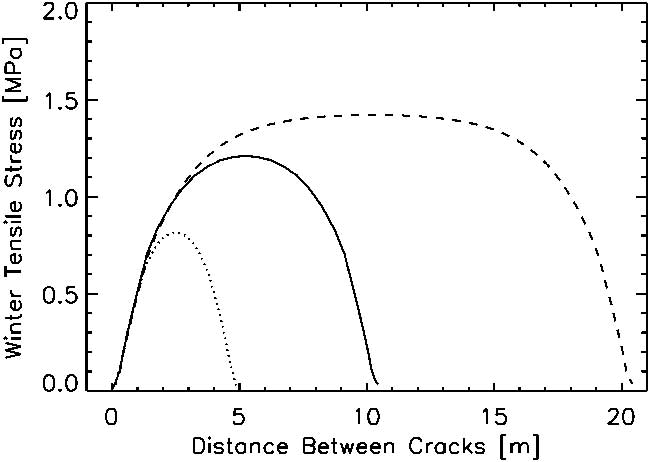
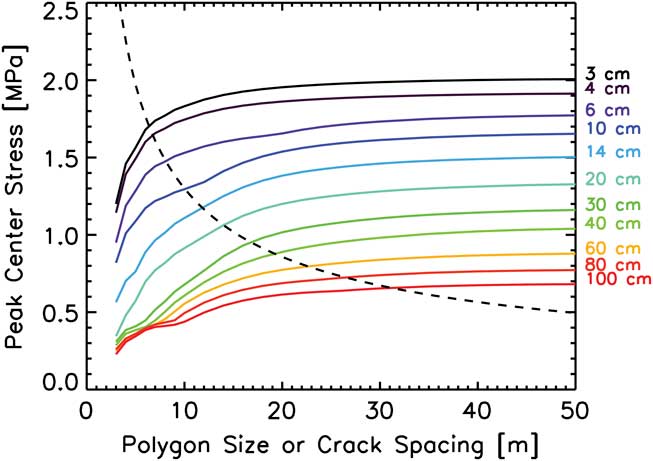
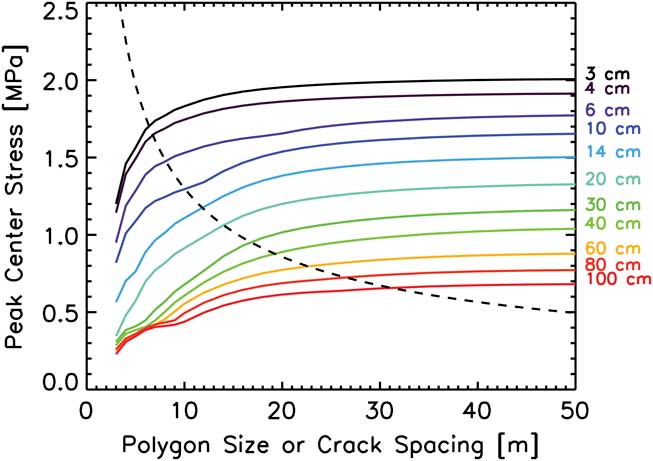
Subsurface temperatures are then input into the finite-element model to control both the thermal stresses and the rheology of the subsurface. Crack depth plays a role in determining crack strain and relieving stress; we used a fixed crack depth of 3.25 m which is adequate to arrest crack propagation (Mellon et al. Reference Mellon, Arvidson, Marlow, Phillips and Asphaug2008). We then compute the 3-axis stress field as a function of time, depth and position between the existing cracks. An example of the winter tensile stresses that occur at the ice table are shown in Fig. 3. Stresses are relieved most near the cracks and least at the polygon centre (see Lachenbruch Reference Lachenbruch1962). The peak tensile stresses at the centre of the polygons are then examined as a function of crack spacing and ice-table depth (Fig. 4).
Modelled winter time horizontal tensile stress across polygons of sizes (crack spacing) 5, 10 and 20 m. Stress is relieved by crack strain nearest to the crack. Stresses near the centre are least relieved and, if they exceed the tensile strength, can result in new fractures and subdivision of the larger polygon into smaller forms. In this example an ice-table depth of 12 cm and icy soil rheology are assumed.

Peak winter tensile stress at the centre of polygons as a function of ice-table depth and polygon size (crack spacing). Tensile strength (dashed line) is superimposed. For each polygon size when the peak stress equals the strength a corresponding ice-table depth can be determined. Ice-cemented soil is assumed, defining the tensile strength and the rheological properties of the ice-rich permafrost. Curves and inflections are largely due to competing non-linear material properties and processes with a small component of discretization noise.
To predict the characteristic size of polygons the peak stress is compared with the tensile strength of the ice-cemented soil. Relative to most rock, ice is weak and will fracture under tension at stresses of order 1 MPa by transgranular cleavage (e.g. Schulson Reference Schulson2001). However, the tensile strength depends on factors such as temperature, grain size, crystal orientation, work hardening, salt content and sample volume (see reviews by Schulson Reference Schulson2001, Reference Schulson2006, Petrovic Reference Petrovic2003). In general, ice is stronger at colder temperatures and smaller grain sizes, and weaker for larger volumes. Reported strengths vary by several MPa with these factors.
There are few applicable measurements of the strength of ice-cemented soils, in part due to a wide range of soils and the effects of unfrozen water. Nevertheless, ice-cemented soil is typically stronger than pure ice, largely due to soil grains arresting microfracture propagation. Haynes (Reference Haynes1978) measured the tensile strength of frozen Fairbanks silt to be 7–8 MPa between -30 and -40°C (applicable to the Dry Valleys). Warmer ice-rich soils weaken rapidly due to the presence of unfrozen films, while below approximately -10°C the effect is greatly reduced and frozen soil exhibits a similar temperature dependence to that of pure ice. Haynes (Reference Haynes1978) also indicated that these frozen soils were nearly two times stronger than ice at these cold temperatures.
The strength of most materials depends also on scale. Typically, laboratory measurements of strength are performed on small specimens only a few cm in size. However, the population of flaws that leads to fracture in most polycrystalline materials typically follows a Weibull distribution which dictates that weaker flaws are more likely to occur within larger volumes (e.g. Costin Reference Costin1987, Bao & Jin Reference Bao and Jin1993). Thus, a large volume of permafrost will fracture at a lower tensile stress than will a smaller volume. This strength scaling is expressed as S = So(L/Lo) -3/m , where Lo is a reference length scale relative to length scale L and So is the reference tensile strength. The Weibull modulus, m, for polycrystalline ice has been determined to be 5 (Petrovic Reference Petrovic2003). The exact reference Lo and So for ice or ice-cemented ground is not well constrained due to the wide spectrum of test conditions and soils. Extrapolating Haynes (Reference Haynes1978) measurements with an effective laboratory length scale of 2.6 cm results in strengths that are clearly too weak at polygon length scales of many metres. Therefore, we chose to match the observation that polygons 10 m in size form when the ice table is about 10 cm deep (such that Lo is 10 m and So is 1.3 MPa). We then use Weibull-based scaling to calculate the tensile strength S and predict ice-table depths for other polygon sizes.
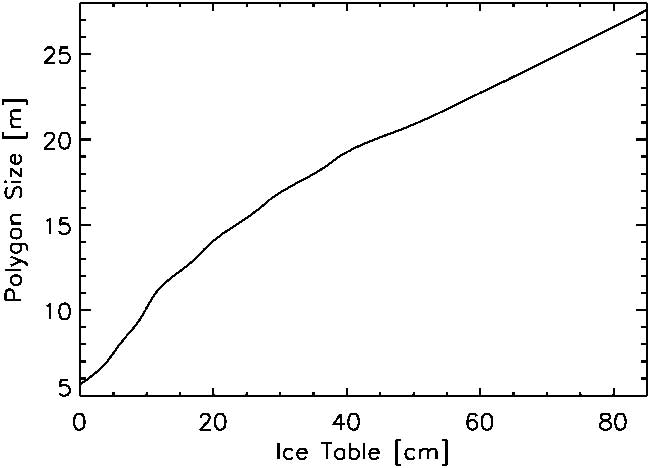
Figure 4 shows the strength as a function of polygon size superposed on our stress results. By observing where the strength equals the modelled stress a relationship between polygon size and ice-table depth can be derived as shown in Fig. 5. Small scale fluctuations in this curve are the result of interpolating between finite steps in modelled sizes and ice-table depths, whereas the overall curvature results from temperature dependencies of the ice rheology. A prediction of the ice-table depth, given an observed polygon size and the current climate condition in Beacon Heights, is therefore provided in Fig. 5.
The correlation between polygon size and ice-table depth determined from Fig. 4 for ice-cemented soil. The relationship is pinned at 10 cm ice-table depth and 10 m polygon size to estimate the absolute strength. For the range plotted the ice-table depth in centimetres as a function of polygon diameter, D, in metres is approximated by -4.1 + 0.23D + 0.11D 2.

Historical and local ground temperatures may differ from those assumed in one year at Linneaus Terrace (McKay et al. Reference McKay, Mellon and Friedmann1998) due to, for example, spatially variable soils or interannual variations in cloud cover. We, therefore, tested the sensitivity of our results to mean temperature shifts of ± 3°C. We found that polygon sizes would differ by only 10%, being smaller at colder temperatures due to higher stresses.
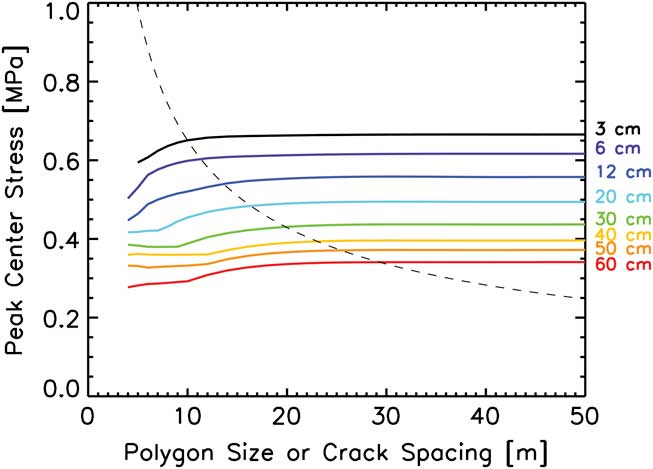
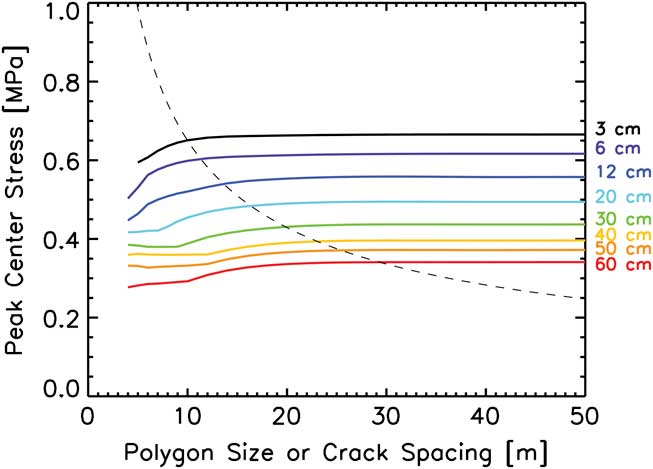
For a special case of pure subsurface ice (e.g. massive ice) buried below dry permafrost we assume the ice to be half as strong as ice-rich soil at low temperatures (Haynes Reference Haynes1978). The resulting peak tensile stress for buried massive ice is shown in Fig. 6, with the corresponding strength superimposed. Lower stresses occur due to weaker ice rheology. Resulting polygon sizes are 20–50% larger than for ice-rich soil. However, the tensile strength is not as well constrained.
Same as Fig. 4, except the tensile strength and rheological properties of pure ice are assumed resulting in lower peak stresses and weaker strengths.
Results
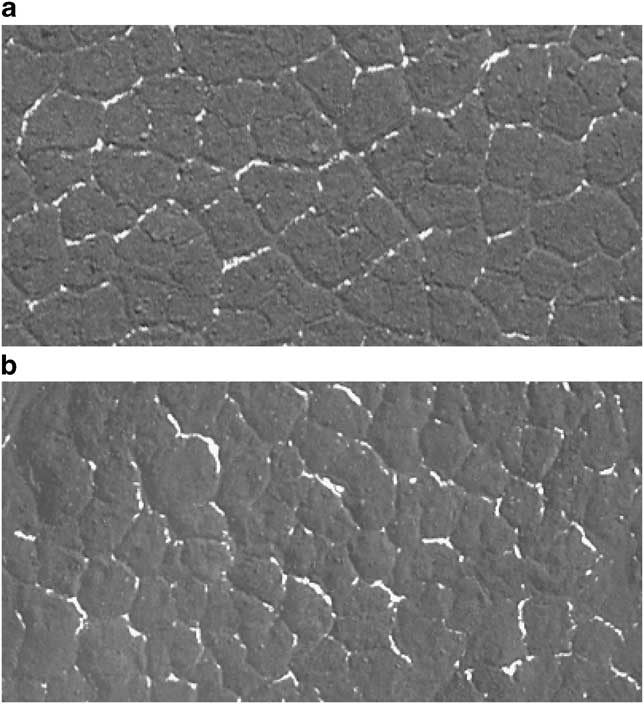
Satellite images show little morphological variation in polygons within the higher elevation regions of Beacon Heights, other than their size (see Figs 2 & 7). Polygons in University Valley clearly vary in size 2.5x between areas near the mouth of the valley and close to the glacial snowfield (Fig. 2a–c). On the other hand, the morphology remains consistent with level interior terrain and shallow troughs (on the order of 5 cm deep and 25 cm wide based on our field observations). Trough intersections are predominately triple junctions, with a strong unimodal preference for 120° equiangular junctions. Trough runs are roughly linear to sublinear. This simple morphology is observed in all of the Beacon Heights regions we examined (Fig. 7).
Comparison of polygon morphologies between a. Farnell Valley site 2, b. University Valley site 5 and c. Ashtray Basin in upper Arena Valley site 1. All sites exhibit a similar preference for regular sizes and equiangular triple junctions. Troughs vary from linear to sublinear. Polygon size varies and correlates with ice-table depth. All subframes are two hectares (200 m wide). Subframes a. and c. are from GeoEye-1 satellite data at 0.5 m pixel-1 (www.geoeye.com) and b. is from the US Geological Survey aerial photograph image SN7864-1/13.

Lower Beacon Valley sand-wedge polygons (Fig. 8a) are similar to the Beacon Heights forms, except for more sharply defined trough shoulders in the satellite image. These troughs are roughly 25 cm deep and 3 m wide based on our field observations. In contrast, middle Beacon Valley polygons (Fig. 8b) appear to have more rounded trough edges and increased interior topography (mounds and depressions). Typically middle Beacon trough depths are around 1.4 m, which may account for the rounding by increased mass wasting. We measured trough junction angles from satellite images and found the ratio of 120° to 90° junctions to be 3 in both lower Beacon Valley (Fig. 8a) and University Valley (Fig. 2b), indicating that both regions exhibit the same stage of advanced maturity and similar age.
Polygon study sites in a. the lower Beacon Valley floor, also known as the Black polygon-study site, and b. the middle Beacon Valley floor where the till is underlain by massive glacial ice. Polygons in lower Beacon Valley exhibit the most linear and distinct troughs of all the sites. Middle Beacon polygons are more rounded, likely due to sublimation loss of the buried glacial ice and surface degradation. Subframes are two hectares (200 m wide) from GeoEye-1 satellite data at 0.5 m pixel-1 (www.geoeye.com).

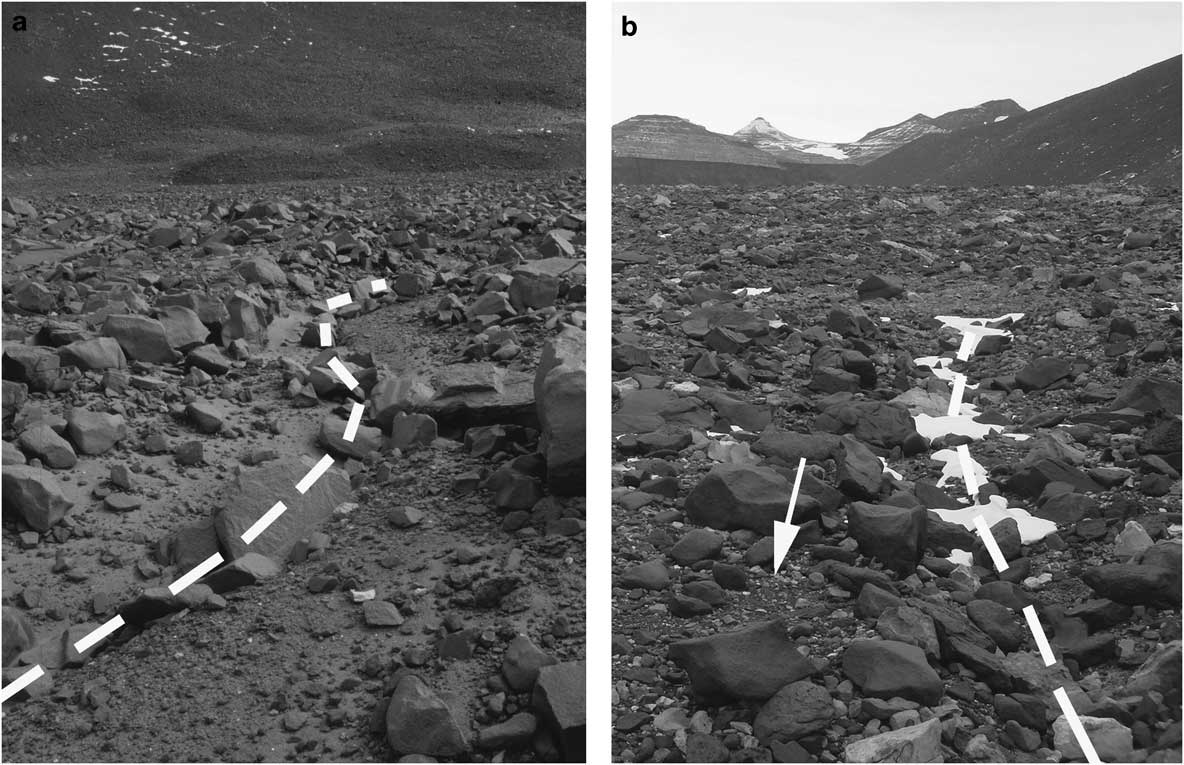
Field observations show that both Beacon Valley and Beacon Heights landscapes are dominated by rocky till and sandy-to-silty soils. While both sites exhibit abundant large boulders (> 25 cm) and boulder accumulations within troughs, study sites on the floor of Beacon Valley exhibit a high abundance of inter-boulder fine soils particularly in the troughs (Fig. 9a). In contrast, the Beacon Heights surfaces exhibit primarily small cobbles and coarse pebbles arrayed in a tightly-fit desert pavement (Fig. 9b). Troughs tend to be shallower with greater accumulations of cobbles and few fines. The availability of fines may affect trough development and depth, as well as the rate of wedge growth, by supply limiting the consumption of surface fines into the open cracks, thus accounting for the shallower troughs.
Rock and soil distributions at a. lower Beacon Valley and b. University Valley. While both land surfaces are relatively rocky, lower Beacon Valley surfaces and in particular the polygon-trough margins (to either side of the dashed line) exhibit more fine sands and silts relative to University Valley, which tends to be dominated by desert pavements (e.g. arrow). The availability of fines to fall into polygon cracks may limit wedge growth and trough development. The largest boulders seen are roughly 1 m wide.

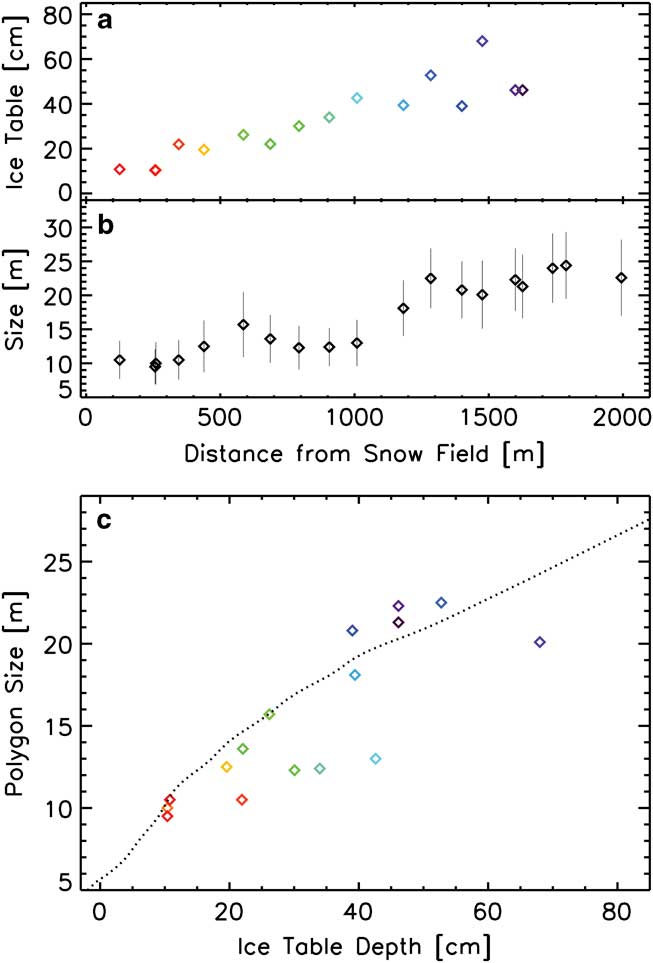
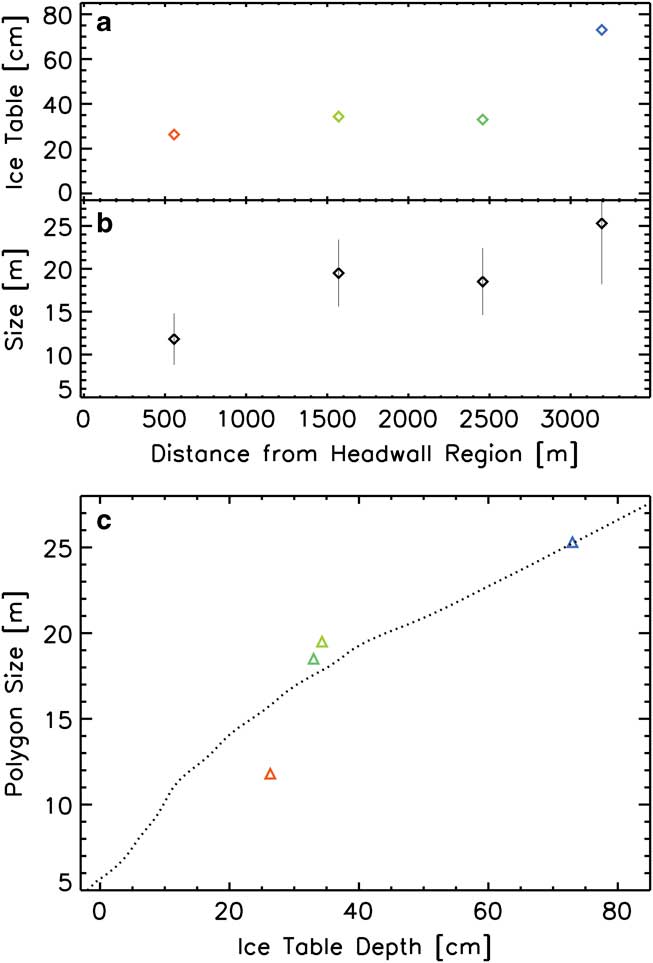
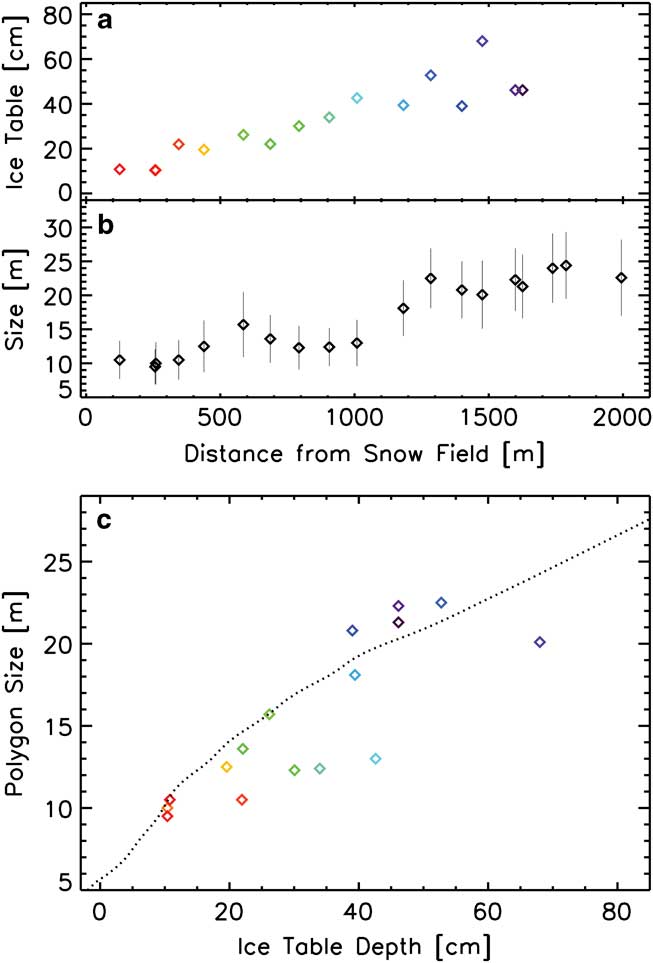
Polygon sizes vary considerably throughout the Beacon Heights region (Table I). Within each of the 29 sites the size frequency distribution was narrow and unimodal. Median sizes range by a factor of 2.5x in University Valley, 2.1x in Farnell Valley, and 1.7x in Ashtray Basin. In each of these valleys the polygon size increases consistently with distance measured from the local glacial snowfield (or southern cirque region in the case of Farnell). Figures 10a & 11a show a comparison of observed ice-table depths and our median polygon sizes for University and Farnell valleys, respectively, as a function of distance down valley. We averaged the observed ice-table depths over the same range of distances down the valley as covered by our polygon sites or we interpolated between observed depths when necessary (see Table I). At the mouths of the valleys, past the point where the polygons reach their largest sizes, they disappear entirely before occurring again on the floor of Beacon Valley.
University Valley polygon size and ice-table depth comparisons. a. Mean ice-table depth measured by McKay (Reference McKay2009) and Marinova et al. (Reference Marinova, McKay, Pollard, Heldmann, Davila, Andersen, Jackson, Lacelle, Paulson and Zacny2012) averaged or interpolated for each polygon study site. b. Median polygon sizes and standard deviations (bars). c. A correlation of polygon size as a function of ice-table depth. The predicted relationship from Fig. 5 is shown (dotted line) for comparison. Ice-table depths have not yet been measured further than 1700 m from the snowfield.
Farnell Valley polygon size and ice-table depth comparisons. a. Ice-table depth measured by Marinova et al. (Reference Marinova, McKay, Pollard, Heldmann, Davila, Andersen, Jackson, Lacelle, Paulson and Zacny2012) averaged or interpolated for each polygon study site. b. Polygon median sizes and standard deviations (bars). c. A correlation of polygon size as a function of ice-table depth. The predicted relationship from Fig. 5 is shown (dotted line) for comparison.
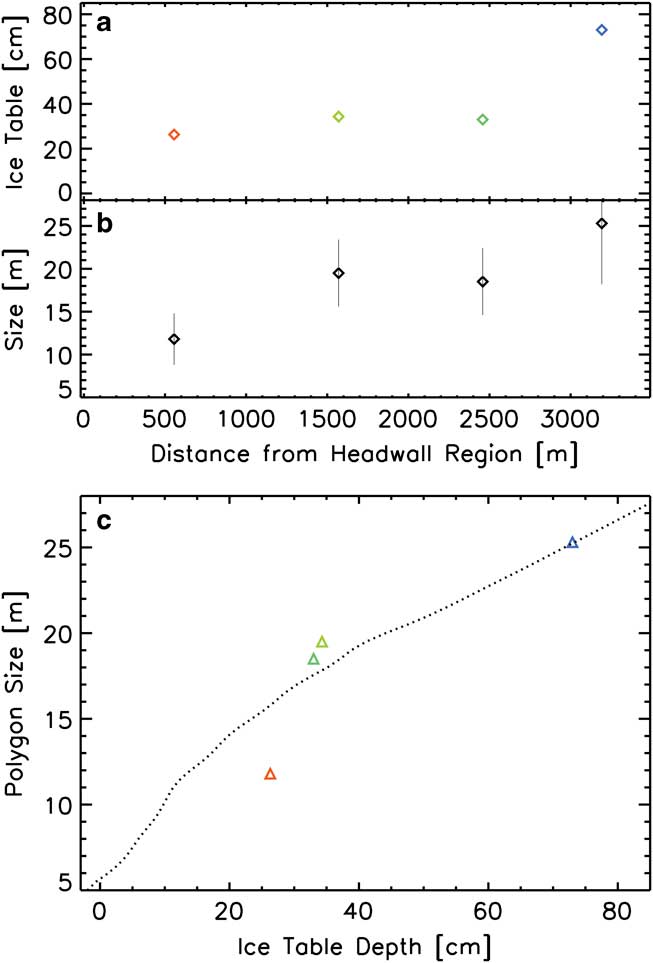
Also shown (Figs 10b & 11b) is the polygon size as a function of ice-table depth with the predicted size–depth relationship from Fig. 5 superposed. The correlation between model predictions and the observations is good. The relationship shown in Fig. 5 predicts the observed depths at most of the locations within ± 20% over the range depths from 10–73 cm.
Three polygon sites found in the middle of University Valley approximately 800–1000 m from the glacier (sites 10–12 in Table I) deviate from the predicted trend (Fig. 10a). At these locations the ice table is up to three times deeper than is predicted from the polygon sizes. This deviation suggests weaker ice-rich permafrost in this area of University Valley. The area may also exhibit a different till age, ice content, or subsurface structure than neighbouring areas, perhaps reflecting a recent local resurfacing event, and warrants further field study.
Uncertainties remain in the observations and numerical model. For example, measured ice-table depths typically vary over the area of each polygon. Local variability in the ice table will produce complex three-dimensional temperature and stress fields. Our approach assumes that the ‘average’ ice-table depth sufficiently characterizes geophysical processes. Measuring polygons for sites larger than two hectares can improve the size statistics, but will increase the likelihood that the ice table will vary within a single site. Determining polygon size from satellite images and air photos may overlook subtle troughs only visible from the ground. However, Mars polygon analyses have shown that satellite images at a similar resolution well represent ground-based observations. Numerical model uncertainties result from laboratory measurements of rheological properties, temperature history, numerical techniques, assumptions of ice content, and the tensile strength. While it is impractical to properly quantify all these uncertainties, the relationship between polygon size and ice-table depth remains clearly evident in the data and model results.
Discussion
The theoretical relationship between polygon size and ice-table depth is driven by a combination of three factors: i) the peak seasonal stress that drives the cohesive ice-cemented permafrost to fracture occurs at the ice table (see also Lachenbruch Reference Lachenbruch1962), ii) the dry permafrost acts as a thermal blanket and isolates the ice table from seasonal temperature cycles and the sharper temperature drops that follow the katabatic winds during the polar night, and iii) lower peak tensile stresses result in more widely spaced fractures to relieve the stress. Therefore, a deeper ice table results in smaller temperature cycles and weaker peak tensile stresses producing larger polygon sizes.
Perhaps the most profound implication from our results pertains to the Antarctic climate history. Polygons are generally long-lived landforms, growing at millimetre-per-year rates (Black Reference Black1973, Malin & Ravine Reference Malin and Ravine1994, Sletten et al. Reference Sletten, Hallet and Fletcher2003). Changes in the ice-table depth, whether a steady recession (Hindmarsh et al. Reference Hindmarsh, van der Wateren and Verbers1998, McKay et al. Reference McKay, Mellon and Friedmann1998) or episodic cycles (McKay Reference McKay2009), would noticeably influence polygon size and morphology. A stepwise shift in ice-table depth due to a shift in climate would result in a similar shift in polygon size and a superposition of more than one size scale exhibiting differing stages of development and degradation. Such superposition in polygon size is observed on Mars (Mellon et al. Reference Mellon, Arvidson, Marlow, Phillips and Asphaug2008) and is thought to represent a recent rapid shift in the Martian climate. Superposition is not evident in the Beacon Valley and Beacon Heights polygons, either morphologically or in the size–frequency distributions. Likewise, a steady or cyclic recession of the ice table due to climate change would result in a steady or cyclic change in polygon size. The resulting morphology would consist of a complex superposition of irregular and underdeveloped troughs, inactive troughs and generally poorly organized polygonal networks. In contrast, polygons in this region are observed to be well developed patterns of a narrow size range and with equiangular junctions, indicative of stable development over time (e.g. Sletten et al. Reference Sletten, Hallet and Fletcher2003). These morphological observations along with the observed polygon size and ice-table depth relationship indicate that the ice-table depths (or associated climate conditions) observed today are representative of that over a similar timescale for polygon development.
This conclusion leads to the question: What is the timescale for polygon development? Sletten et al. (Reference Sletten, Hallet and Fletcher2003) examined polygon morphology and growth rates at a number of sites throughout the Dry Valleys and found that during early stages of polygon development the patterns start as irregular-sized rectilinear arrays. After 103–104 years polygons begin to develop a regular size distribution, while equiangular triple junctions remain uncommon. Mature-stage polygons (after 104–106 years) exhibit regular sizes, a dominance of equiangular triple junctions and 5–6 sides, similar to our Beacon Heights and Beacon Valley observations. Bockheim et al. (Reference Bockheim, Kurz, Soule and Burke2009) suggest an additional retrogressive developmental stage for polygons older than 105 years, due to reduction in ice content by sublimation. However, this stage assumes a net loss of ground ice over time and an absence of steady or episodic recharge.
Trough morphology may, all else being equal, indicate age. As fine material is removed from the trough surface and ingested into the seasonal crack and growing wedge, the trough will widen and deepen, enhanced by compression and uplift of the polygon interior. However, if fine grained soil is in limited supply, trough development will be suppressed regardless of polygon age. The accumulation of windblown fines within the troughs will supply additional material for wedge growth, such as seen at the lower Beacon site (Fig. 9a), which may slow the deepening trough profile but allow the development of wider wedges and troughs. In contrast, the shallow and narrow troughs in the Beacon Heights polygons are dominated by smaller cobbles and the interior surfaces blanketed by desert pavements (Fig. 9b). The dearth of fine soils and windblown sediments suggests that the trough and wedge growth in these areas are supply limited. Bockheim et al. (Reference Bockheim, Kurz, Soule and Burke2009) also noted that cobbles situated over the open cracks can block surface fines from falling into the cracks.
Other evidence of polygon age, equalization of trough intersection angles and regularization of size (Sletten et al. Reference Sletten, Hallet and Fletcher2003), indicates that Beacon Valley and Beacon Heights are of a similar mature stage. Trough intersections in both University Valley and lower Beacon Valley are strongly unimodal at 120°. Polygon statistics also show unimodal and narrow size–frequency distributions. Lower Beacon tills have been estimated at > 105 years old (Bockheim 2007, Bockheim et al. Reference Bockheim, Kurz, Soule and Burke2009), and Sletten et al. (Reference Sletten, Hallet and Fletcher2003) estimates polygons in this area to be at 104–106 years old. We conclude that, like lower Beacon Valley, the Beacon Heights polygons have developed for at least 104 years to achieve the similar mature-stage morphology, and may be older than 105 years. Our results then suggest that the ice-table depth has been stable for a similar length of time.
Lacelle et al. (Reference Lacelle, Davila, Fisher, Pollard, DeWitt, Heldmann, Marinova and McKay2013) used optically stimulated luminescence dating to estimate the net accumulation of sediments mass wasted from the bluffs surrounding University Valley to be on the order of a centimetre per thousand years. This rate of slow deposition on the valley floor is comparable to other estimates of surface degradation on slopes in nearby Arena Valley (e.g. Putkonen et al. Reference Putkonen, Balco and Morgan2008). If resulting from the breakdown of Beacon Sandstone by endolithic lichen this rate could be rather steady (Friedmann & Weed Reference Friedmann and Weed1987). If ice-table recession and ice recharge occurs at rates of 0.5 mm year-1 as suggested by observations (e.g. McKay et al. Reference McKay, Mellon and Friedmann1998), then the ice table would readily adjust to the aggradation of sediments. Likewise the consumption of fines into polygon wedges would also outpace this accumulation rate and maintain the polygon form growing up through the new sediments. Alternatively if sediment accumulation is not steady but represents a few episodes of rapid thick burial, the polygons could potentially be buried and their activity reset, needing to reform new patterns within a new uniform soil.
If the ground ice is sufficiently deep, polygon formation and development will shut down entirely. Tensile strength decreases with polygon size more slowly than does the peak stress. At some ice-table depth the peak stress will no longer exceed the strength at any polygon size and fractures will no longer form. The depth at which this transition occurs is presently not clear, and is sensitive to the accuracy of the strength estimate. Nevertheless, Bockheim et al. (Reference Bockheim, Campbell and McLeod2007) noted that in areas where the ice table is deeper than about 1 m polygons are not observed. In areas such as the mouths of University and Farnell valleys polygons are absent, yet ice-cemented ground may still persist at greater depth. Polygons are not observed to be much larger than 35 m (the largest close to the mouth of University Valley), which from Fig. 4 correspond to an ice table a little over a metre deep. Yet larger polygons are predicted for greater ice-table depths. Possible explanations are that: i) the ice-table depth increases rapidly once depths exceed a metre, ii) ice is not present at locations without polygons, or iii) the strength based on Weibull theory is inaccurate for length scales larger than 35 m. Additional field investigations of the presence or absence of ground ice in areas without polygonal patterns would help to constrain this limit.
Our resulting polygon size and ice-table depth relationship can be used to predict the occurrence and depth of ground ice in areas where polygons are observed. Near the mouth of University Valley and in Ashtray Basin in upper Arena Valley we observed the sizes of polygons and predict the associated ice-table depths (see Table I). Within the polygon fields of Ashtray Basin the presence or absence of ground ice has not been previously reported, where we estimate the ice table to be beneath 10–30 cm of dry permafrost. We also observed the polygon size to increase with distance from the local snowfield. Ashtray Basin may, therefore, be a valuable study area for testing the hypothesis of snow recurrence (McKay Reference McKay2009). Additionally, within University Valley between 1700–2000 m from the glacial snowfield we predict the ice table to be 60–70 cm deep. One attempt by Marinova et al. (Reference Marinova, McKay, Pollard, Heldmann, Davila, Andersen, Jackson, Lacelle, Paulson and Zacny2012) to locate the ice table in this area, did not reach ice at 42 cm. Additional field observations would test this prediction and help to further constrain the polygon size and ice-table depth relation for the larger polygons.
Polygon sizes in lower Beacon Valley compare well with the predicted depths. Our field observations show the ice table to be 23 cm deep (Table I). We measured a median polygon size of 17.8 m. This site is also 600 m lower in elevation than the valleys in Beacon Heights, where LTER data from the floor of Beacon Valley (Doran et al. Reference Doran, Dana, Hastings and Wharton1995) indicates the annual mean ground temperature is more than 4°C warmer than Linneaus Terrace. Accounting for this 4°C temperature difference results in a predicted depth of 27 cm, in good agreement with the observations.
At the middle Beacon Valley site the story is more complex due to the dominance of massive ice in the subsurface. The predicted ice-table depth (assuming pure-ice rheology and Linneaus Terrance climate, Fig. 6) is 20 cm (and shallower still with the 4°C warmer temperatures of Beacon Valley), well short of the 50 cm depth which we observed. In short, the polygons are smaller than would be expected for the observed ice-table depth. The cause for this disagreement is not clear. The ice table in this region exhibits substantial variability with complex arrangements of clear ice and ice-cemented soils which may significantly alter the subsurface temperature and stress fields. At this site we observed depths in the range of 25–130 cm, a factor of five difference within a single polygon. Rock and soil within the massive ice may also play a role. Further study of the massive ice in this location may provide an answer.
Our results place constraints on the various hypotheses for ice-table recharge (in particular snow recurrence and thin film migration) (e.g. Hindmarsh et al. Reference Hindmarsh, van der Wateren and Verbers1998, McKay et al. Reference McKay, Mellon and Friedmann1998, McKay Reference McKay2009). If recharge is occurring, the ice table cannot fluctuate widely while polygons are forming. Large fluctuations in depth, for example between 10–20 cm, would cause a factor of 1.4 drift in polygon size resulting in a superposition of polygon scales, which is not observed. In contrast, small fluctuations in depth on the order of a cm would have an imperceptible effect on the polygon size. Therefore, recharge of the ice table and associated climate conditions need to steadily balance sublimation loss to avoid large fluctuations in ice-table depth over at least 104-year timescales and allow the polygons to develop to the observed mature stage.
Finally, this study presents some interesting analogues to Mars polygons, which are also observed to vary regionally and with latitude (e.g. Mellon et al. unpublished). Mars, being globally frozen, is known to have extensive ice-rich permafrost in middle and high latitudes (e.g. Feldman et al. Reference Feldman, Mellon, Gasnault, Maurice and Prettyman2008). Ground temperature differences with latitude are predicted to cause the ice table to deepen from high to middle latitudes (e.g. Mellon & Jakosky Reference Mellon and Jakosky1993), and polygon sizes are observed to increase by more than a factor of two over the same range. The present study provides valuable ground truth to test the polygon size and ice-table depth relationship and validation of the numerical approach. Polygon sizes measured from orbital imaging can then be an important tool to investigate the subsurface ice distribution on local and regional scales.
Conclusions
In this work we evaluated the size of polygonal-patterned ground in the Beacon Valley and Beacon Heights regions of the Antarctic Dry Valleys. We compared polygon size variations with ice-table depth (dry permafrost thickness) observations and found them to be well correlated. Comparison with a numerical model of seasonal stress in ice-rich permafrost shows that the ice-table depth is a major factor in controlling polygon size, allowing predictions of the ice-table depth to be made based on measurements of the polygon size (from remote sensing or field observations). The main reason for this correlation is that the dry permafrost acts as a thermal blanket and isolates the ice table from surface temperature cycles. In practice, the exact relationship will vary with local climate and changes in permafrost rheology (ice and rock content). Nevertheless, the predictive correlation found in University Valley applies well to Farnell Valley and Beacon Valley. In this way observations of polygon size from satellite images can be used to predict and map the depth distribution of the ice table. This analysis combination with local climate data can refine this prediction. Predictions of ice-table depths are made for Ashtray Basin in upper Arena Valley and the mouth of University Valley where ground ice at any depth has yet to be observed.
The correlation between polygon size and ice-table depth suggests that the ice table in Beacon Valley and Beacon Heights has been relatively stable for at least 104 years, the estimated timescale for polygon development. Large fluctuations in the ice-table depth would result in irregular polygon patterns and trough intersections, complex mixtures of active and failed/degraded troughs and the superposition of size scales, none of which are observed. Small-scale fluctuations (few %) or short-period excursions from the current depth (for few years) may have little effect on polygon size. Therefore, the current depth distribution of the ice table is largely representative of the past depths as polygons developed to their current state of maturity. These factors place constraints on the competing hypotheses for ice stability and recharge.
Future observations will help refine our understanding of this geophysical process, better constrain the polygon size and ice-table depth relationship, and clarify the implications for the Antarctic climate. In particular, observations of ice-table depth in regions such as Ashtray Basin and the mouth of University Valley would help test the correlation we have presented. A better understanding of polygon formation age, from exposure ages, as well as the dynamics of polygon formation through age differences laterally from the sand wedges and into the interior of polygons, would add greatly in understanding the timescale of ground ice and climate stability. Present day polygon wedge expansion rates in Beacon Heights (analogous to the Black & Berg sites throughout the Dry Valleys), would help establish current activity in relation to the age dating. Examination of the few areas that deviate from the predicted trends may also shed light on local resurfacing history and subsurface ice content.
Acknowledgements
This work was supported in part by the NASA Planetary Geology and Geophysics programme through grant NNX08AE33G. We also acknowledge support from the NASA ASTEP programme. Field work in the Antarctic Dry Valleys was supported by the NSF Office of Polar Programs. We thank Jaakko Putkonen and an anonymous reviewer for their constructive and thorough comments.