1. INTRODUCTION
Location awareness has become a fundamental service in Wireless Sensor Networks (WSNs), including military surveillance, smart city, precision agriculture and the Internet of Things (Abouzar et al., Reference Abouzar, Michelson and Hamdi2016; Wang et al., Reference Wang, Groves and Ziebart2015; Rantakokko et al., Reference Rantakokko, Rydell, Stromback, Handel, Callmer and Tornqvist2011). However, precise positioning is still a great challenge in indoor, tunnel and other harsh environments due to the lack of Global Navigation Satellite System (GNSS) signals (Fan et al., Reference Fan, Sun, Sun, Wu and Zhuang2017). In challenging environments, Ultra-Wide Bandwidth (UWB)-based localisation technology has attracted great interest due to its precise ranging, simple implementation for multiple-access communications and high reliability (Wymeersch et al., Reference Wymeersch, Lien and Win2009). UWB technology uses Time-Of-Arrival (TOA)-based ranging techniques with a fine delay resolution due to its wideband characteristics. Typically, the UWB-based ranging accuracy can reach 0·2 m in a line-of-sight environment, which provides a foundation for high-precision positioning in wireless networks (Caceres et al., Reference Caceres, Penna, Wymeersch and Garello2011; Dardari et al., Reference Dardari, Conti, Ferner, Giorgetti and Win2009).
Cooperative localisation is a promising way to improve both the coverage and accuracy of a positioning system by exploiting peer-to-peer communication and ranging (Li et al., Reference Li, Hedley and Collings2015b). In a Bayesian cooperative localisation algorithm, the agent node is treated as a random variable and its full statistical information is exchanged and updated between neighbours (Ihler et al., Reference Ihler, Fisher, Moses and Willsky2005). As a novel cooperative localisation method, a message passing algorithm maps the Bayesian inference problem to the probabilistic graphical model and employs a spatiotemporal message schedule to estimate the agent's marginal distribution by message propagation, computation and updating (Lv et al., Reference Lv, Gao, Li, Yang and Hanzo2016; Wymeersch et al., Reference Wymeersch, Lien and Win2009).
In particular, a Sum-Product Algorithm over A Wireless Network (SPAWN) is a sample-based distributed message passing algorithm which exchanges full statistical information between neighbours, resulting in significant system overhead (Wymeersch et al., Reference Wymeersch, Lien and Win2009). Based on the SPAWN, the H-SPAWN (Hybrid SPAWN) algorithm (Caceres et al., Reference Caceres, Penna, Wymeersch and Garello2011; Li et al., Reference Li, Wu, Wang, Tseng and Kuang2015a), as a typical parametric message passing method, exploits the Gaussian distribution to approximate the irregular messages and only a few Gaussian parameters need to be exchanged between agents. Gaussian parametric message approximation is also employed in Variational Message Passing (VMP) to reduce system overhead by exploiting second-order Taylor expansions (Cui et al., Reference Cui, Wang, Zhang, Zhang and Zhu2017). Sigma-Point Belief Propagation (SPBP) extends the sigma point filter to general factor structures and reformulates the messages in higher-dimensional spaces, just broadcasting a mean vector and a covariance matrix between neighbours (Meyer et al., Reference Meyer, Hlinka and Hlawatsch2014; Georges et al., Reference Georges, Xiao and Wang2016). SPBP is suitable for nonlinear systems, but not for dense networks, because the dimension and the number of sigma points depend on the number of neighbours (Meyer et al., Reference Meyer, Hlinka and Hlawatsch2014). H-SPAWN, VMP and SPBP are all devoted to alleviating the system overhead of single trial message passing and computation. However, in each iteration of these methods, all the agent nodes need to estimate their position based on all messages from neighbours, even though the contributions of some messages from neighbours may be neglected.
In dense networks, the excessive number of neighbours leads to a huge computation burden, but also may bring an adverse effect on accuracy (Jing et al., Reference Jing, Pinchin, Hill and Moore2016; Das and Wymeersch, Reference Das and Wymeersch2012; Velde et al., Reference Velde, Abreu and Steendam2015). In order to further reduce the system overhead in dense networks, some neighbour node selection schemes, also known as information censoring, have been proposed to attempt to refine the most informative neighbour subset for positioning, rather than all neighbour messages in the above-mentioned methods. Inspired by Global Navigation Satellite Systems (GNSS), Das and Wymeersch (Reference Das and Wymeersch2012) proposed the Modified Bayesian Fisher Information Matrix (MBFIM), which combines Geometric Dilution Of Precision (GDOP) with the target's prior information as the metric to remove the unreliable neighbour information and applies this node selection scheme to SPAWN. In contrast with Das and Wymeersch (Reference Das and Wymeersch2012), the factor of a neighbour's uncertainty is considered by Velde et al. (Reference Velde, Abreu and Steendam2015) in the Greedy Censoring Scheme (GCS), which proposes a Bayesian Cramer-Rao Lower Bound (BCRLB) censoring metric to predict the average position accuracy and this scheme is applied to SPBP.
In addition, the bootstrap percolation scheme has brought a new perspective to cooperative localisation due to its hierarchical gradual positioning (Lv et al., Reference Lv, Gao, Li, Yang and Hanzo2016; Vaze and Gupta, Reference Vaze and Gupta2012; Cai et al., Reference Cai, Gao, Lv, Lu and Su2014). The bootstrap percolation is introduced to iterative localisation to solve the problem of the minimum number of anchor nodes under the condition that the whole network is localised (Vaze and Gupta, Reference Vaze and Gupta2012). In order to control the error propagation in non-Bayesian cooperative localisation, a low-complexity linear least squares estimator is designed in Cai et al. (Reference Cai, Gao, Lv, Lu and Su2014) by using the bootstrap percolation with soft constraints. In combining the bootstrap percolation with Non-parametric Belief Propagation (NBP) Lv et al. (Reference Lv, Gao, Li, Yang and Hanzo2016) proposed a space-time hierarchical-graph-based cooperative localisation algorithm to reduce system overhead and control error propagation.
However, the direct use of a bootstrap percolation scheme without judgement may bring a catastrophic problem to cooperative localisation. In cooperative localisation, positioning error is related to the ranging error, the geometric configuration of reference nodes and their uncertainties. A line will be formed when the reference nodes are approximately collinear. In this case, target position estimation may be reflected on the other side of the line, thereby causing an unbearable positioning error. This phenomenon is called “flip ambiguity” (Kannan et al., Reference Kannan, Fidan and Mao2010; Han et al., Reference Han, Yue, Meng and Li2015; Wang et al., Reference Wang, Liu, Yang, Lu and Luo2013). What is more, the flip positioning result may propagate to the subsequent agent nodes, which may cause an “avalanche” error propagation in the subsequent iterations, resulting in a failure to locate a large portion of the agents.
In this paper, we focus on introducing the bootstrap percolation scheme into message-passing-based cooperative localisation in dense WSNs. In order to eliminate the potential flip ambiguities, an approximate collinear detection criterion considering the geometric configuration and uncertainties of the neighbours is proposed, and then the quality of the neighbour reference nodes is evaluated. Combining the detection results with the connection constraints, the agent nodes are divided into three categories, which are respectively approximated by the ring distribution, the Gaussian mixture distributionFootnote 1 and the Gaussian distribution. Then, a layer-by-layer message propagation and updating mechanism is designed to control the information propagation and mitigate the potential error propagation. Additionally, the Gaussian parametric message passing method is proposed to reduce the communication overhead and facilitate efficient message computation. Finally, the system overhead and performance are evaluated.
2. SYSTEM MODEL
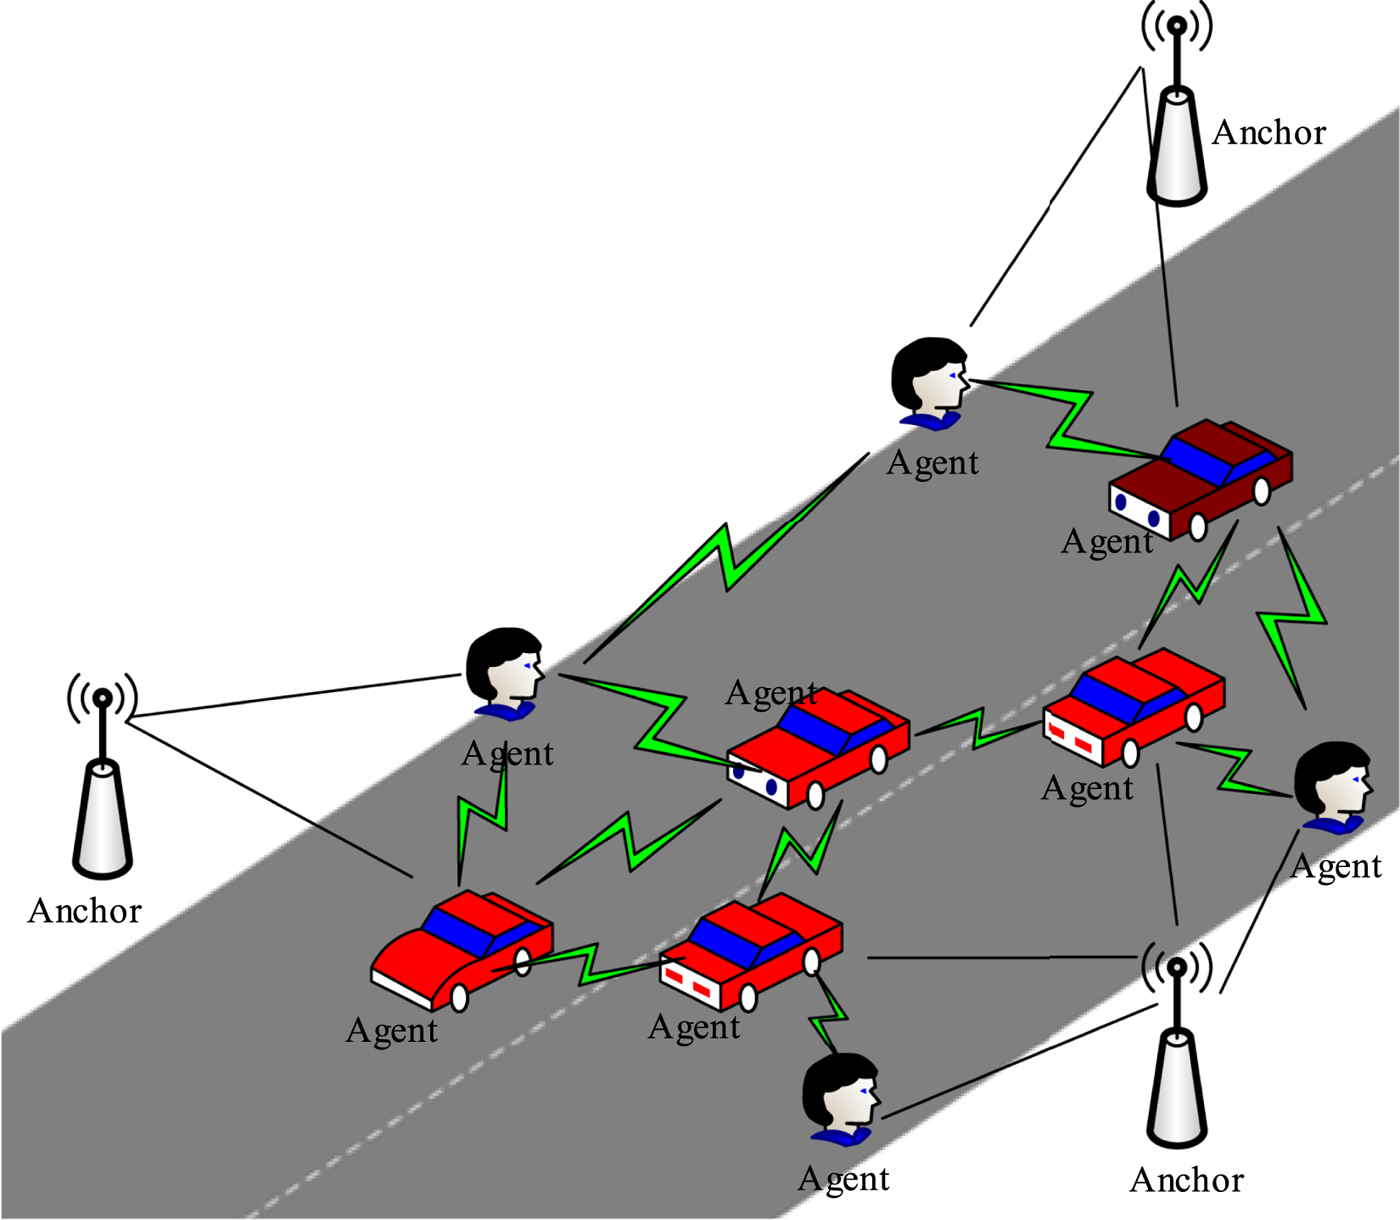
In WSNs, a small number of sensors with known positions are referred to as anchors, while the others which need to be located by employing the ranging information between their own neighbours are referred to as agents. Figure 1 shows a typical application of cooperative localisation in a road environment. In Figure 1, each agent cannot independently estimate its position based on the ranging information associated with the anchor nodes. In cooperative localisation, the agent can determine its own position by exploiting peer to peer ranging and communication between neighbours. Therefore, compared with non-cooperative localisation, cooperative localisation can significantly improve the accuracy and coverage of the positioning.
Diagram of cooperative localisation in a road environment.

We consider a two-dimensional WSN consisting of N anchor nodes and M agent nodes, which can be denoted by sets ℕ and 𝕄, respectively. We assume that all the nodes are UWB sensors because of their peer-to-peer communication and relative distance measurement capabilities. The position of the anchors is known exactly, and the agents are randomly scattered in the cooperative localisation area. Let xi = [x i y i] T be the position of node i. The agent set 𝕄 is divided into two subsets: the agents which have been located belong to set ℂ and the others still with unknown positions make up the set 𝔸. In cooperative localisation, the located agents in set ℂ have relatively small uncertainties, which can be used to assist the agents in set 𝔸. The reference node set is defined as  ${\open S} = {\open N} \cup {\open C}$. The reference nodes broadcast their own position information, while the agents belonging to set 𝔸 remain silent. Each node can range and communicate with neighbours within the maximum sense distance R. We define notation 𝕊i as the reference node set received by agent i. For each node j ∈ 𝕊i, the measurement distance from node j to node i is perturbed by measurement noise as:
 $$z_{j \rightarrow i} = \Vert {\bf x}_{j} - {\bf x}_{i}\Vert + v_{j \rightarrow i} $$
where ‖ · ‖ is the Euclidean norm and  $v_{j \rightarrow 1} \sim {\cal N}\ \lpar 0\comma \; \sigma_{j \rightarrow 1}^{2}\rpar $ is the additive white Gaussian measurement noise in the line of sight.
We define the notation  ${\open Z}_{i} = \lcub z_{j \to i} \vert \forall j \in {\open S}_{i}\rcub $ as the range measurements set for node i. The belief of agent node i, which serves as an approximation of the marginal a posteriori distribution p(xi|ℤi), is proportional to its prior distribution p(xi) and to the product of the received messages corresponding to its reference nodes. Then the belief is given as:
 $$b\lpar {\bf x}_i\rpar \propto p\lpar {\bf x}_i\rpar \prod\limits_{j \in {\open S}_i} m_{f_{i\comma j} \rightarrow i} \lpar {\bf x}_i\rpar $$
where belief b(xi) is an a posteriori distribution estimation of node i.  $m_{f_{i\comma j} \rightarrow i} \lpar {\bf x}_{i}\rpar $ is the message from node j to node i, which consists of three parts: the likelihood function p(z j→i|xi, x j) associated with the ranging measurement between node i and j, the prior distribution of node j, and the messages merging into node j. According to the message updating rule,
 $m_{f_{i\comma j} \rightarrow i}\ \lpar {\bf x}_{i}\rpar $ is calculated by:
 $$\eqalign{m_{f_{i\comma j} \to i} \lpar {\bf x}_i\rpar & \propto \vint p\lpar z_{j\to i} \vert {\bf x}_i\comma \; {\bf x}_j\rpar p\lpar {\bf x}_j\rpar \prod\limits_{u \in {\open S}_j} m_{f_{j\comma u} \to j} \lpar {\bf x}_j\rpar \hbox{d}{\bf x}_j \cr & \propto \vint p\lpar z_{j\to i} \vert {\bf x}_i\comma \; {\bf x}_j\rpar b\lpar {\bf x}_j\rpar \hbox{d}{\bf x}_j} $$
3. PROPOSED MESSAGE PASSING ALGORITHM
In this section, we present the proposed message passing-based cooperative localisation algorithm. It is well known that the target should be connected to at least three non-collinear reference nodes to obtain a two-dimensional position estimation. Based on this consensus, the idea of bootstrap percolation subject to connection and geometric constraints is exploited to classify the agent nodes. The connection constraint guarantees the number of reference nodes, and the geometric constraint ensures that the reference nodes are not approximately collinear. Considering the measurement errors, the approximate collinear reference nodes may lead to a flip ambiguity of the target position estimation. In order to eliminate the potential flip ambiguities, we propose an approximate collinear detection criterion to satisfy the geometric constraint. Then, a layer-by-layer positioning mechanism is established associated with the classification result. Finally, the Gaussian message passing localisation algorithm is employed to locate the agents gradually, based on the proposed bootstrap percolation scheme.
3.1. Message representation method
In distributed cooperative localisation, “message” refers to the node's position estimation and its uncertainty. In this work, the Gaussian distribution is used to approximate the message of the reference node, and only five real numbers (two are the mean vector and the other three are from the covariance matrix) need to be broadcast for message passing.
Without loss of generality, for reference node j ∈ 𝕊i, we assume that  $b\lpar {\bf x}_{j}\rpar = {\cal N}\, \lpar {\brmu}_{j}\comma \; \Sigma_{j}\rpar $, where
 ${\brmu}_{j}$ is the mean and Σj is the covariance matrix. The distance measurement from node j to node i is z j→i, but the information regarding the direction is unknown. Hence, the distribution of node i can be described as a ring distribution with a centre of xj and a radius of r, which can be further expressed as:
 $${\bf x}_i = {\bf x}_j + r \times \lsqb \cos \theta \sin \theta\rsqb ^{T} $$
where  ${\bf x}_{j} \sim {\cal N}\ \lpar {\brmu}_{j}\comma \; \Sigma_{j}\rpar $,
 $r \sim {\cal N}\ \lpar z_{j \rightarrow i}\comma \; \sigma_{j \rightarrow i}^{2}\rpar $, and θ ~ U(0, 2π]. It should be noted that if node j is an anchor node, then Σj = 0.
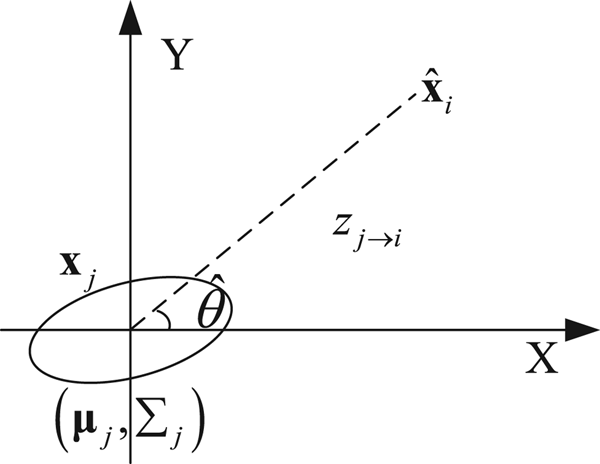
As shown in Figure 2, we assume  $\hat{{\bf x}}_{i}$ is the estimation of the node i, and
 $\hat{\theta} = \hbox{angle}\lpar \hat{{\bf x}}_{i} - {\brmu}_{j}\rpar $ is the direction between node i and node j. In order to obtain the variance
 $\sigma_{j\comma \hat{\theta}}^{2}$ associated with the marginal distribution of b(xj) along
 $\hat{\theta}$, the coordinate system is rotated anticlockwise by angle
 $\hat{\theta}$. Then the covariance matrix of xj in the new coordinate system is given as:
Variance estimation of Gaussian marginal distribution.

 $$\Sigma_{j\comma \hat{\theta}} = H_{\hat{\theta}}^{T} \Sigma_{j} H_{\hat{\theta}} $$
where:
 $$H_{\hat{\theta}} = \left[\matrix{\cos \lpar \hat{\theta}\rpar &-\sin \lpar \hat{\theta}\rpar \cr \sin \lpar \hat{\theta}\rpar & \cos \lpar \hat{\theta}\rpar }\right]$$
Hence, the  $\sigma_{j\comma \hat{\theta}}^{2}$ associated with the (1,1)-th element of
 $\Sigma_{j\comma \hat{\theta}}$ is shown as:
 $$\sigma_{j\comma \hat{\theta}}^{2} = \lsqb \cos \lpar \hat{\theta}\rpar \comma \; \sin \lpar \hat{\theta}\rpar \rsqb \Sigma_{j} \lsqb \cos \lpar \hat{\theta}\rpar \comma \; \sin \lpar \hat{\theta}\rpar \rsqb ^{T} $$
The marginal distribution of xj along any direction is still a Gaussian distribution, thus, we can rewrite Equation (4) as:
 $${\bf x}_{i} = \rmu_{j} + r_{\theta} \times \lsqb \cos \theta \sin \theta\rsqb ^{T} $$
where  $r_{\theta} \sim {\cal N}\ \lpar z_{j \rightarrow i}\comma \; \sigma_{j \rightarrow i\comma \theta}^{2}\rpar $ and
 $\sigma_{j \rightarrow i\comma \theta}^{2} = \sigma_{j \rightarrow i}^{2} + \sigma_{j\comma \theta}^{2}$.
Hence, the joint a posteriori distribution of xi is related to the number of received neighbour nodes |𝕊i|, which can further be considered as the overlapping areas of |𝕊i| rings. When |𝕊i| = 2, the intersection area of the two rings is the estimation of the target's position. This is a bimodal distribution and we employ a Gaussian mixture distribution to approximate it. For |𝕊i| ≥ 3, a steady unimodal distribution is obtained when the number of non-collinear reference nodes is no less than three and we approximate it with a Gaussian distribution.
Without loss of generality, the equation set of observation between the target and its neighbour reference nodes can be formulated as follows:
 $$\left\{\matrix{\lpar x_1 - x_i\rpar^{2} + \lpar y_1 - y_i\rpar^{2} = z_{1 \rightarrow i}^{2} \cr \vdots \cr \lpar x_n - x_i\rpar^{2} + \lpar y_{n} - y_{i}\rpar^{2} = z_{n \rightarrow i}^{2}}\right.$$
where n = |𝕊i|. We define notation  $\hat{{\bf x}}_{i}^{a}$ and
 $\hat{{\bf x}}_{i}^{b}$ as the solutions of Equation (9) when |𝕊i| = 2, and the notation
 $\hat{{\bf x}}_{i}$ for |𝕊i| ≥ 3. Then the approximate distribution can be shown as follows:
 $$p\lpar {\bf x}_i \vert {\open Z}_{i}\rpar = \left\{\matrix{C\lpar {\bf x}_{i}; \; {\bf x}_{j}\comma \; z_{j \rightarrow i}\comma \; \sigma_{j \rightarrow i}^{2}\rpar \!\comma \; \hfill & \vert {\open S}_i\vert = 1 \hfill \cr \displaystyle{1 \over 2} C_{J} \lpar {\bf x}_{i}; \; \hat{{\bf x}}_{i}^{a}\comma \; \sigma_{i}^{2}{\bf I}\rpar + \displaystyle{1 \over 2} C_{J} \lpar {\bf x}_{i}; \; \hat{{\bf x}}_{i}^{b}\comma \; \sigma_{i}^{2} {\bf I}\rpar \comma \; \hfill & \vert {\open S}_{i}\vert = 2 \hfill \cr C_{J} \lpar {\bf x}_i; \; \hat{{\bf x}}_{i}\comma \; \sigma_{i}^{2} {\bf I}\rpar \comma \; \hfill & \vert {\open S}_{i}\vert \geq 3}\right. $$
where the notations C and C J refer to the ring and Gaussian distributions, respectively. In the ring distribution, parameter xj is the centre of the ring and z j→i is the radius with a variance  $\sigma_{j \rightarrow i}^{2}$. In the Gaussian distribution, parameter
 $\hat{{\bf x}}_{i}$ is the mean,
 $\sigma_{i}^{2}{\bf I}$ is the variance matrix, and I is the identity matrix. For simplicity, let
 $\sigma_{i}^{2} = \max \lcub \sigma_{j \rightarrow i\comma \theta}^{2} \vert \forall j \in {\open S}_{i}\rcub $.
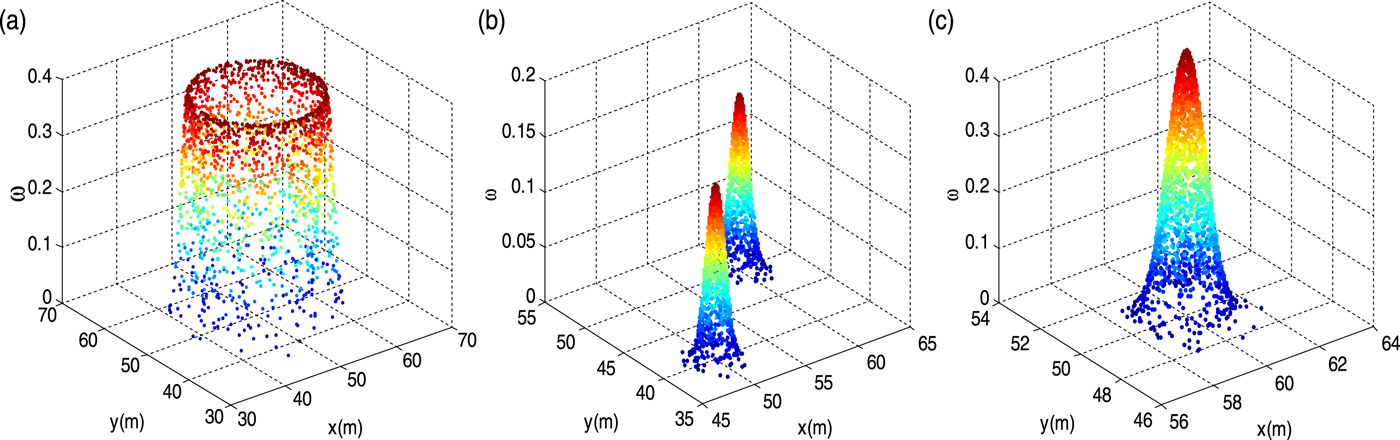
According to the above analysis, it can be seen that the distribution of the target belongs to the different families in terms of the number of the received reference nodes |𝕊i|. Therefore, for agent i, the message can be represented by randomly generating k samples  $\lcub {\bf x}_{i}\ \lpar n\rpar \comma \; w_{i} \lpar n\rpar \rcub _{n = 1}^{k}$ according to Equation (10). As an example, Figure 3 shows the generated samples associated with different distribution families.
Examples of generated samples from different distribution families for agent nodes. (a) |𝕊i| = 1, the ring distribution; (b) |𝕊i| = 2, the Gaussian mixture distribution; (c) |𝕊i| ≥ 3, Gaussian distribution.

3.2. Approximate collinear detection criterion
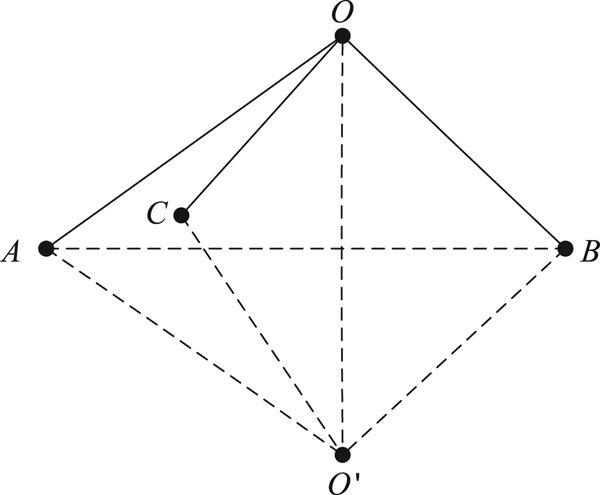
There should be at least three reference nodes for a target node to achieve a two-dimensional position estimation, but this is a necessary condition rather than a sufficient condition. Together with the existence of ranging errors, an approximate collinear geometric configuration may cause a flip ambiguity for the target. An illustration of flip ambiguity is shown in Figure 4, where the reference nodes A, B and C are approximately collinear. Hence, the position of target O may be incorrectly estimated at O ′, where O and O ′ are symmetrical about line AB. This flip ambiguity may propagate to the subsequent target nodes and lead to a fatal impact on the overall network.
An illustration of flip ambiguity.

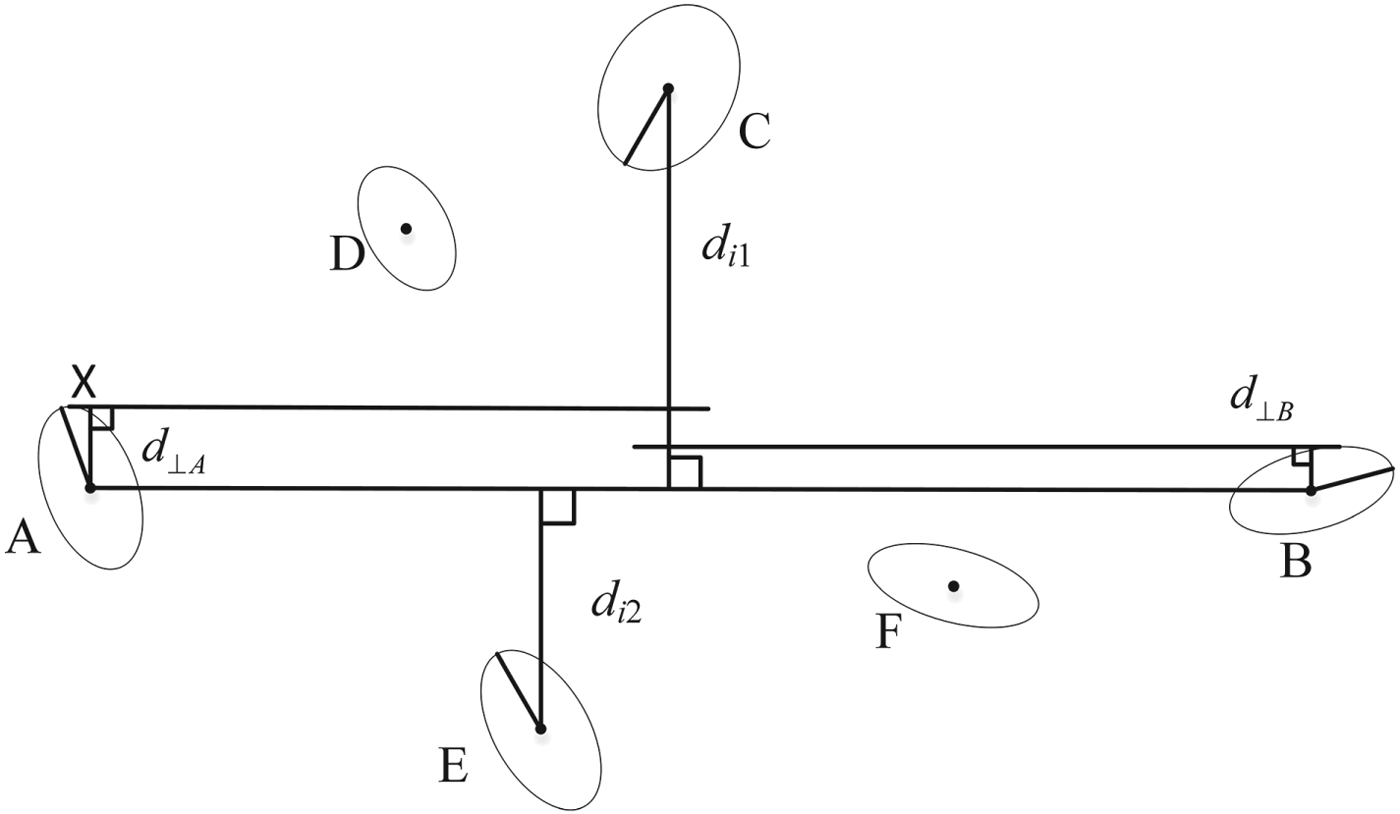
In order to avoid the flip ambiguity, we propose an approximate collinear detection criterion to judge the geometric configuration of the reference nodes. As shown in Figure 5, we assume that the reference node set of target node i is 𝕊i = {A, B, C, D, E, F}. Without considering the covariance of the reference nodes, the distance between any two reference nodes is calculated and the line with the maximum distance (for example, AB) is regarded as the boundary. Then the remaining reference nodes are divided into two subsets, which are 𝕊i1 = {C, D} and 𝕊i2 = {E, F}, respectively. We suppose that the reference nodes C and E have the maximum vertical distance to line AB in each's own subset, and their vertical distances are d i1 and d i2, respectively. The reference node set {A, B, C, E} contains the main geometric characteristic of the 𝕊i. Therefore, we just need to perform the approximate collinear detection on {A, B, C, E}, rather than 𝕊i.
The geometric configuration of the reference node set for a target. The uncertainty ellipses represent the confidence interval of probability p.

For the target node, its received message from the reference node is approximated by  ${\cal N}\ \lpar {\brmu}\comma \; \Sigma\rpar $. Here we take the reference node A in Figure 5 to further illustrate our detection criteria. We define notation r as the Mahalanobis distance (De Maesschalck et al., Reference De Maesschalck, Jouan-Rimbaud and Massart2000) of a point x = [x, y] T to the reference node A, which is given as:
 $$r^{2} = \lpar {\bf x} - {\brmu}\rpar ^{T} \Sigma^{-1} \lpar {\bf x} - {\brmu}\rpar $$
It is well known that the locus of the point x is an ellipse when r is fixed. It is assumed that the probability of a generated sample from the Gaussian distribution of the reference node A falling into the ellipse with a certain Mahalanobis distance r is p, then the relationship between r and p is deduced as follows:
 $$r = \sqrt{-2\ln \lpar 1 - p\rpar } $$
We define notation ς A as the semi-major axis of the ellipse with a certain r, and notations λ 1 and λ 2 as the two eigenvalues of the covariance matrix Σ associated with reference node A. If λ 1 > λ 2, we have:
 $$\varsigma_{A} = r \sqrt{\lambda_{1}} $$
The detailed derivation is presented in (Bensimhoun, Reference Bensimhoun2009).
As shown in Figure 5, for reference node A, d ⊥ A, the maximum vertical distance of a point X on the ellipse to the line AB, is satisfied as:
 $$d_{\perp A} \leq d_{AX} \leq \varsigma_{A} $$
where d AX is the distance from point X to the ellipse centre. It is obtained that  $d_{\perp B} \leq \varsigma_{B}$ for reference node B in the same way. Then it can be shown that:
 $$d_{\perp {\rm m}} = \max\ \lcub d_{\perp A}\comma \; d_{\perp B}\rcub \leq \max \lcub \varsigma_{A}\comma \; \varsigma_{B}\rcub = \varsigma_{\rm m} $$
Without loss of generality, it is assumed that d i1 ≥ d i2 as shown in Figure 5, and a threshold  $\bar{\varepsilon} > 0$ is predefined. Then, the approximate collinear detection criterion is shown as:
 $$\left\{\matrix{d_{i1} + d_{i2} - \varsigma_{C} - \varsigma_{E} - 2\varsigma_{\rm m} > \bar{\varepsilon} \quad s.t.\ d_{i2} \geq \varsigma_{\rm m} + \varsigma_{E} \cr d_{i1} - \varsigma_{C} - \varsigma_{\rm m} > \bar{\varepsilon} \quad s.t.\ d_{i2} < \varsigma_{\rm m} + \varsigma_{E}}\right. $$
Hence, it is considered that the reference nodes are not approximately collinear when their geometric configuration satisfies the constraint of Equation (16), otherwise, it may lead to flip ambiguity in the network.
3.3. Bootstrap percolation scheme
In this subsection, the bootstrap percolation scheme is introduced into message passing-based cooperative localisation to control the information propagation between neighbours. We define notation  ${\cal H}^{1}$ as the set of agent nodes which are located in the l-th iteration. Then, the set of located agent nodes given by the previous l iterations is achieved as:
 $${\cal C}^{l} = \mathop{\cup}\limits_{m} {\open H}^{m}\comma \; m = 1\comma \; 2\comma \; \cdots\comma \; l - 1 $$
Therefore, in the l-th iteration, the set of reference nodes is  ${\cal S}^{l} = {\cal N} \cup {\cal C}^{l}$, and the set of the remaining agents with unknown position is
 ${\cal A}^{l} = {\cal M}^{l} \backslash {\cal C}^{l}$. Here, we define the piecewise function T f (·) which is associated with the number of reference nodes of the target i as:
 $$T_{f} \lpar \vert {\cal S}_{i}\vert \rpar = \left\{\matrix{1\comma \; \vert {\cal S}_{i}\vert = 1\comma \; \cr 2\comma \; \vert {\cal S}_{i}\vert = 2\comma \; \cr 3\comma \; \vert {\cal S}_{i}\vert \geq 3\comma \; }\right. $$
Then, 𝔸l is divided into three subsets, which are denoted as:
 $${\open A}_{t}^{l} = \lcub i \vert i \in {\open A}^{l}\comma \; T_{f} \lpar \vert {\open S}_{i}^{l}\vert \rpar = t\rcub $$
where t = 1, 2, 3. As analysed in Section 3.1, the distribution of the target i is a ring when  $i \in {\open A}_{1}^{l}$, and it is a Gaussian mixture distribution in the case of
 $i \in {\open A}_{2}^{l}$. However, for
 $i \in {\open A}_{3}^{l}$, according to the approximate collinear detection result of 𝕊i, it may have two different types of distribution: the Gaussian mixture distribution and the Gaussian distribution. Therefore, for each target
 $i \in {\open A}_{3}^{l}$, we assume
 $i \in {\open A}_{3+}^{l}$ if it satisfies Equation (16), otherwise, we assume
 $i \in {\open A}_{3-}^{l}$. Combining the approximate collinear detection result with the function T f( · ), we re-divide 𝔸l as:
 $${\open B}_{c}^{l} = \left\{\matrix{{\open A}_{1}^{l}\comma \; \hfill & c = 1\comma \; \cr {\open A}_{2}^{l} \hbox{U}\, {\open A}_{3-}^{l}\comma \; \hfill & c = 2\comma \; \cr {\open A}_{3+}^{l}\comma \; \hfill & c = 3\comma \; }\right. $$
where c is the confidence threshold and c = 1, 2, 3.
It can be seen from Equation (20) that the agent nodes belonging to  ${\open B}_{3}^{l}$ have the highest confidence and can be located without flip ambiguities. Thus,
 ${\open H}^{l} = {\open B}_{3}^{l}$ when
 ${\open B}_{3}^{l} \ne\ \emptyset$, while the agent nodes belonging to
 ${\open B}_{1}^{l}$ and
 ${\open B}_{2}^{l}$ just update their distribution. As the iteration proceeds,
 ${\open B}_{2}^{l}$ will replace
 ${\open B}_{3}^{l}$ to be located when
 ${\open B}_{3}^{l} = \emptyset$, and
 ${\open H}^{l} = {\open B}_{2}^{l}$ is achieved. To this end, all the agent nodes will be located in this layer-by-layer manner. According to this scheme, the subset with the highest confidence has the priority to be located, thus, ℍl can be described as:
 $${\open H}^{l} = \lcub i \vert i \in {\open B}_{c}^{l}\comma \; c = \max \lcub 1\comma \; 2\comma \; 3\rcub \rcub \comma \; \quad \hbox{s.t.}\ {\open B}_{c}^{l} \ne\ \emptyset $$
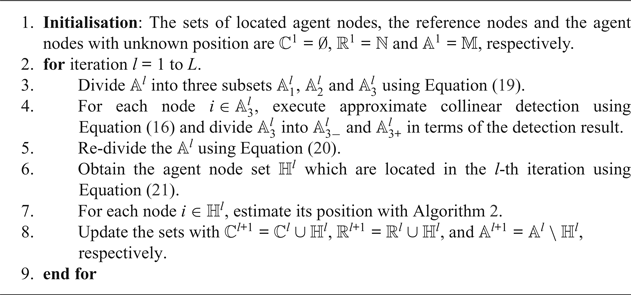
The detailed bootstrap percolation scheme is summarised in Algorithm 1.
Bootstrap percolation scheme.

3.4. Message computation and updating
As mentioned above, the reference node set includes two types of nodes: the anchor nodes with exact position and the located agent nodes with a certain uncertainty. According to the message computation rule shown in Equation (3), the message from anchor a to target i is simplified as:
 $$M_{f_{i\comma a} \rightarrow i} \lpar {\bf x}_{i}\rpar \propto p\lpar z_{a \rightarrow i} \vert {\bf x}_{i}\comma \; {\bf x}_{a}\rpar \propto \displaystyle{1 \over {\sqrt {2\pi \sigma _{a\to i}^2 } }} \exp \left\{- \displaystyle{{{\lpar {z_{a\to i}-\Vert {{\bf x}_a-{\bf x}_i} \Vert } \rpar }^2} \over {2\sigma_{a\to i}^2 }}\right\}$$
where xa is the position of anchor a.
For the agent node j ∈ 𝕊i, the message from node j to target i is expressed as:
 $$m_{f_{i\comma j} \rightarrow i} \lpar {\bf x}_{i}\rpar \propto \vint \exp \left\{-\displaystyle{{{\lpar {z_{j\to i}-{\rm \Vert }{\bf x}_j-{\bf x}_i{\rm \Vert }} \rpar }^2} \over {2\sigma_{j\to i}^2 }}\right\}{\cal N}\ \lpar {\brmu}_{j}\comma \; \Sigma_{j}\rpar \, \hbox{d}{\bf x}_{j} $$
It is not possible to compute the Two-Dimensional (2D) integrations in Equation (23) directly because of the nonlinearity of the ranging likelihood function. The nonlinear equation ‖xj − xi‖ is linearized by using a first-order Taylor expansion around the position estimations of node i and j, which is shown as:
 $$\eqalign{\Vert {\bf x}_{j} - {\bf x}_{i}\Vert &= \Vert \hat{{\bf x}}_{j \rightarrow i}\Vert - \displaystyle{{{\hat{{\bf x}}}_{j\to i}} \over {\Vert {{\hat{{\bf x}}}_{j\to i}} \Vert }} \lpar {\bf x}_{j} - {\bf \mu}_{j}\rpar + \displaystyle{{{\hat{{\bf x}}}_{j\to i}} \over {\Vert {{\hat{{\bf x}}}_{j\to i}} \Vert }} \lpar {\bf x}_{i} - \hat{{\bf x}}_{i}\rpar \cr &= \Vert \hat{{\bf x}}_{j \rightarrow i}\Vert - \displaystyle{{{\hat{{\bf x}}}_{j\to i}} \over {\Vert {{\hat{{\bf x}}}_{j\to i}} \Vert }} \lsqb \lpar {\bf x}_{j} - {\bf x}_{i}\rpar + \hat{{\bf x}}_{j \rightarrow i}\rsqb } $$
where  $\hat{{\bf x}}_{j \rightarrow i} = \hat{{\bf x}}_{i} - {\brmu}_{j}$. Substituting Equation (24) into Equation (23), Equation (25) may be derived:
 $$m_{f_{i\comma j} \rightarrow i} \lpar {\bf x}_{i}\rpar \propto \exp \left[-\displaystyle{{1}\over{2}} \left(\hat{{\bf x}}_{j \rightarrow i} - {\bf z}_{j \rightarrow i} \displaystyle{{\hat{{\bf x}}_{j \rightarrow i}}\over{\Vert \hat{{\bf x}}_{j \rightarrow i}\Vert }}\right)^{\rm T} \Sigma_{j + z}^{-1} \left(\hat{{\bf x}}_{j \rightarrow i} - z_{j \rightarrow i} \displaystyle{{\hat{{\bf x}}_{j \rightarrow i}}\over{\Vert \hat{{\bf x}}_{j \rightarrow i}\Vert }}\right)\right]$$
where  $\Sigma_{j + z} = \Sigma_{j} + \sigma_{j \rightarrow i}^{2}{\bf I}$.
According to the message update rule, the weights of the samples for target i can be updated as follows:
 $$w_{i}^{l} \lpar n\rpar = w_{i}^{l} \lpar n\rpar \prod\limits_{j \in {\open S}_{i}} m_{f_{i\comma j} \rightarrow i} \lpar {\bf x}_{i}^{l} \lpar n\rpar \rpar $$
Normalising the samples so that  $\sum_{n = 1}^{k}\ w_{i}^{l} \lpar n\rpar = 1$, we then estimate the mean and covariance of target i as follows:
 $${\brmu}_{i} = \sum_{n = 1}^{k} w_{i} \lpar n\rpar {\bf x}_{i} \lpar n\rpar $$
 $$\Sigma_{i} = \displaystyle{{\sum_{n = 1}^{k} w_{i} \lpar n\rpar \lpar {\bf x}_{i} \lpar n\rpar - {\brmu}_{i}\rpar \lpar {\bf x}_{i} \lpar n\rpar - {\brmu}_{i}\rpar ^{\rm T}}\over{1 - \sum_{n = 1}^{k} \lpar w_{i} \lpar n\rpar \rpar ^{2}}} $$
In the subsequent iterations, the agent node i is treated as a reference node to broadcast its Gaussian parameters  $\lpar {\brmu}_{i}\comma \; \Sigma_{i}\rpar $ to its neighbours.
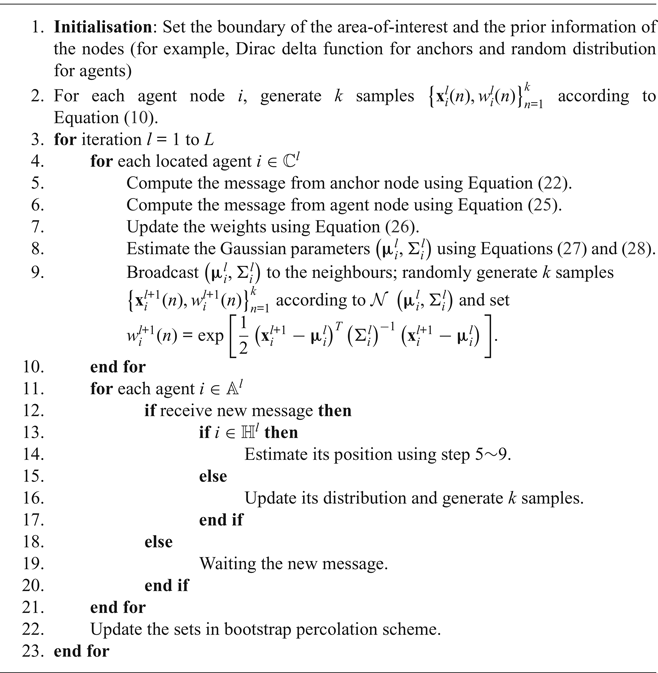
Based on the analysis above, the proposed cooperative localisation with bootstrap percolation scheme is described in Algorithm 2.
Proposed cooperative localisation algorithm with bootstrap percolation scheme

4. SYSTEM OVERHEAD
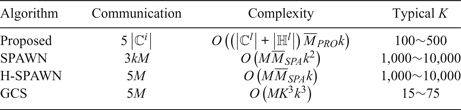
In this study, the communication overhead is reduced by: (1) adopting a Gaussian parametric message passing rule and (2) censoring and blocking the agents with unknown position from broadcasting their messages. Thus, the communication overhead of the entire network of the proposed algorithm is 5|ℂl| per iteration, while that of H-SPAWN (Caceres et al., Reference Caceres, Penna, Wymeersch and Garello2011) and GCS (Velde et al., Reference Velde, Abreu and Steendam2015) is 5M, where |ℂl| ≤ M. For smaller l, this variation is larger. For SPAWN (Wymeersch et al., Reference Wymeersch, Lien and Win2009), it is 3kM, where k is the number of weighted samples.
Computational complexity is related to the number of samples and the number of messages involved in positioning. The complexity is proportional to the number of samples for the proposed algorithm and H-SPAWN, while for SPAWN, it relies on the square of the number of samples. It should be noted that since the proposed algorithm makes full use of the reference nodes to roughly estimate the target's distribution, the number of used weighted samples in the proposed algorithm (for example, 200) is much smaller than for SPAWN and H-SPAWN (for example, 2,000). GCS exploits an SPBP algorithm to estimate the target position, and its complexity is cubic in the number of sigma points and, also, in the number of selected neighbour nodes K (Meyer et al., Reference Meyer, Hlinka and Hlawatsch2014).
The average number of neighbours involved in positioning is exploited to evaluate the influence of the proposed bootstrap percolation scheme on the complexity. We consider a a × a cooperative localisation area with N anchors and M agents. Assuming that the maximum sense distance between nodes is R, for each target node in SPAWN and H-SPAWN, the average number of links connected to neighbours is:
 $$\overline{M}_{SPA} = \displaystyle{{N + M}\over{a^{2}}} \times {\bf \pi} R^{2} = {\bf \pi} \lpar N + M\rpar \left(\displaystyle{{R}\over{a}}\right)^{2} $$
GCS uses a fixed number of neighbour nodes K. While for the proposed algorithm, the agents with unknown position remain silent, thus, the average number is:
 $$\overline{M}_{PRO} = \displaystyle{{N + \vert {\open C}^{l}\vert }\over{a^{2}}} \times {\bf \pi} R^{2} = {\bf \pi} \lpar N + \vert {\open C}^{l}\vert \rpar \left(\displaystyle{{R}\over{a}}\right)^{2} $$
In addition, it should be noted that all the M agents need to be computed in SPAWN, H-SPAWN and GCS, but for the proposed algorithm, only the agents belonging to set  ${\open C}^{l} \cup {\open H}^{l}$ need to be computed. The detailed communication overhead and computational complexity of the three algorithms are summarised in Table 1.
System overhead comparison

5. SIMULATION RESULTS AND DISCUSSIONS
5.1. Evaluation of the approximate collinear detection criterion
In this subsection, the performance of the approximate collinear detection criterion (Equation (16)) is evaluated by numerical simulations. First of all, it is essential to determinate whether the estimated position is a flip ambiguity or not. In Kannan et al. (Reference Kannan, Fidan and Mao2010), any position error larger than R/5 is treated as a substantial flip ambiguity. This metric is not appropriate when the ranging noise changes. In Han et al. (Reference Han, Yue, Meng and Li2015), a flip ambiguity is defined as where the target position result and its actual position are not at the same side of the reference nodes. However, this definition is too loose for a sample-based message passing cooperative localisation algorithm. In our definition, it is not a flip ambiguity if the position result meets the following conditions at the same time: (1) the position result and its actual position are at the same side of the reference nodes and (2) the position result must fall within the 95% confidence interval of its prediction distribution obtained by Equation (10). Otherwise, we assume it is a flip ambiguity.
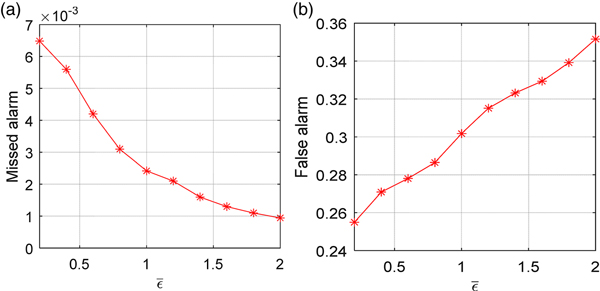
Figure 6 illustrates the ratios of missed alarm and false alarm of the proposed approximate collinear detection criterion with respect to the predefined threshold  $\bar{\varepsilon}$. In each simulation, 10,000 detections were randomly generated. The ranging noise was σ = 0 · 5 m and the predefined threshold
 $\bar{\varepsilon}$ varied from 0·2 m to 2 m. Figure 6(a) shows the ratio of missed alarm to all the flip occurrences. It can be seen from Figure 6(a) that this ratio always maintains a very low probability with different
 $\bar{\varepsilon}$, even in the case of
 $\bar{\varepsilon} = 0{\cdot}2\, \hbox{m}$; the highest ratio is only 0·65%. Figure 6(b) shows the ratio of false alarms to all the non-colinear estimations. It can be observed that as increases, the ratio of false alarms also increases and it is up to 35·1% when
 $\bar{\varepsilon} = 2\, \hbox{m}$.
The performance of the approximate collinearity detection criterion, where σ = 0·5 m and  $\bar{\varepsilon}$ varies from 0·2 m to 2 m. (a) Missed alarm. (b) False alarm.

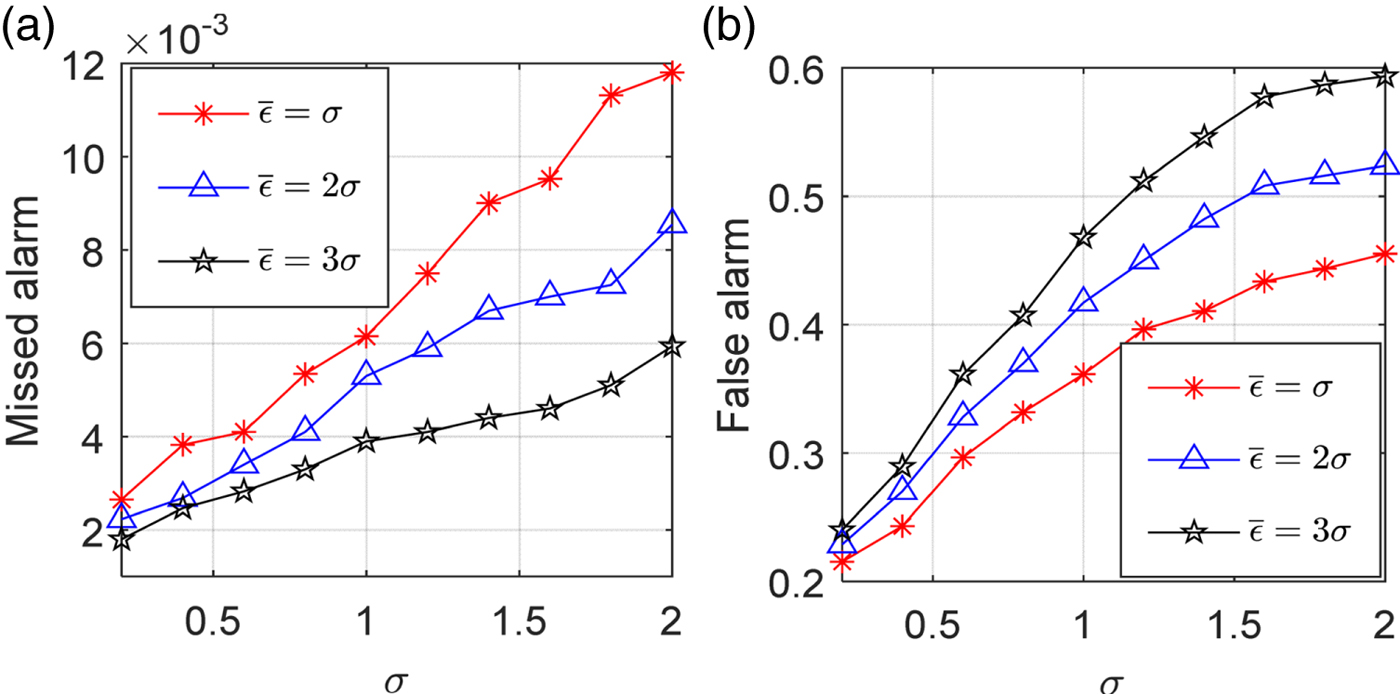
The influence of the ranging noise and threshold on the detection performance is shown in Figure 7. The threshold is set to  $\bar{\varepsilon} = \sigma/2\sigma/3\sigma$, and the ranging noise varies from 0·2 m to 2 m. As is clearly shown in Figure 7, both the ratios of missed alarms and false alarms increase with the increase of σ. When σ is fixed, as
 $\bar{\varepsilon}$ increases, the ratio of missed alarms reduces, but the ratio of false alarms increases. Specifically, taking σ = 2 m as an example, when the values of
 $\bar{\varepsilon}$ are σ, 2σ and 3σ, the ratios of missed alarms are 1·2%, 0·85% and 0·59%, showing a downtrend, while the ratios of false alarms present an uptrend; they are 45·5%, 52·4% and 59·4%, respectively. The extremely low missed alarms ratio reflects the excellent reliability of the detection scheme. In the case of a large σ, the high false alarms ratio may bring a negative impact on the localizability of the entire network.
The performance of the approximate collinearity detection criterion, where  $\bar{\varepsilon } = \sigma /2\sigma /3\sigma$ and σ varies from 0·2 m to 2 m. (a) Missed alarm. (b) False alarm.

5.2. Small-scale experiment
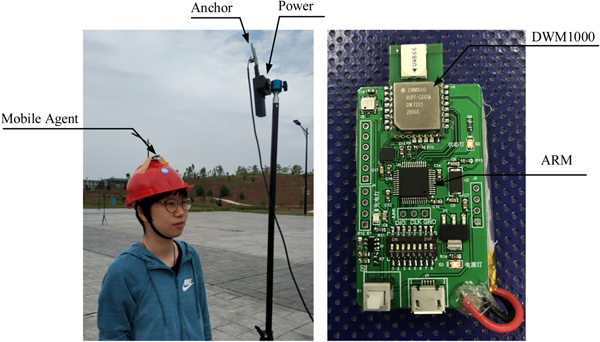
To validate the proposed algorithm, a small wireless network with eight nodes was built in the outdoor open area of our university. The UWB node is shown in Figure 8, which consisted of a DWM1000 radio sensor and a 32-bit ARM Cortex-M3 processor as the control unit. The DWM1000 is an IEEE802.15.4-2011 UWB compliant wireless transceiver module based on DecaWave's DW1000 IC, which supports high-density data transmission within a radius of 20 m. As shown in Figure 8, the anchor node and the static agent node were fixed on the tripod, and the mobile agent node was fixed on the pedestrian's helmet.
Outdoor positioning environment.

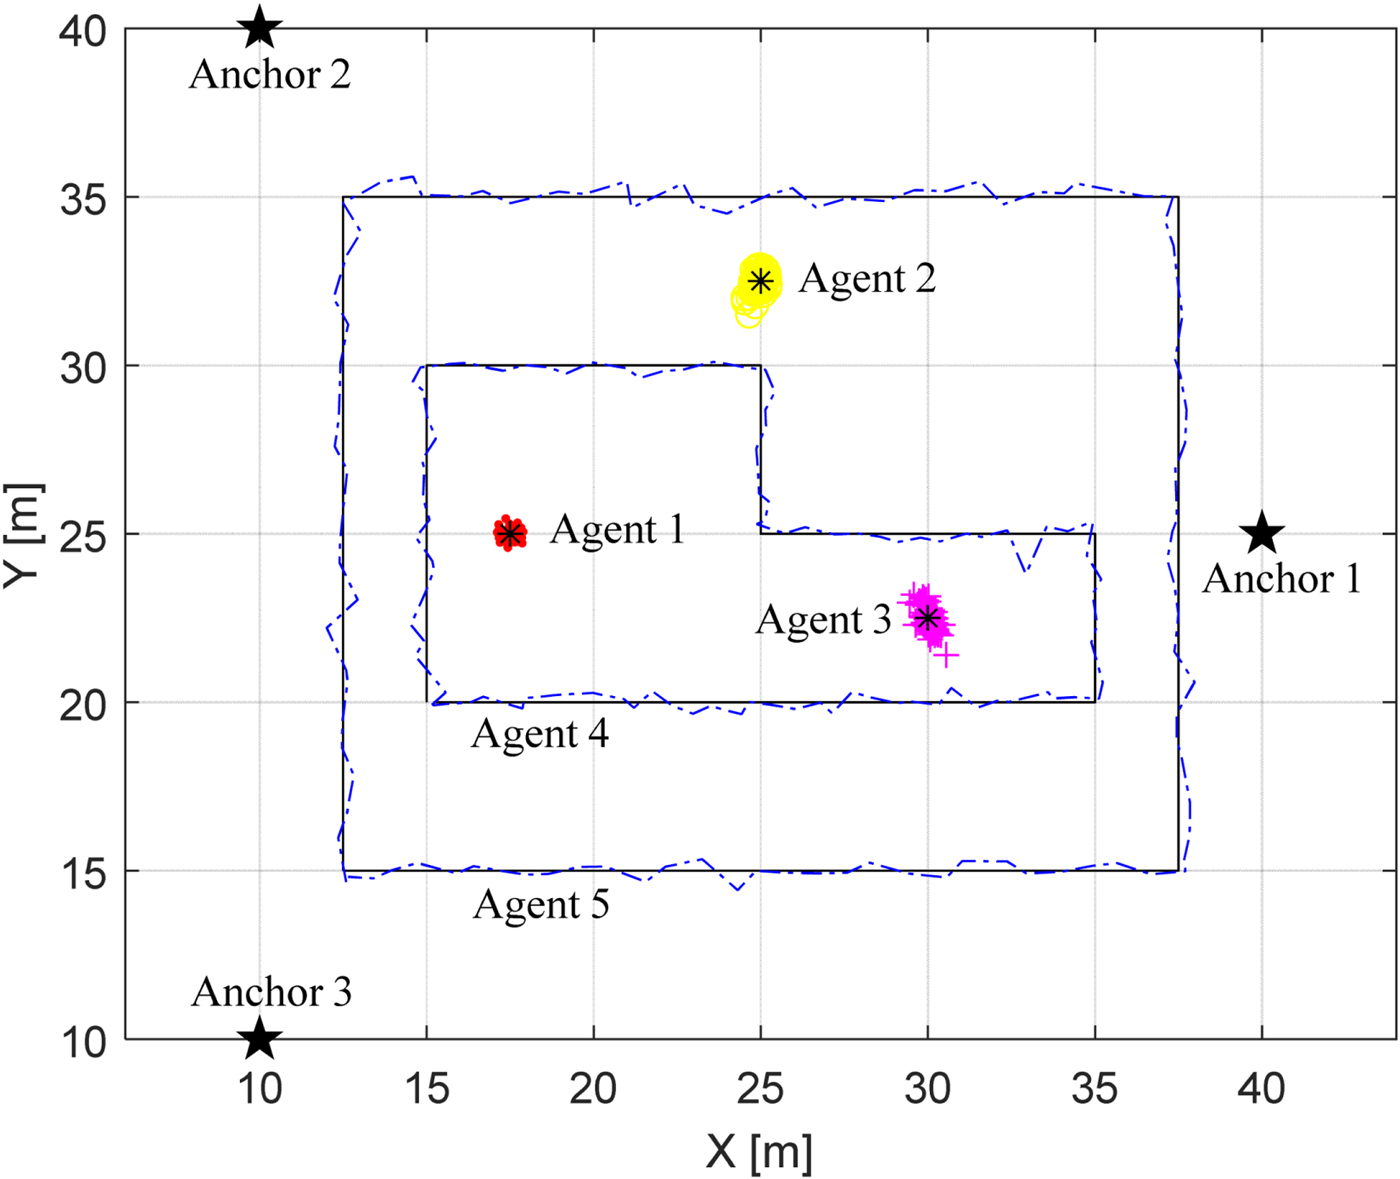
The experimental deployment contained three anchor nodes (Anchors 1, 2, 3), three static agent nodes (Agents 1, 2, 3) and two mobile agent nodes (Agents 4, 5) moving along the trajectories (black line) are shown in Figure 9. In our experiment, the coordinates of the anchors were known exactly, and the agents had no useful information about their location. Throughout the experiment, the connectivity of the five agent nodes are shown in Table 2. It can be seen that the agent node is connected to at most two anchor nodes, and sometimes even three of them are connected to only one anchor, which indicates that none of the agent nodes can estimate its position using the non-cooperative localisation method.
The deployment of the wireless network and the positioning results.

Connectivity of the agent nodes in Figure 9

In one of our experiments, the positioning results of the agent nodes are also shown in Figure 9. It can be seen that the position estimates of the three static agent nodes are all close to their true values. In particular, the position estimation of static agent node 1 has the smallest dispersion and the highest accuracy because it can be connected to two anchor nodes and its neighbours have a good geometric distribution. The two blue dotted lines are the estimated trajectories of the mobile agent nodes. It is shown that the estimated trajectories are consistent with the given paths, indicating that the mobile agents can also achieve accurate position estimation.
The coordinates of the three static agent nodes can be accurately measured manually. Hence, the position error of the static agent at time slot t is defined as  $\Vert \hat{{\bf x}}_{i}^{\lpar t\rpar } - {\bf x}\Vert $. For the mobile agent node, the projection of each estimated position
 $\hat{{\bf x}}_{i}^{\lpar t\rpar }$ on the given path is first calculated and denoted as
 $\hat{{\bf x}}_{i\comma proj}^{\lpar t\rpar }$ and then its positioning error is defined as
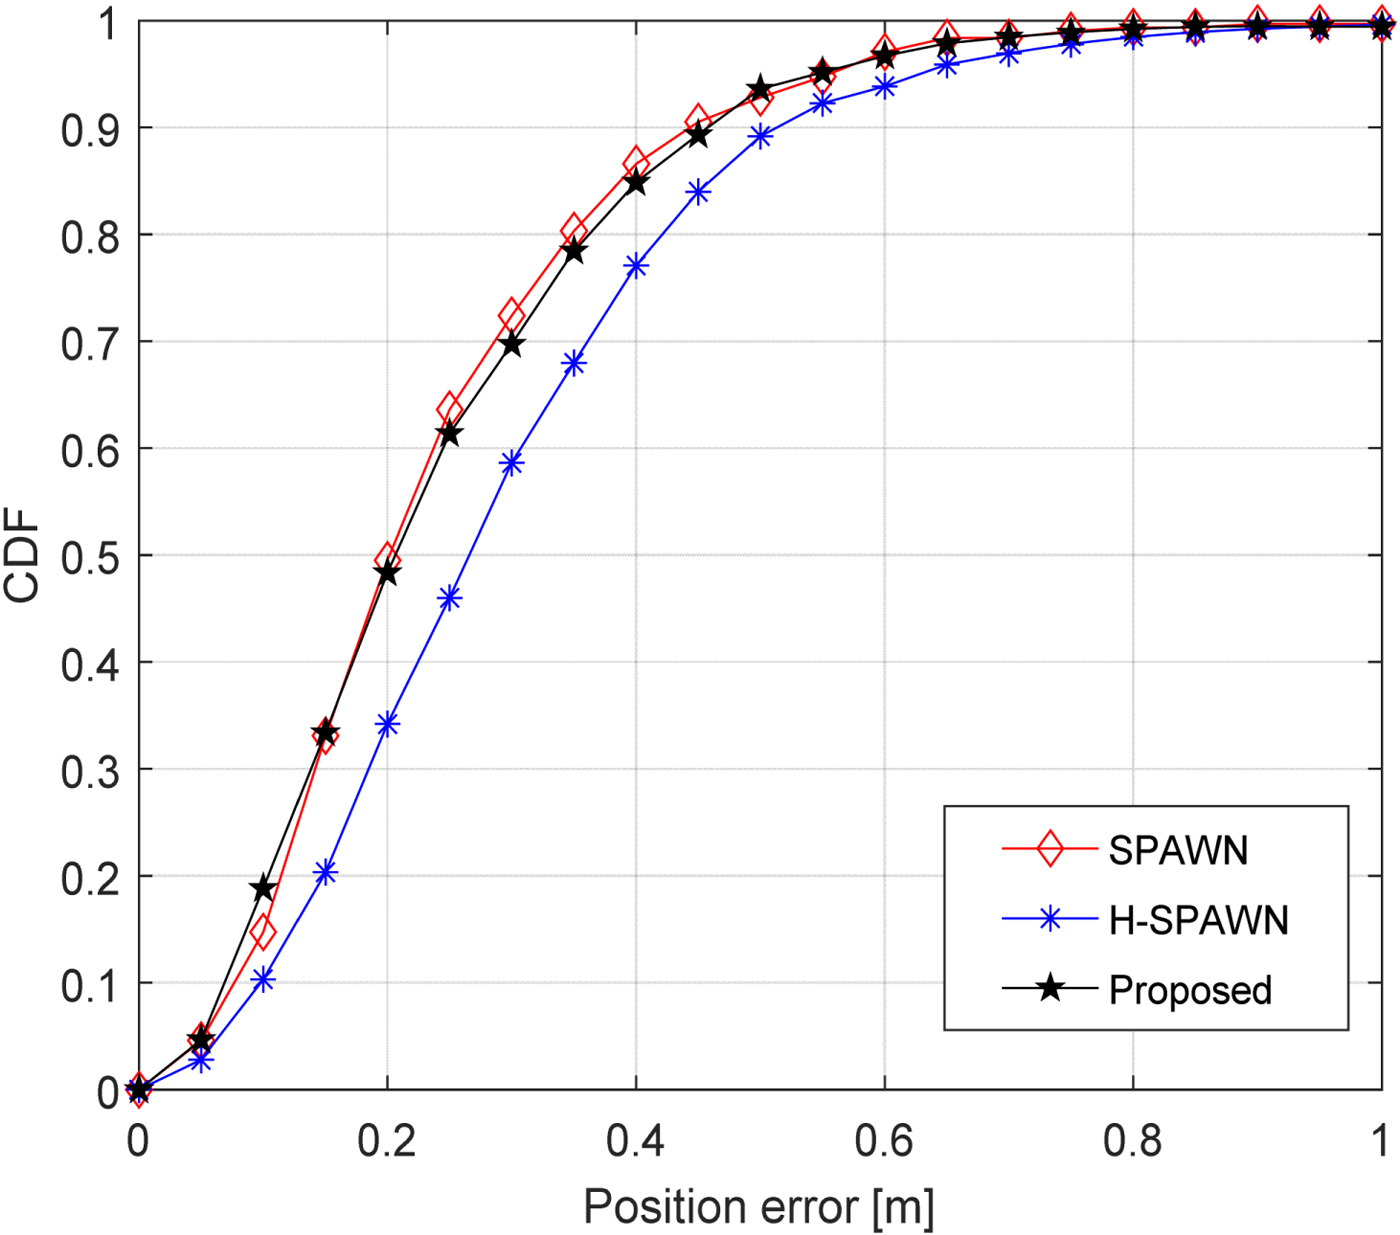
 $\Vert \hat{{\bf x}}_{i}^{\lpar t\rpar } - \hat{{\bf x}}_{i\comma proj}^{\lpar t\rpar }\Vert $. The CDF of the positioning error corresponding to the five agents is shown in Figure 10. In Figure 10, SPAWN and H-SPAWN are employed as baselines for comparison. As is shown, the performance of the proposed algorithm is very close to that of SPAWN, while it is obviously better than that of H-SPAWN. It can be seen that the ratio of positioning errors less than 0·4 m is 84·85% in the proposed algorithm, which is only 1·71% lower than that achieved by SPAWN but is 7·76% higher than that of H-SPAWN. Note that in this small-scale network, the communication overhead and the complexity of the proposed algorithm is slightly lower than that of H-SPAWN and significantly lower than that of SPAWN. Thus, the results show that our algorithm archives high accuracy with low system overhead in practical applications.
The Cumulative Distribution Function (CDF) of the positioning results of the five agent nodes.

5.3. Large-scale scenario
We considered a 100 × 100 m2 cooperative localisation area with N anchors and M agents. The maximum sense distance between nodes was R = 20 m and the ranging measurement noise was assumed to be an additive white Gaussian noise with zero mean and a standard deviation of σ. The iteration number was assigned as L = 10.
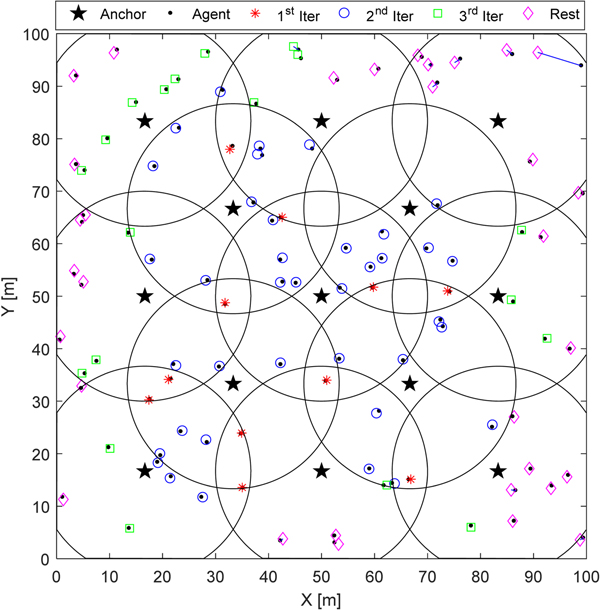
A single trial performance of the proposed algorithm is shown in Figures 11 and 12. The simulation configurations were N = 13, M = 100, σ = 0 · 5 m and  $\bar{\varepsilon} = \sigma$. The overall performance of the proposed algorithm is illustrated in Figure 11, where ‘⋆’ and ‘·’ denote the actual position of anchor nodes and agent nodes, respectively. The circles illustrate the sense area of the anchor nodes, and the line connects an agent's estimated position and its true position. To reflect the proposed bootstrap percolation scheme intuitively, four notations are used to represent the position results which are located in different iterations. Represented by the red ‘*’, the agents, which are connected to no less than three anchors, can be located in the first iteration with a high accuracy. The blue ‘○’ represent the agents which are located in the second iteration with the assistance of the red ‘*’. The green ‘□’ is the position estimation of the agents located in the third iteration. The remaining agents are located in the subsequent iterations gradually and are presented by purple ‘⋄’. As is shown in Figure 11, the agents which are located in the preceding iterations always act as reference nodes to assist the remaining agents in the subsequent iterations. In this way, all the agent nodes will be located layer-by-layer.
The overall performance of the single trial localisation.

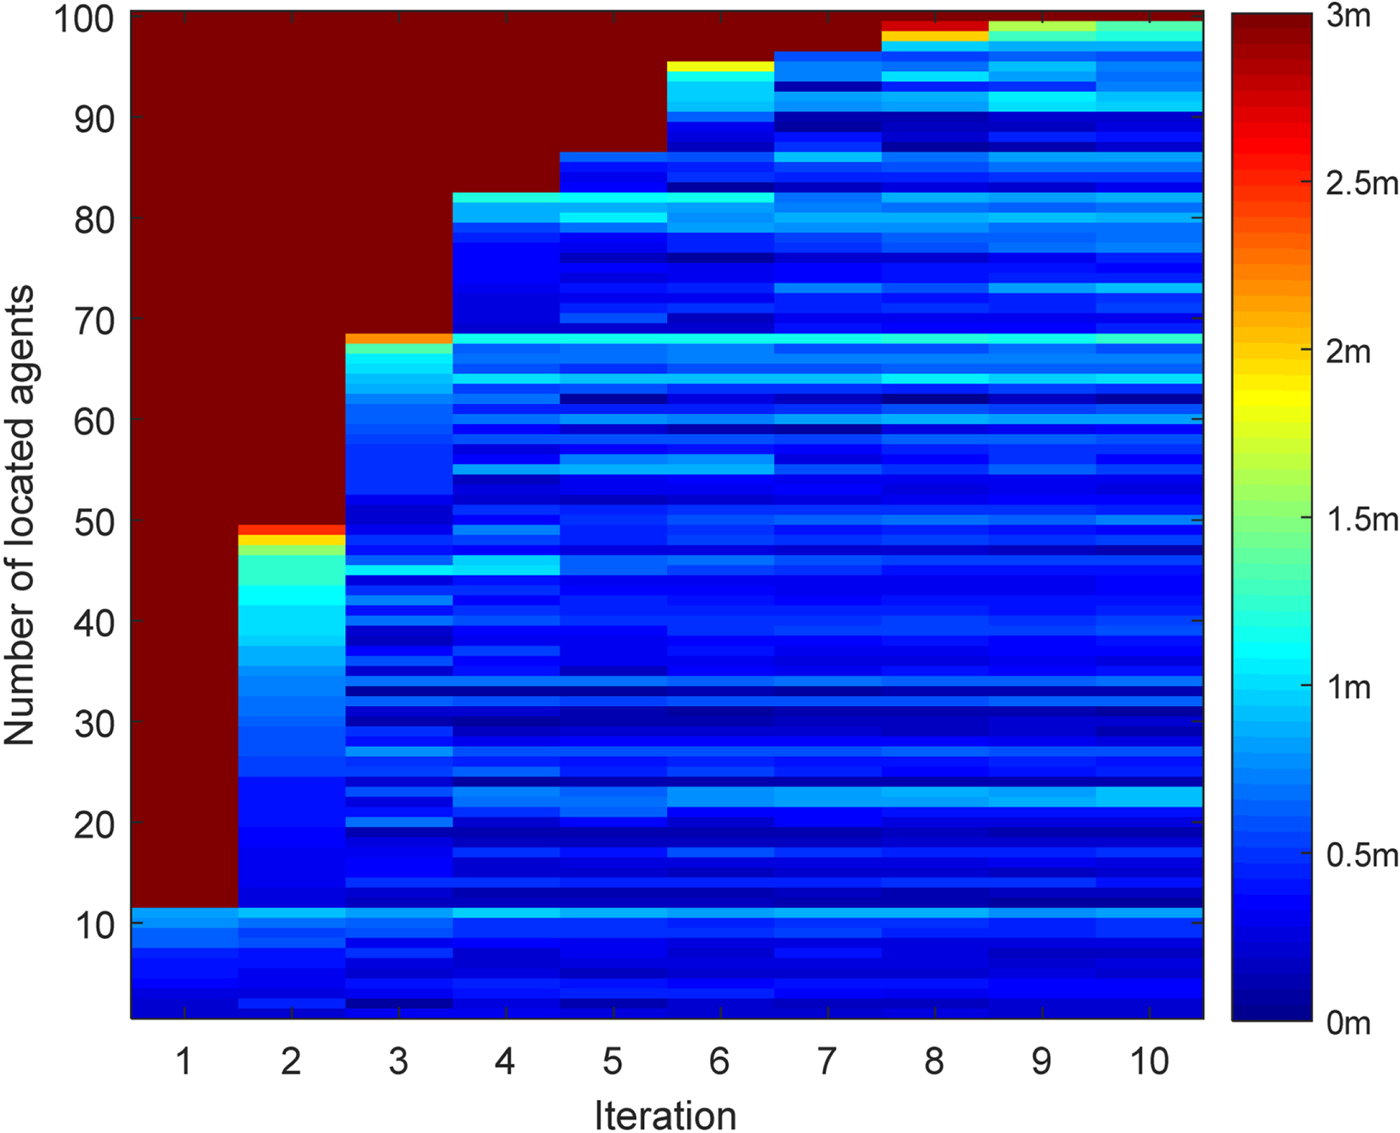
The contour plot of the positioning error of 100 agents versus the iteration index.

A different view is offered in Figure 12, showing the evolution of the positioning error of 100 agents versus the iteration index in the single trial localisation. According to our bootstrap percolation scheme, in each iteration, only the agents satisfying our conditions can be located. As can be seen from Figure 12, as the number of iterations increases, the number of agents that can be located increases in a layer-by-layer manner. In particular, it is observed that in the first iteration, only 11 agents (that is, red ‘*’ agents in Figure 11) can be located and their positioning errors are all less than 1 m. With the assistance of the red ‘*’ agents, another 38 agents (that is, blue ‘°’ agents in Figure 11) are located in the second iteration. Therefore, in the second iteration, a total of 49 nodes can be located, 46 of which have an accuracy of 1·5 m. This number increased to 67 in the third iteration. Finally, all agents but one, which only has two neighbours, can be located to within 1·4 m by the tenth iteration.
Considering the randomness of both the agents' deployments and ranging errors, the following results are obtained by averaging 100 Monte Carlo simulations.
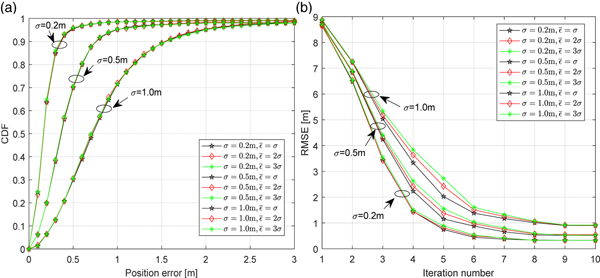
With varying ranging noises and detection thresholds, the CDFs and RMSE of the proposed algorithm are shown in Figure 13. Simulation configurations are N = 13, M = 100, σ = 0 · 2 m/0 · 5 m/1 · 0 m and  $\bar{\varepsilon} = \sigma/2\sigma/3\sigma$. As expected, it can be seen from Figure 13(a) that the influence of the different detection threshold
 $\bar{\varepsilon}$ on the overall positioning performance is almost negligible. The reason is that the ratio of missed alarms remains steady at a very low level with different
 $\bar{\varepsilon}$. Ranging noise determines the positioning accuracy of the proposed algorithm. As is shown, the fraction of positioning errors below 1 m is 98·4% when σ = 0 · 2 m, which is higher than that (95·2%) obtained when σ = 0 · 5 m, as compared to only 71·4% with σ = 1 m. From Figure 13(b), we can see that the influence of
 $\bar{\varepsilon}$ on the proposed algorithm is reflected in the iteration process of the positioning. In particular, in the third to fifth iterations, the value of the RMSE increases with the increase of
 $\bar{\varepsilon}$ when σ is constant. This is because the ratio of the false alarms increases with
 $\bar{\varepsilon}$, resulting in a decrease of the number of localised nodes. In the sixth iteration, it has
 ${\open B}_{3}^{6} = \emptyset$ in most simulations. According to our bootstrap percolation scheme, the set of agent nodes which are located in the sixth iteration becomes
 ${\open H}^{6} = {\open B}_{2}^{6}$, reducing the gap of RMSE rapidly. Thus, we can say that our bootstrap percolation scheme is a good supplement to the approximate collinear detection, which can effectively solve the localizability problem caused by the false alarms.
The positioning performance of the proposed algorithm. (a) The CDFs versus the positioning errors; (b) The Root Mean Square Error (RMSE) versus the iteration index.

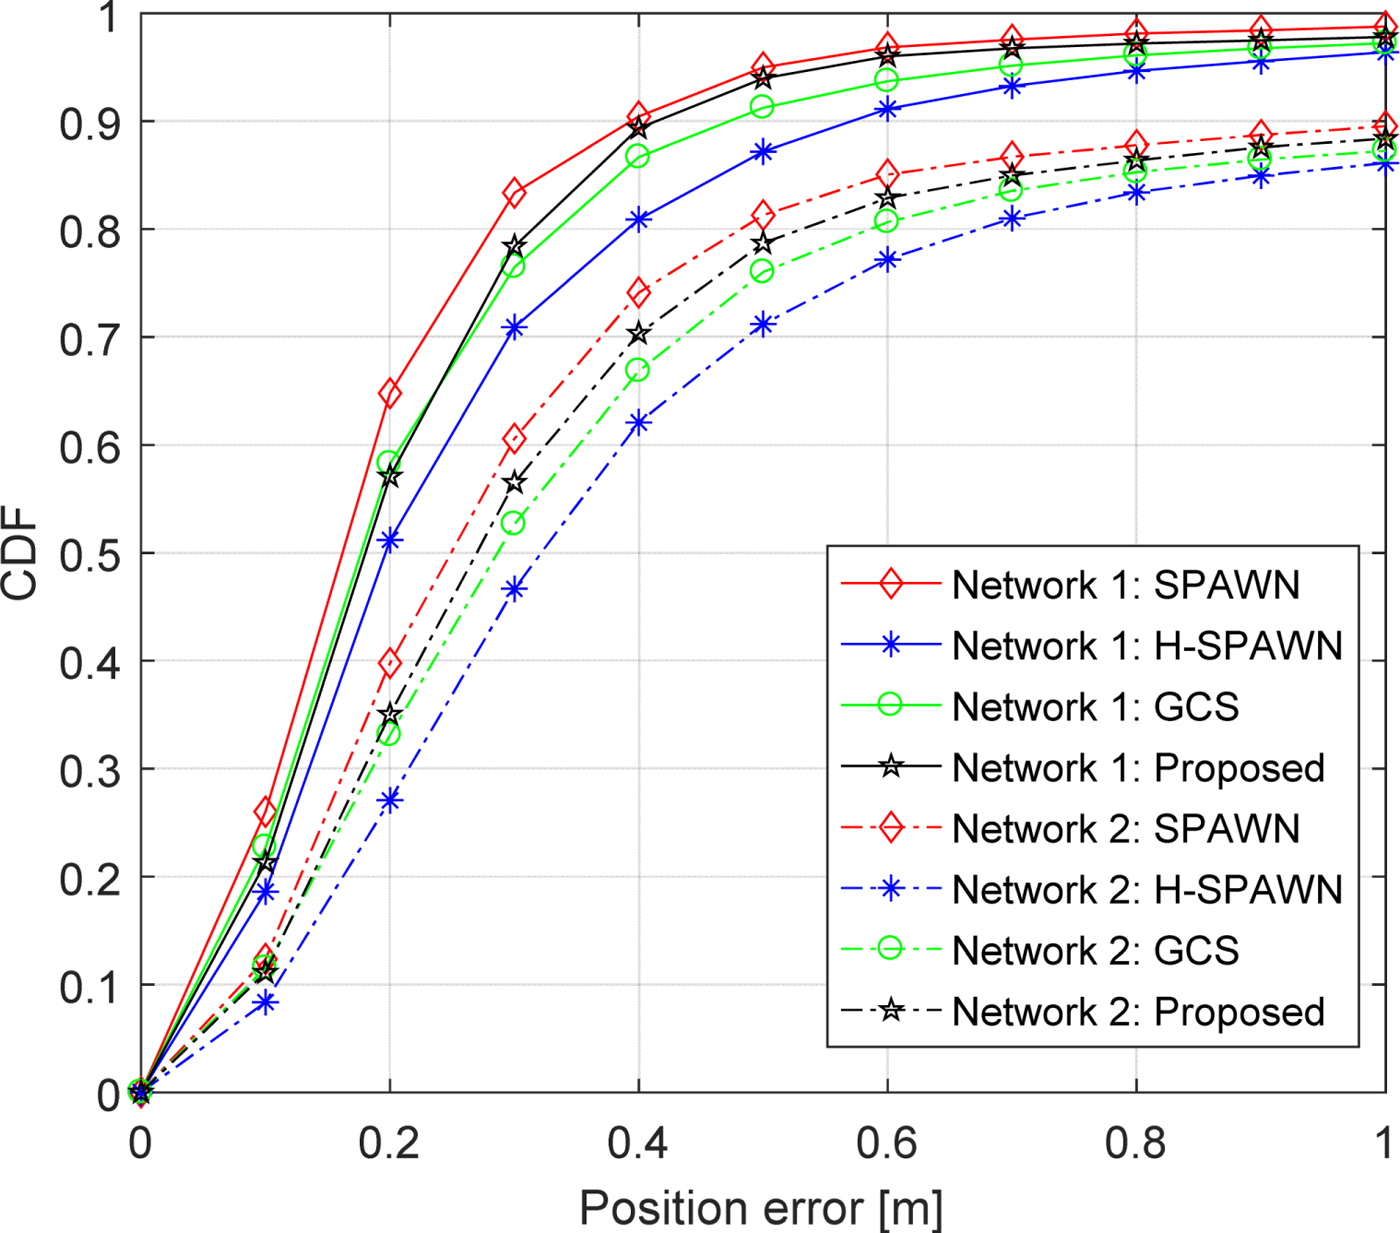
Figure 14 shows the CDF of different algorithms for two networks. Network 1 includes 13 anchors and 100 agents. Network 2 has 13 anchors and 50 agents. The ranging noise is set to σ = 0 · 25 m. In Network 1, on average, the target node is connected to 12·57 neighbour agents, while this number is reduced to 6·28 for Network 2. The performance of Network 1 is better than that of Network 2. It is observed that SPAWN achieves the highest accuracy, which is at the expense of a tremendous system overhead. Both the proposed algorithm and H-SPAWN adopt a Gaussian parametric message passing rule, but the performance of the proposed algorithm is superior to H-SPAWN. The reason is that the bootstrap percolation scheme proposed in this work not only makes full use of all beneficial information, but also efficiently mitigates the error propagation in the entire network. In Network 1, the average Central Processing Unit (CPU) running time required per iteration of the proposed algorithm, H-SPAWN, GCS and SPAWN is 1·62 s, 5·79 s, 93·57 s and 218·52 s, respectively. Therefore, the results show that compared with H-SPAWN, our algorithm achieves a higher accuracy at roughly a quarter of its execution time.
CDF comparison for Network 1 and Network 2.

6. CONCLUSION
In this work, a bootstrap percolation scheme is introduced into a Gaussian parametric message passing-based cooperative localisation algorithm to reduce the system overhead and mitigate the potential error propagation in dense WSNs. In particular, a layer-by-layer message propagation and updating mechanism is designed to locate agents gradually. In each iteration, only the subset with the highest confidence can be located and the others just update their distribution. To solve the potential flip ambiguity problem, we introduce a simple and efficient criterion to identify the approximate collinear geometric configuration of the reference node set. This criterion exploits Mahalanobis distance to evaluate the influence of neighbours' uncertainties on the flip ambiguity. Simulation results demonstrate that this criterion obtains an extremely low missed alarm ratio and our adaptive bootstrap percolation scheme can effectively solve the localizability problem caused by the false alarms ratio. The analysis and simulation results also show that the proposed algorithm reduces the system overhead while keeping the high accuracy of the networks. In our future work, a mixed message passing rule may be exploited to remove the ambiguity of the Gaussian mixture distribution, and the proposed algorithm may be extended to Non-Line Of Sight (NLOS) conditions for a wide range of applications.
ACKNOWLEDGEMENTS
This work is supported by the National Natural Science Foundation of China (Grant No. 61174194, 61301094). The authors would like to thank the editor and the anonymous reviewers for their valuable comments which greatly improved the presentation of this paper.