
I. INTRODUCTION
Nanostructured materials have been receiving much attention in recent years due to their exquisite microstructure, improved physicochemical properties, and a broad prospect of applications.Reference Arico, Bruce, Scrosati, Tarascon and van Schalkwijk1 However, most nanostructured materials, such as semiconductors or carbon materials (i.e., graphene) are liable to agglomeration, which affects the properties and hinders their applications.Reference Goriparti, Miele, De Angelis, Di Fabrizio, Proietti Zaccaria and Capiglia2 To overcome this drawback, the binary composites of semiconductors and carbon materials were developed to prevent each other from agglomeration as a result of the synergic effect between the components.Reference Xiang, Yu and Jaroniec3–Reference Liang, Li, Wang, Zhou, Wang, Regier and Dai5
Zinc oxide nanoparticles (ZnO NPs) are important semiconductor materials due to their unique properties including nontoxicity, low cost and good chemical stability, and variety of applications such as optics,Reference Chen, Zang, Gu, Zhu, Su, Zhang, Hu, Liu, Zhang and Liu6,Reference Son, Kwon, Park, Seo, Yi, Angadi, Lee and Choi7 photocatalysts,Reference Zhang, Wang, Huang, Zhang, Qin, Li, Dai and Li8–Reference Qi, Cheng, Yu and Ho10 and gas sensors,Reference Liu, Sun, Yu, Yin, Yang, Cao and Ashfold11,Reference Sin Tee, Chun Hui, Wu Yi, Chi Chin, Umar, Riski Titian, Hock Beng, Kok Sing, Yahaya and Salleh12 as well as a promising anode for lithium-ion batteries (LIBs) because of their high theoretical capacity (988 mA h/g).Reference Huang, Xia, Yuan and Zhou13,Reference Ahmad, Yingying, Nisar, Sun, Shen, Wei and Zhu14 However, the self-aggregation of ZnO NPs leads to destruction of the microstructure and deteriorate the performance of the material as a catalyst or electrode in real application.Reference Hong, Pan, Qian and Li15,Reference Ong, Ng and Mohammad16 On the other hand, graphene as a two-dimensional (2D) carbon allotrope with great potential applications both in physics and chemistry has also received wide attention.Reference Eigler and Hirsch17 Nevertheless, since lack of functional groups, the dispersion of graphene is so poor in solvents that its further modification and real utilization are very difficult. To solve this problem, graphene oxide (GO), which is based on the graphene structure with abundant hydroxyl and carboxyl functional groups on the surface, is invited to afford a platform for anchor and growth of semiconductor particles.Reference Dreyer, Park, Bielawski and Ruoff18 In view of the aforementioned advantages, the combination of ZnO NPs and GO into an optimized nanostructure is expected as a promising candidate for advanced functional materials.Reference Williams and Kamat19,Reference Akhavan20
In the past decade, several ZnO–graphene-based nanocomposites have been developed and applied in different fields. Luo et al.Reference Luo, Yu, Lei, Chen, Kuang and Su21 have synthesized reduced GO–ZnO composites which show excellent photocatalytic activity due to the suppression of charge carrier recombination caused by the interaction between the two components. A ZnO–rGO composite has been prepared by Wu and co-workers,Reference Chen, Hu, Chang, Wang, Zhang, Yang and Wu22 and the material shows 128% enhancement in specific capacitance compared with pure zinc oxide which caused by the incorporated rGO sheets. Several studies have shown ZnO–graphene composite as a remarkable electrode with high storage capability in LIBs.Reference Li, Xiao, Wang and Cao23–Reference Kim, Kim, Kim, Kim, Choi, Jung and Park25 Also, the hybrid structure of zinc oxide and graphene can be used as sensors for the detection of formaldehyde,Reference Huang, Zeng, Li and Xie26 [Fe(CN)6]3+ and dopamine.Reference Dong, Cao, Wang, Chan-Park, Wang, Huang and Chen27 The incorporation between ZnO NPs and graphene sheets can bring about many advantages in structure and functionality.
In view of the aforementioned advantages, the combination of ZnO NPs and GO into an optimized nanostructure is expected as a promising candidate for advanced functional materials.Reference Williams and Kamat19,Reference Akhavan20,Reference Chen, Hu, Chang, Wang, Zhang, Yang and Wu22,Reference Chen, Katsumata, Chiu, Okada, Matsushita and Hsu28–Reference Zhang, Li, Pan, Lu and Sun30 Moreover, the confinement effect of the GO sheets would be favorable for the NP dispersion, and the semiconductors play a role of chemical obstacle to prevent the graphene layers from agglomeration. However, how to prepare ZnO–graphene composites with innovative structure and functional properties by a facile method is still full of challenges. The uniform dispersion of the NPs, close combination of the components, and high content of ZnO are very important for this kind of composite with enhanced performance. It seems that the synthesis of ultra-small NPs is difficult and the particle aggregation is inevitable, especially during the traditional heating processes. In comparison, room-temperature synthesis procedure is more convenient to control nucleation and growth processes, and also more ecofriendly and low-cost.Reference Liu and Zeng31,Reference Cao, Qian, Gong, Du, Ma and Zhu32 The composite received by room-temperature synthesis usually exhibits small nanocrystal, high surface area, and well dispersion, which could promote the surface reactivity and enlarge the electrode/electrolyte interface area, thus benefit on the energy storage process.Reference Andriamiadamanana, Laberty-Robert, Sougrati, Casale, Davoisne, Patra and Sauvage33 However, ZnO NPs achieved by room-temperature synthesis always synthesized in aqueous solution with the presence of surfactant, and the particle size is large (∼20 nm).Reference Oliveira, Hochepied, Grillon and Berger34 Herein, we demonstrated the improved physicochemical property of the zinc oxide@graphene oxide (ZnO@GO) nanocomposite prepared by a facile method at room temperature. Against the general preconceived idea to obtain crystallized materials by heating, we found that the control of the synthetic condition in nonaqueous solution at room temperature can afford fine ZnO@GO nanocomposites with ultra-small ZnO nanocrystal (∼8 nm) and high weight content (∼84%). As an anode material for LIBs, the ZnO@GO nanocomposite exhibits a reversible capacity of 550 mA h/g after 100 cycles, ten times higher than the ZnO NP materials.
II. EXPERIMENTAL SECTION
A. Materials
Graphite powder and zinc acetate dehydrate (Zn(CH3COO)2·2H2O, 99%) were purchased from Aladdin Industrial Inc. (Shanghai, China). Sodium hydroxide (NaOH), dimethylsulfoxide (DMSO), and nonaqueous ethanol (EtOH) were purchased from Beijing Chemical Works (Beijing, China). All reagents were used as received without any other purification.
B. Synthesis of ZnO@GO and ZnO
Graphite oxide was prepared from natural graphite powder by a modified Hummers’ method.Reference Hummers and Offeman35 The GO@ZnO nanocomposite was synthesized through a one-step method at room temperature. In a typical synthesis, 10 mg graphite oxide was dissolved in 10 mL DMSO by ultrasonic treatment for 2 h to accomplish exfoliation and then centrifuged at 12,000 rpm for 10 min to obtain a brown GO solution. 550 mg Zn(CH3COO)2·2H2O was dissolved in 20 mL DMSO and dropped into GO solution with continuous stirring, and then sonicated for 30 min. Meanwhile, NaOH nonaqueous solution was prepared by dissolving 250 mg NaOH in 40 mL nonaqueous ethanol. The as-prepared NaOH solution was added dropwise to the Zn(CH3COO)2–GO solution with vigorous stirring. After 2 h of stirring, the product was centrifuged, washed with ethanol three times, and then dried under vacuum at 60 °C for 24 h. For comparison, ZnO NPs were synthesized by the same process without adding GO solution.
C. Materials characterization
The morphology of the samples was studied by using an S-4800 field emission scanning electron microscope (SEM; Hitachi, Japan) equipped with an energy-dispersive X-ray (EDX) system and a transmission electron microscope (TEM; FEI TECHNAI G2 F20, FEI, Hillsboro, Oregon) operated at 200 kV. X-ray diffraction (XRD) patterns were obtained by using an X′Pert PRO MPD X-ray diffractometer (Phillips, Netherlands) with a Cu Kα radiation source. Raman spectra were recorded using a LabRAM Aramis Raman spectrometer (Horiba Jobin Yvon, France) with a 632.8 nm He–Ne laser source. The chemical state, composition, and valence band spectra were analyzed by using ESCSLAB 250Xi X-ray photoelectron spectroscopy (XPS; ThermoFisher, Waltham, Massachusetts) equipped with an Al Ka radiation source. Nitrogen sorption isotherms were recorded on a Quadrasorb SI sorption analyzer (Quantachrome, Boynton Beach, Florida) at −196 °C (77 K). The specific surface area was calculated using the Brunauer–Emmett–Teller (BET) method and the pore size and pore volume was determined by the Barrett–Joyner–Halenda (BJH) method from the amount of N2 uptake at a relative pressure p/p 0 of 0.99. Thermogravimetric analysis (TGA) of the samples was measured under oxygen by using an SDT Q600 (TA Instruments, New Castle, Delaware) from room temperature to 800 °C at 10 °C/min.
D. Electrochemical measurements
To prepare the composite electrode, the active materials (80 wt%), poly(vinylidenedifuoride) (PVDF, 10 wt%), and acetylene black (AB, 10 wt%) were dispersed in N-methylpyrrolidone (NMP; electronic grade, Aladdin) using an ultrasonic bath to form a slurry, which was coated onto a Cu foil current collector by using a blade and then dried in vacuum for 12 h at 100 °C. The prepared composite/Cu sheet was cut into a circular shape (12 mm diameter) and subjected to a battery test. LIB performance tests were carried out with a half cell configuration using CR-2032 coin cells, which were fabricated in an argon-filled glovebox (UniLab, Mbraun, Garching, Germany; [O2] < 0.1 ppm, [H2O] < 0.1 ppm). Li foil was used as both the counter and reference electrodes, and microporous membrane (Celgard 2400) as the separator. 1 M LiPF6 in a mixed solution of ethylene carbonate, dimethylcarbonate, and ethyl methyl carbonate (1:1:1, v/v/v) was used as electrolyte. The galvanostatic charge and discharge tests of the cells were performed by using a CT2001A battery-testing instrument (LAND, Wuhan, China) in the voltage range of 0.01–3.0 V (versus Li/Li+) at room temperature. Cyclic voltammetry was carried out on a VMP3 (Bio-Logic, Seyssinet-Pariset, France) electrochemical analyzer at a scan rate of 0.2 mV/s. The electrochemical impedance spectroscopy (EIS) study was performed on the same electrochemical analyzer with the frequency range from 1 M to 10 mHz at an AC amplitude of 5 mV.
III. RESULTS AND DISCUSSION
A. Materials characterization
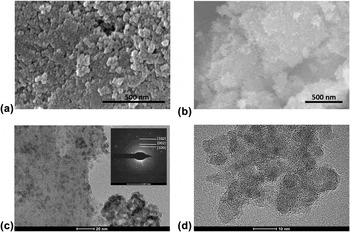
The ZnO@GO nanocomposite was fabricated by a facile and simple route in which ZnO NPs were loaded on GO layers by in situ growth at room temperature. GO nanosheets were achieved by dispersion and centrifugation of the graphite oxide, and Fig. S1 shows the SEM images of GO nanosheets with 2D layer structure and a few of the wrinkles.Reference Dreyer, Park, Bielawski and Ruoff18 Moreover, Fig. 1(a) shows the SEM morphology of ZnO NPs (∼20 nm) with serious particle agglomeration. On the other hand, the morphology [Fig. 1(b)] of the ZnO@GO nanocomposite exhibits a sheet-like structure with small ZnO NP stacks. During the synthetic process, Zn2+ ions dispersed and anchored on the surface of GO nanosheets by a large amount of oxygen-containing functional groups. After adding NaOH nonaqueous solution, the anchored Zn2+ ions transferred to ZnO NPs and formed the ZnO@GO nanocomposite. The EDX spectrum of ZnO@GO (Fig. S2) discloses the presence of Zn, O, and C elements, and the corresponding elemental mapping indicates their homogeneous distribution throughout the nanocomposite.
(a) SEM image of the ZnO NPs, (b) SEM image of the ZnO@GO nanocomposite sample, (c) TEM and (d) HRTEM image of the ZnO@GO nanocomposite sample. The scale bar in (a) and (b) is 500 nm. The inset in (c) is the SAED pattern of the ZnO@GO nanocomposite sample.

From the TEM image [Fig. 1(c)], it could be seen that the ZnO NPs dispersed on the surface of GO nanosheets. The inset in Fig. 1(c) shows the selected-area electron diffraction (SAED) patterns of the ZnO@GO sample, and the diffraction rings from the center to the edge correspond to the hexagonal wurtzite lattice planes (100), (002), and (102), respectively. The high-resolution TEM [HRTEM, Fig. 1(d)] image reveals that the ZnO NPs in the hybrids have an average size of ∼8 nm. As for the solution synthetic process, the size of ZnO NPs is affected by the reaction temperature and the particle size will increase dramatically at elevated temperature.Reference Kim, Kim, Kim, Kim, Choi, Jung and Park25 Comparing with room-temperature synthesis in the aqueous solution system, nonaqueous solution is effective to achieve the product with ultra-small ZnO NPs, which are beneficial for electron and ion transfer during the physicochemical process, and thus enhancing the performance in various application fields. Indeed, both GO nanosheets and pure ZnO NPs are prone to agglomeration in their separate forms, whereas the combination could prevent the self-agglomeration and keep the ZnO NPs distributed homogeneously on the GO layers.
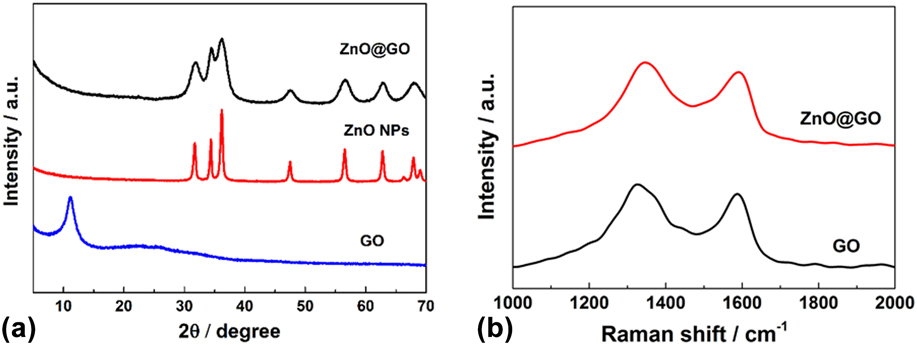
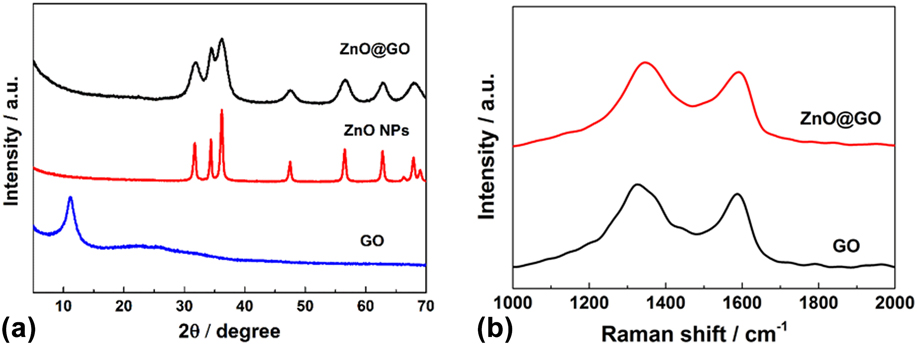
Figure 2(a) shows the XRD patterns of the GO nanosheets, ZnO NPs, and ZnO@GO nanocomposite, respectively. The diffraction peaks of the ZnO@GO nanocomposite and ZnO NPs are well indexed to the hexagonal wurtzite structure (JCPDS No. 36-1451).Reference Kim, Kim, Kim, Kim, Choi, Jung and Park25 The peak of GO at 12.0° indexes to the (001) reflection of GO with the interlayer spacing of 0.74 nm, larger than that of graphite (∼0.34 nm), which suggests that the oxygen-containing functional groups are successfully introduced on the graphite sheets.Reference Machado and Serp36 Moreover, the peaks of ZnO NPs are obviously sharper than those of ZnO@GO nanocomposites, indicating the larger crystal size and more agglomeration of ZnO NPs, which corresponds to the aforementioned SEM image. The average ZnO particle size in the ZnO@GO nanocomposite was estimated to be ∼9 nm by the Scherrer equation from the (101) plane diffraction peak of the XRD patterns and the bare ZnO NPs was ∼23 nm, which are consistent with the SEM and TEM results (Fig. 1). These results suggest that the ZnO@GO and ZnO NPs consist of well-crystallized ZnO, whereas the ZnO@GO is composed of smaller nanocrystals. To study the composition of the hybrids in detail, Raman spectroscopy was investigated. As shown in Fig. 2(b), ZnO@GO exhibits two characteristic bands: the G band at 1591 cm−1 and the D band at 1347 cm−1, while the GO shows the G band at 1587 cm−1 and D band at 1335 cm−1. It is known that the G band in GO is associated with the stretching motion of symmetric sp 2 bonds of carbon atoms, whereas the D band is generally ascribed to the disorders and local defects, especially at the edge of GO resulting from the oxygenated groups attached to the sp 3 carbon atoms.Reference Zhang, Tian, Wu, Tan, Sun, Wang and Fu4,Reference Ferrari, Meyer, Scardaci, Casiraghi, Lazzeri, Mauri, Piscanec, Jiang, Novoselov, Roth and Geim37 The intensity ratio of D and G peaks (I D/I G) of ZnO@GO is higher than the counterpart of GO (1.13 versus 1.10), indicating a more defect and less ordered structure, which can be assigned to the interactions between ZnO NPs and GO nanosheets and in favor of preventing ZnO self-aggregation.Reference Herring, Almahoudi, Olson and El-Shall38,Reference Atchudan, Edison, Perumal, Karthikeyan and Lee39 The Raman spectra demonstrate the interaction between the two components and further illustrate that ZnO@GO is nanostructural composite, rather than a mixture of ZnO NPs and GO. The porosity of the ZnO@GO and ZnO was estimated by N2 adsorption–desorption analysis and shown in Fig. S3. The BET surface area of ZnO@GO is 61.90 m2/g, which is much larger than that of ZnO NPs (22.50 m2/g). The increased BET surface area is attributed to the possession of GO in the preparation process, which is also beneficial for the electrochemical performance by enhancing the contact between the active material and the electrolyte.Reference Feng, Zhang, Song, Wei and Battaglia40
(a) XRD patterns of ZnO@GO, ZnO NPs, and GO, respectively. (b) Raman spectra of the ZnO@GO nanocomposite and GO.
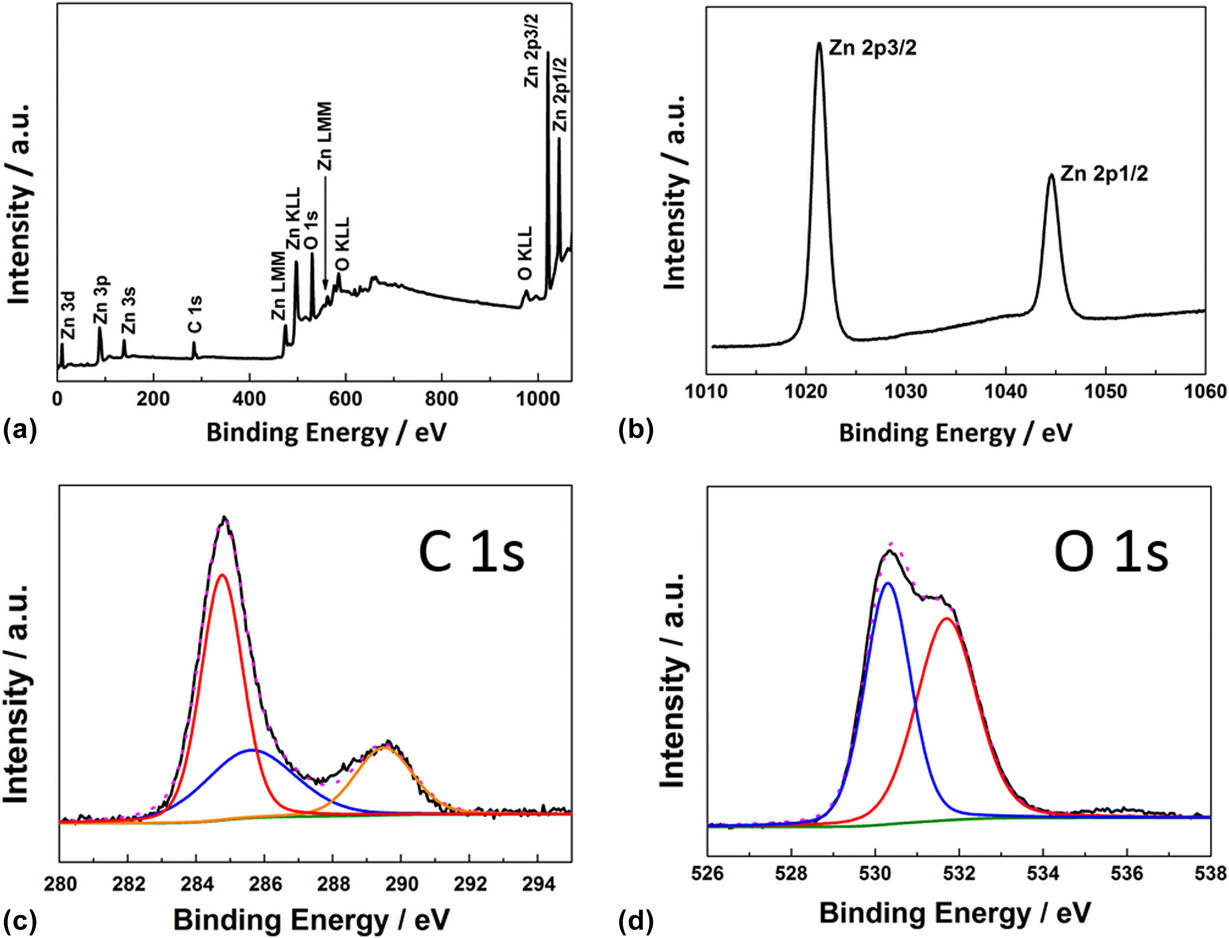
To further study the chemical states of the elements in the ZnO@GO nanocomposite, XPS was performed and shown in Fig. 3. The scan survey spectra identify the presence of Zn, O, and C elements. The higher-resolution XPS spectrum of Zn 2p [Fig. 3(b)] shows two peaks at 1021.4 and 1044.6 eV, corresponding to the electron orbits of Zn 2p 3/2 and Zn 2p 1/2, respectively.Reference Ahmad, Ahmed, Hong, Xu, Khalid, Elhissi and Ahmed41 The C 1s spectrum of ZnO@GO can be resolved into three components [Fig. 3(c)]. The peak at 284.8 eV originates from the C–C or C=C bond, and the peaks at 285.6 and 289.5 eV are attributed to C–O bond and O–C=O bond, corresponding to alkoxy and carboxyl, respectively.Reference Bu, Chen, Li and Hou42,Reference Guo, Yue, An, Ren and Yan43 The O 1s spectrum [Fig. 3(d)] can be fitted to two peaks at 530.3 and 531.7 eV, which can be assigned to the lattice oxygen in ZnO and the oxygen in C–OH/C–O–C of the ZnO@GO nanocomposite, respectively.Reference Bu, Chen, Li and Hou42,Reference Ren, Yang, Wu, Xu, Fu, Lv, Guo, Zhao and Zhu44 These results indicate the existence of the oxygen-containing functional groups, such as alkoxy, carboxyl, or hydroxyl on the surface of GO, which could anchor ZnO and form an integral composite. To determine the proportion of the GO and ZnO in the ZnO@GO nanocomposite, TGA was performed under oxygen atmosphere at a heating rate of 10 °C/min at the temperature range of room temperature to 800 °C (Fig. S4). The result indicates that the weight content of ZnO in the composite was ∼84%, which is higher than most of the previous reports.Reference Ren, Sun, Yu, Yang, Gu, Liu, Zhao, Kisailus and Wang24,Reference Kim, Kim, Kim, Kim, Choi, Jung and Park25,Reference Feng, Zhang, Song, Wei and Battaglia40
XPS spectra of the ZnO@GO nanocomposite for (a) survey, (b) Zn 2p, (c) C 1s, and (d) O 1s.

B. Electrochemical performance
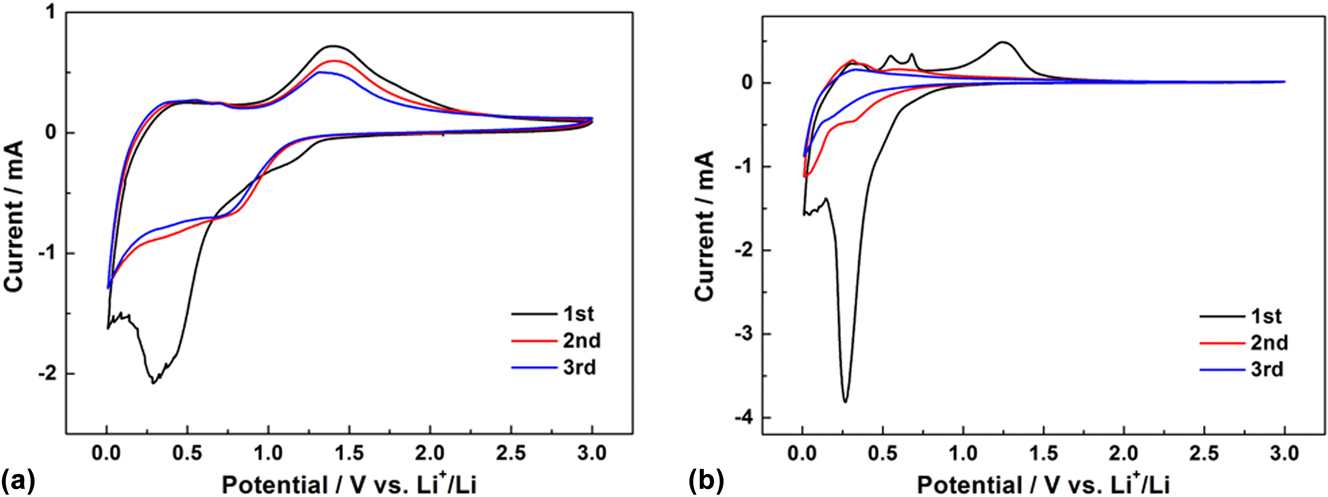
To study the electrochemical properties, cyclic voltammograms of the ZnO@GO nanocomposite and the ZnO NPs at a scan rate of 0.2 mV/s between 0.01 and 3.0 V for the first three scanned cycles are shown in Fig. 4. For the ZnO@GO anode, a reduction peak appeared at 1.25 V in the first cathodic cycle was attributed to the decomposition of electrolyte and the formation of solid electrolyte interphase (SEI) layers.Reference Ahmad, Yingying, Nisar, Sun, Shen, Wei and Zhu14,Reference Li, Jin, Liao and Wang45 And a strong peak observed in the range of 0.1–0.8 V, which is related to the reduction of ZnO to Zn and the alloying reaction between Zn and Li, as well as the formation of a gel-like SEI layer.Reference Feng, Zhang, Song, Wei and Battaglia40,Reference Chae, Park, Ryu and Oh46 From the second scan, the reduction peak splits into two peaks at 0.75 and 0.3 V, corresponding to the reduction process of ZnO to metallic zinc and formation of Zn–Li alloys, respectively. Moreover, the oxidation peaks appeared below 1.0 V was ascribed to the oxidation process of Li–Zn alloys, and the broad peak at 1.3 V corresponded to the formation of ZnO.Reference Li, Xiao, Wang and Cao23,Reference Kushima, Liu, Zhu, Wang, Huang and Li47 Major processes correspond to the ZnO anode based on the following reversible electrochemical reactions:
 $${\rm{ZnO}} + 2{\rm{L}}{{\rm{i}}^ + } + 2{{\rm{e}}^ - } \mathbin{\lower.3ex\hbox{$\buildrel\textstyle\rightarrow\over{\smash{\leftarrow}\vphantom{_{\vbox to.5ex{\vss}}}}$}} {\rm{Zn}} + {\rm{L}}{{\rm{i}}_2}{\rm{O}}\quad {\rm{,}}$$
 $${\rm{Zn}} + {\rm{L}}{{\rm{i}}^ + } + {{\rm{e}}^ - } \mathbin{\lower.3ex\hbox{$\buildrel\textstyle\rightarrow\over{\smash{\leftarrow}\vphantom{_{\vbox to.5ex{\vss}}}}$}} {\rm{LiZn}}\quad .$$
Cyclic voltammograms of the (a) ZnO@GO and (b) ZnO NPs at a scan rate of 0.2 mV/s between 0.01 and 3.0 V for the first three cycles.

The intensity of the reduction and oxidation peaks of the ZnO NP anode decreased and disappeared obviously in the subsequent cycles, which is due to the polarization, agglomeration, and other irreversible reactions during cycling.Reference Feng, Zhang, Song, Wei and Battaglia40 On the contrary, the GO layers in the ZnO@GO nanocomposite prevent the aggregation of the ZnO NPs, thus resulting in less polarization and improving the reversible properties of the lithium storage process of the ZnO-based anode.
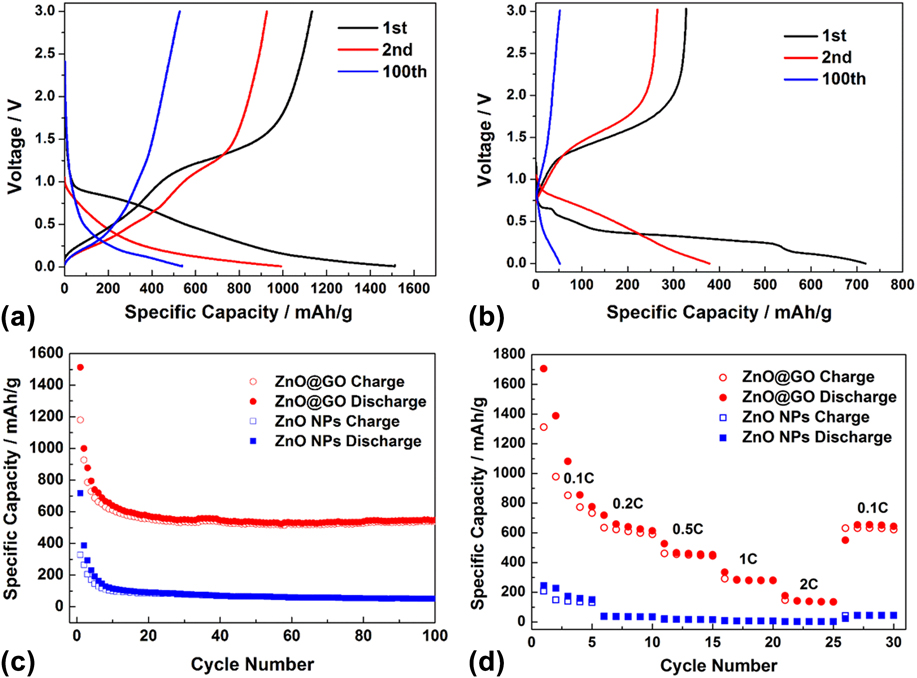
Figures 5(a) and 5(b) show the galvanostatic charge/discharge profiles of ZnO@GO and ZnO NPs in the 0.01–3.00 V range (versus Li+/Li) at a current density of 0.1 C, respectively. The first discharge capacity of ZnO@GO exceeded the theoretical value of ZnO (∼988 mA h/g), which was due to the decomposition of electrolyte at low potential, as shown in Fig. 4. From the second cycle, the discharge capacity decreased to 1000 mA h/g and reaches a capacity of 550 mA h/g after 100 cycles. Otherwise, the ZnO NPs exhibited a first discharge capacity of 718 mA h/g and rapidly decreased to less than 400 mA h/g from the second cycle. The initial coulombic efficiency of ZnO@GO is only 78%, which could result from the decomposition of electrolyte and the formation of SEI layer, and then the coulombic efficiency rapidly rebounded from the second cycle (93%) and eventually reached to 99%.Reference Kim, Kim, Kim, Kim, Choi, Jung and Park25 The rapid recovery in the coulombic efficiency electrode indicated that the ZnO@GO electrode achieved fast stabilization and electrode activation. Figure 5(c) summarizes the cycling performance of ZnO@GO and ZnO NPs. ZnO@GO revealed superior cycle stability and higher specific capacity, e.g., 10 times than ZnO NPs after 100 cycles. The enhanced lithium storage capability of the binary ZnO@GO nanocomposite may owe to the synergetic effect between GO and ZnO NPs, which prevented the self-aggregation and buffered the volume expansion of ZnO NPs by providing excess space during charge/discharge cycling.Reference Li, Xiao, Wang and Cao23,Reference Feng, Zhang, Song, Wei and Battaglia40 Specifically, the high cycling stability of the ZnO@GO electrode demonstrated that the unique nanostructure maintained well even at a high proportion of ZnO (∼84%) in the composite. The rate capability of ZnO@GO and ZnO electrodes was also studied by changing the current density stepwise from 0.1 to 2 C and then coming back to 0.1 C. As shown in Fig. 5(d), the ZnO@GO nanocomposite exhibits superior rate performance than the ZnO NPs. The specific capacities of ZnO@GO decrease from 658 to 461, 281, and 144 mA h/g as the current densities increase from 0.2 to 0.5, 1, and 2 C, respectively. It is worth noting that when the current density returns to 0.1 C, the charge capacity revert to 654 mA h/g.
1st, 2nd, and 100th charge/discharge curves of (a) ZnO@GO and (b) ZnO NPs with a constant current rate of 0.1 C between 0.01 and 3.0 V at room temperature. (c) Cycling performance over 100 cycles at a current rate of 0.1 C. (d) Rate performance of ZnO@GO and ZnO NPs at different current densities from 0.1 to 2 C.

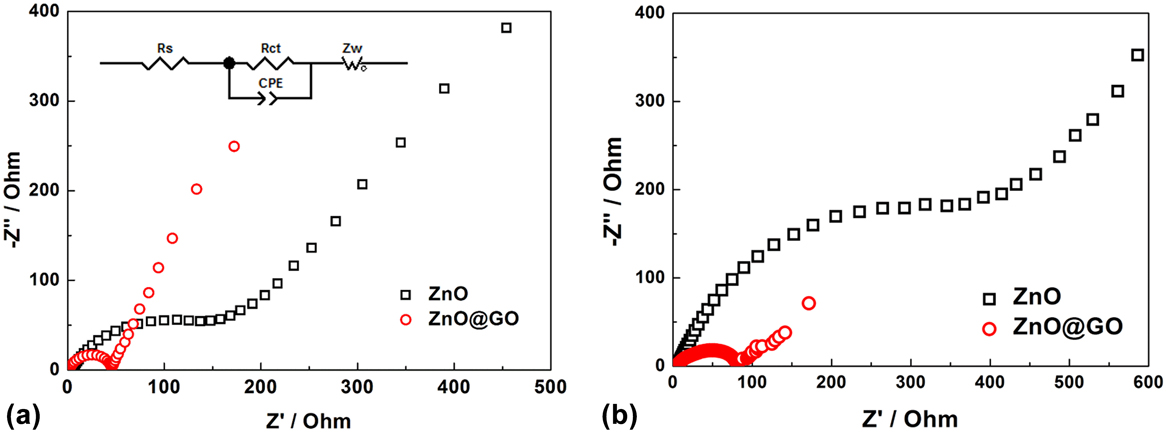
To gain further insight into electrochemical performances, the EIS were measured. As shown in Fig. 6(a), the equivalent circuit (inset) contained R s and R ct in the high frequency region corresponding to the ohmic resistance and charge transfer resistance, respectively, and Z w in the low frequency region represents the Warburg impedance of solid-state diffusion of lithium.Reference Ender, Illig and Ivers-Tiffée48,Reference Costard, Ender, Weiss and Ivers-Tiffée49 The ZnO@GO electrode possesses a small semicircle in the Nyquist plot, which indicates a small charge transfer resistance related to the electrochemical process on the electrode–electrolyte interface. The intimate contact between the ZnO NPs and GO layers is considered to improve the utilization of ZnO and contribute to the electron transport in the electrode during the charge–discharge process. For the ZnO NP electrode, the observed larger charge transfer resistance may due to the self-aggregation of ZnO and lack of efficient electron transport medium between the active materials.Reference Feng, Zhang, Song, Wei and Battaglia40 The Nyquist plots of both ZnO@GO and ZnO electrodes after 10th cycles [Fig. 6(b)] show increased charge transfer resistance, indicating the self-aggregation of the active material particles during charge/discharge cycling. However, comparing with the bare ZnO electrode, ZnO@GO reveals a slight increase of R ct, which may be due to good dispersity and electrical conductivity of the electrode.
EIS of the ZnO@GO and ZnO NPs (a) before cycling and (b) after 10 cycles.

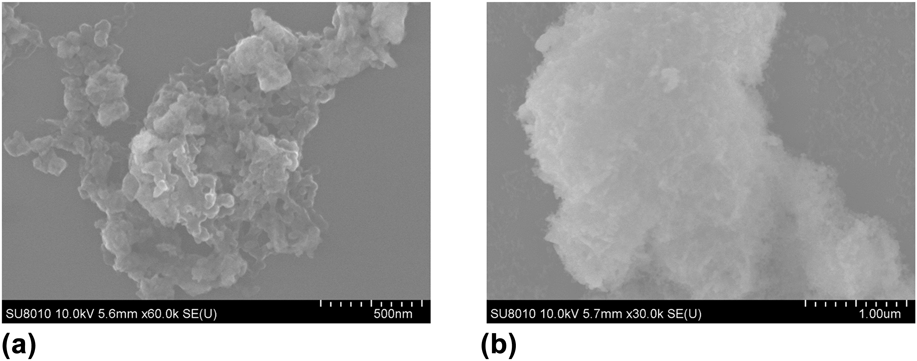
Figure 7 exhibits SEM images of ZnO@GO and ZnO electrodes after cycling, in which the ZnO@GO electrode shows dispersed NPs with diameter less than 100 nm, whereas severe agglomeration occurred on ZnO NP electrode and evidently differed from its original structure, which is in coincidence with the EIS results.
SEM images of the (a) ZnO@GO electrode and (b) ZnO NPs electrode after 10 cycles at a constant current rate of 0.1 C.

IV. CONCLUSIONS
In summary, the ZnO@GO nanocomposite has been fabricated successfully by a facile solution method at room temperature and systematically characterized by various physicochemical techniques. The obtained ZnO@GO nanocomposite presents well-dispersed ZnO NPs on the GO layer with mean diameter less than 10 nm, as well as a high weight percentage of ZnO (∼84%). As an anode material for LIBs, the ZnO@GO exhibits high specific reversible capacity and excellent cycling performance, which can be ascribed to the roles of GO in creating the decorated nanoscale composite for preventing the agglomeration of the ZnO NPs during the electrochemical process. The above results make the ZnO@GO nanocomposite as a promising candidate for energy storage devices. The simple preparation method with low energy consumption could be useful for enabling the large-scale preparation of ZnO@GO nanocomposites and further extended to the application of LIBs.
Supplementary Material
To view supplementary material for this article, please visit https://doi.org/10.1557/jmr.2018.110.
ACKNOWLEDGMENT
This work was supported by the independent innovation project of Qian Xuesen Laboratory of Space Technology.