Implications
Additive variability for economically important traits was low in this study. High genetic correlations of weaning weight (3WT) with post-3WT suggest that the genetic gain will be maintained if selection age is reduced to 3 months. Environment in the semi-arid region posed constraints for this genotype to exhibit its potential completely. These animals are being shifted to a sub-temperate region (Mannavanur), where already a flock of Bharat Merino sheep is maintained. Provision of optimum environment is expected to enhance production profile, and breeding these sheep with the sheep at Mannavanur would help to increase the genetic variability.
Introduction
Small ruminants play a major role for strengthening the backbone of rural economy of India. Sheep production is the main occupation of many rural people in India. Sheep are integral to the cultural, social and economic livelihood of the rural folk. The profitability of sheep production largely depends on the growth and wool production performance of the dual-purpose breed. Bharat Merino sheep is the synthetic fine wool sheep breed developed and maintained at the Central Sheep and Wool Research Institute (CSWRI), Avikanagar, Rajasthan, India. In 1982, third/fourth cross-breeds of Rambouillet and Russian Merino with Chokla, Jaisalmeri, Malpura and Nali breeds were assembled into a foundation sheep-breeding population. Since then, multiple-trait selection of ram lambs and inter-se breeding was practiced for the genetic improvement of the productivity (Dixit et al., Reference Dixit, Dhillon and Singh2001). Wool produced from this breed is of fine quality, and the growth potential of this breed is equal to the native sheep breeds specially raised for mutton production. Apart from the wool characteristics, crosses of this breed are becoming popular for the mutton production in many parts of the country. Many of the published genetic parameter estimates on the Indian sheep breeds were derived from the sire models that did not take into account the partitioning of the genetic variance in to the direct and maternal components. In this study, an attempt has been made to estimate the variance and covariance components due to additive and maternal effects in Bharat Merino sheep for various economic traits by determining the most appropriate animal model. In addition, genetic, phenotypic and environmental correlations between traits were estimated.
Material and methods
Data
Data available for the analysis were collected from the breeding flock of Bharat Merino sheep maintained at the CSWRI, Avikanagar at 75°28′ E Latitude and 26°17′ N Longitude at an altitude of 320 meters above mean sea level. Six different economic traits used for the analysis were birth weight (BWT), weaning weight (3WT), 6-month weight (6WT), 9-month weight (9WT), 12-month weight (12WT) and first greasy fleece weight (GFW). Number of sire and dam, least squares means, standard deviations, coefficient of variation for respective traits are summarized in Table 1. Data were collected over the years 1998 to 2007 with records on 2086 lambs in total descending from 130 sires and 645 dams. All the animals in this flock were kept under semi-intensive management system. The flock was closed with approximately 250 breeding females maintained in each year in which 10 to 15 sires were used per year for breeding. Active selection was practiced for males. Top ranking males on the basis of index involving 6WT and GFW were used for breeding. Males were also tested on the basis of progeny performance. One sire was typically used for 2 years. For ewes, selection was relaxed and culling was only on the basis of health and low production. Ewes lambed for the first time at 2 to 2.5 years of age due to controlled breeding practices. Lambing was restricted in the spring (February to April) and autumn (September to October) seasons, where 30% and 70% of lambing took place, respectively. The incidence of twinning was very small in the flock with average litter size at birth 1.04. Animals were treated in same way in both the seasons with respect to management and concentrate supplementation. However, scarce grazing resources from March to June exhibited seasonal differences in growth pattern. Concentrate mixture was offered ad libitum to suckling lambs from 15 days of age until weaning (90 days). After 3 weeks of age until weaning, lambs were sent for grazing for 3 h each in morning and evening, but not along with their dams. During the post-weaning period, in addition to 8- to 10-h grazing and dry fodder supplementation, 300 g of concentrate mixture was provided in the evening after grazing. The grazing area consisted of forest with natural fodder trees like Khejri (Prosopis cineraria), Ardu (Ailanthus spp.) and Neem (Azadirecta indica). Bushes and surface vegetation including the improved pastures of Cenchrus ciliaris was also available. Because of scarce grazing resources from March to June, the sheep were supplemented with hay of C. ciliaris, Cowpea and Dolichos; pala leaves (Zizyphus) and fodder tree lopping.
Characteristics of data structure for economic traits of Bharat Merino sheep

BWT = birth weight; 3WT = weaning weight; 6WT = 6-month weight; 9WT = 9-month weight; 12WT = 12-month weight; GFW = greasy fleece weight; LSM = least squares means.
Lambs were weighed on exactly the target ages. BWT was taken within 24 h of birth of lamb, and 3WT, 6WT, 9WT and 12WT were taken on exact dates. Shearing took place between 6 and 9 months of age in two seasons in a year: (i) September: for lambs born during January to March and (ii) March: for lambs born during August to September.
Statistical methods
(Co)variance components were estimated by restricted maximum likelihood (REML) using a derivative-free algorithm fitting an animal model (Meyer, Reference Meyer2000). Data were first analyzed by least squares analysis of variance (SPSS, 2005) to identify the fixed effects to be included in the model. For growth traits, statistical model for least squares analyses included effect of year of birth (10 levels), season of birth (2 levels) and sex of the lamb (2 levels) as fixed effects, and age of the dam at lambing was taken as the covariate. All the effects were significant (P ⩽ 0.05) up to 6 months of age. At 9WT and 12WT, all the effects, except season of birth, were significant. Only significant effects (P ⩽ 0.05) were included in the models that were subsequently used for the genetic analysis. For GFW, least squares analysis was performed considering fixed effects of year of production (10 levels), season of production (2 levels) and sex of animal (2 levels), and age at shearing was the covariate, to identify the effects to be included in the model. All these effects, except the sex of the animal, were significant (P ⩽ 0.05) for the GFW and hence included in the model. Convergence of the REML solutions was assumed when the variance of function values (−2log L) in the simplex was <10−8. To ensure that a global maximum is reached, analyses were restarted. When estimates did not change, convergence was confirmed. Six different single-trait linear models that accounts for the direct and maternal effects were initially fitted for each trait.


Where y is the vector of records; β, a, m, pe and ε are vectors of fixed, direct additive animal genetic, maternal additive genetic, permanent environmental effects of the dam and residual effects, respectively, with association matrices X, Za, Zm and Zpe; A is the numerator relationship matrix between animals; and σ am is the covariance between additive direct and maternal genetic effects. Assumptions for variance (V) and covariance (Cov) matrices involving random effects were

where, I is an identity matrix and σ2a , σ2m , σ2c and σ2e are additive direct, additive maternal, maternal permanent environmental and residual variances, respectively. The direct maternal correlation (ram) was computed as the ratio of the estimates of direct maternal covariance (σam) to the product of the square roots of estimates of σ2a and σ2m. Maternal across year repeatability for ewe performance (tm = (1/4) h 2 + m 2 + c 2 + mramh) was calculated. The total heritability ( ), was calculated using the formula
 , (Willham, Reference Willham1972).
Likelihood ratio test (LRT) was used to select the most appropriate univariate model for each trait (Meyer, Reference Meyer1992). An effect was considered to have significant influence when its inclusion caused a significant increase in log-likelihood, compared with the model in which it was ignored. Significance was tested at P < 0.05 by comparing differences in log-likelihoods to values for a χ 2 distribution with degrees of freedom equal to the difference in the number of (co)variance components fitted for the two models. Genetic, phenotypic and environmental correlations among all the traits mentioned above were estimated by bivariate analysis with starting values derived from single-trait analysis.
Results and discussion
Least squares means along with the standard deviation (s.d.) and percent coefficient of variation for different traits under study are given in Table 1. The sex ratio (♂ : ♀) in the lambs was 1 : 0.96. The least squares mean for various traits were BWT = 3.06 kg; 3WT = 14.25 kg; 6WT = 21.26 kg; 9WT = 24.50 kg; 12WT = 27.99 kg; and GFW = 751.19 g.
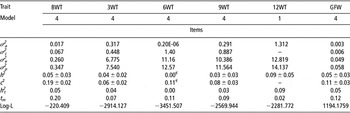
(Co)variance components and genetic parameters estimated by most appropriate model in univariate analysis for various traits of Bharat Merino sheep are presented in Table 2. As per LRT, the best model for BWT, 3WT, 6WT, 9WT and GFW was Model 4, which included direct additive and permanent environmental effects of the dam. For 12WT, Model 1 – a simple animal model – was the best that included only direct additive effect.
Estimates of parameters for different economic traits from univariate analysis in Bharat Merino sheepFootnote 1

BWT = birth weight; 3WT = weaning weight; 6WT = 6-month weight; 9WT = 9-month weight; 12WT = 12-month weight; GFW = greasy fleece weight.
1 σ2a, σ2c , σ2e and σ2p are additive direct, maternal permanent environmental, residual variance and phenotypic variance, respectively; h 2 is heritability; c 2 is σ2c /σ2p; tm is maternal across year repeatability for ewe performance; h2t is total heritability and log-L is log-likelihood for the best model obtained from DFREML (agbu.une.edu.au/.../downstuff.php?file=DFREMLmanual...DFREML) (Meyer, Reference Meyer2000).
€ Indicates that the approximation used to define standard errors of parameter estimates failed.
Pre-weaning weights
Additive genetic variance for the BWT was low. In the Model 4, h 2 for BWT was 0.05 ± 0.03. The low heritability estimate for BWT in Bharat Merino sheep may be attributed to the general poor nutritional level of ewes giving a leeway for large environmental variation. Our h 2 estimate for BWT was within the range of earlier reported estimates by Conington et al. (Reference Conington, Bishop, Waterhouse and Simm1995), Nasholm and Danell (Reference Nasholm and Danell1996), Mousa et al. (Reference Mousa, Van Vleck and Leymaster1999), Janssens et al. (Reference Janssens, Geysen and Vandepitte2000) and Mandal et al. (Reference Mandal, Neser, Rout, Roy and Notter2006b). Higher estimate of heritability for BWT (0.23) in Bharat Merino sheep was reported by Dixit et al. (Reference Dixit, Dhillon and Singh2001), by paternal half-sib method for the data over the years 1982 to 1996. Bharat Merino sheep is a synthetic sheep, maintained only at the research station in semi-arid environment. This restricts the scope for increasing genetic variability in the flock. The additive variability in the breed might have declined over the years due to continuous selection for favorable traits. Our estimates were lesser than the parameters summarized by Safari et al. (Reference Safari, Fogarty and Gilmour2005). The permanent environmental maternal effect for BWT was moderate in this study (c 2 = 0.19 ± 0.02). This indicates the importance of maternal environment and care at birth of the lamb. The estimate for c 2 was similar to the average values reviewed by Safari et al. (Reference Safari, Fogarty and Gilmour2005) for various sheep breeds and estimate by Mandal et al. (Reference Mandal, Neser, Rout, Roy and Notter2006b) for Muzaffarnagri sheep. The estimate of repeatability of ewe performance (tm) for BWT was moderate in magnitude (0.20), but the total heritability (h2 t) was very low (0.05). Both the estimates were lower than the estimates reviewed by Safari et al. (Reference Safari, Fogarty and Gilmour2005); however, the results for tm were in congruence with the reports by Mandal et al. (Reference Mandal, Neser, Rout, Roy and Notter2006b) for Muzaffarnagri sheep.
The Model 4 that includes direct additive and maternal permanent environment effects was sufficient to explain the variation in BWT. In the Model 1, h 2 estimate for BWT was 0.20 ± 0.05. Addition of maternal genetic effect (m 2) reduced h 2 estimate to 0.03 ± 0.02 in Model 2, and m 2 estimate was 0.18 ± 0.03. Addition of covariance between direct and maternal effects has shown positive estimate of ram. In a more comprehensive model, i.e., Model 5, we found h 2 = 0.05 ± 0.03, m 2 = 0.02 ± 0.00 and c 2 = 0.18 ± 0.00. All these models (1, 2, 3 and 5), however, did not increase the likelihood. Addition of c 2 to direct genetic effect (Model 4) increased the likelihood over all other models significantly (P < 0.05) as per LRT. Actual partitioning of the maternal variance in additive and permanent environment effect was practically difficult as revealed by Mandal et al. (Reference Mandal, Neser, Rout, Roy and Notter2006a). Notter and Hough (Reference Notter and Hough1997) suggested that partitioning maternal effects in additive and permanent environmental component requires large amount of data with repeated records on individual ewes and presence of related ewes in the data. Even after meeting these requirements, results were inconsistent as per Al-Shorepy and Notter (Reference Al-Shorepy and Notter1998). Similar picture is seen in the current data set too. The evidence for the maternal genetic effect for BWT was not observed as such in the present analysis.
Direct heritability estimates for 3WT were also found to be low (0.04 ± 0.02), indicating poor genetic variability in the population for 3WT and the meager scope of further improvement in the trait. Similar results were obtained by Notter (Reference Notter1998) for Polypay sheep (0.07), Ekiz et al. (Reference Ekiz, Ozcan, Yilmaz and Ceyhan2004) for Turkish Merino sheep (0.06) and in the review by Safari et al. (Reference Safari, Fogarty and Gilmour2005) in various sheep breeds. Higher values were given by Neser et al. (Reference Neser, Erasmus and Van Wyk2001); Hanford et al. (Reference Hanford, Van Vleck and Snowder2002) and Mandal et al. (Reference Mandal, Neser, Rout, Roy and Notter2006b). Higher estimate of h 2 (0.14) for 3WT in Bharat Merino sheep was reported by Dixit et al. (Reference Dixit, Dhillon and Singh2001). The c 2 estimate of 0.06 ± 0.02 in this study also indicates the decline of maternal effect from birth to weaning in Bharat Merino sheep. Estimates for c 2 within the range were reported by Hanford et al. (Reference Hanford, Van Vleck and Snowder2003) for Targhee sheep (0.06). Similar estimates were reviewed by Safari et al. (Reference Safari, Fogarty and Gilmour2005) for various wool and dual-purpose breeds (0.06 and 0.07, respectively). Ekiz et al. (Reference Ekiz, Ozcan, Yilmaz and Ceyhan2004) and Ozcan et al. (Reference Ozcan, Ekiz, Yilmaz and Ceyhan2005) both reported c 2 = 0.08 in Turkish Merino sheep. The estimates of tm and h2t were also very low in this study 0.07 and 0.04, respectively; indicating negligible scope for response to phenotypic selection for the trait. Similar h2t values were cited in the literature by Notter (Reference Notter1998) for Polypay sheep (0.07), El-Fadili et al. (Reference El-Fadili, Michaux, Detilleux and Leroy2000) for Timahdit sheep (0.04), Ekiz et al. (Reference Ekiz, Ozcan, Yilmaz and Ceyhan2004) and Ozcan et al. (Reference Ozcan, Ekiz, Yilmaz and Ceyhan2005) for Turkish Merino sheep (0.06 and 0.05). Estimate of additive maternal correlation in this study was −0.10 for 3WT. Direct h 2 from Model 1 was 0.09 ± 0.04. In Model 2, estimate of h 2 and m 2 were 0.02 ± 0.03 and 0.07 ± 0.02, respectively. Partitioning of maternal effect was very difficult as already discussed for BWT. Model 5 – the more comprehensive model – gave estimates of h 2, m 2 and c 2 as 0.02, 0.07 and 0.00, respectively. Addition of c 2 to direct genetic effect (Model 4) increased the likelihood significantly (P < 0.01) over all other models as per LRT.
Post-weaning weights
Estimates of (co)variance components were calculated for 6WT, 9WT and 12WT (Table 2). The direct heritability estimate from the best model for post-3WT were 0.00 at 6WT, 0.03 ± 0.03 at 9WT and 0.09 ± 0.05 at 12WT for Bharat Merino sheep. Higher estimates than that of this study were reported by Dixit et al. (Reference Dixit, Dhillon and Singh2001) in Bharat Merino sheep, Abegaz et al. (Reference Abegaz, Negussie, Duguma and Rege2002) in Horro sheep (0.16 and 0.31, respectively), Ozcan et al. (Reference Ozcan, Ekiz, Yilmaz and Ceyhan2005) in Turkish Merino sheep (0.25) and Mandal et al. (Reference Mandal, Neser, Rout, Roy and Notter2006b) in Muzaffarnagri sheep (0.06 for 6WT, 0.10 for 9WT and 0.14 for 12WT). Maternal permanent environmental effect was an important source of variation at 6WT and 9WT, and it was not evident at 12WT. Maternal effects cannot be compared with the other studies due to differences in the models fitted, as suggested by Meyer (Reference Meyer1992). No evidence for the additive maternal effect was observed on post-3WT at any age. This is indicative of the fact that post-3WT has almost no carryover maternal effect and indicates the importance of impact of animal’s own genotype for body weight (BW) at post-weaning stage. Similar reports where maternal effects were found to be declining with the advancement of age were given by Maria et al. (Reference Maria, Boldman and Van Vleck1993), Mortimer and Atkins (Reference Mortimer and Atkins1994), Tosh and Kemp (Reference Tosh and Kemp1994), Mandal et al. (Reference Mandal, Neser, Rout, Roy and Notter2006b) and Mandal et al. (Reference Mandal, Neser, Rout, Roy and Notter2009). As discussed earlier, partitioning of the total maternal effect into its direct and permanent environmental components was difficult for post-3WTs. At 6WT, Model 2 yielded estimate of h 2 and m 2 as 0.00 and 0.09, respectively. Estimates of h 2, m 2 and c 2 from inclusive Model 5 are 0.00, 0.01 and 0.10, respectively. At 9WT, Model 2 yielded estimate of h 2 and m 2 as 0.02 ± 0.03 and 0.08 ± 0.02, respectively. Similar results were also found in Model 5 (h 2 = 0.02 ± 0.01, m 2 = 0.07 ± 0.00 and c 2 = 0.01 ± 0.03). For 12WT, results from the Model 2 for h 2 and m 2 were 0.07 ± 0.05 and 0.04 ± 0.03, respectively, whereas the comprehensive Model 5 yielded h 2 = 0.07, m 2 = 0.04 and c 2 = 0.00. However, as per LRT, Model 4 was superior to all other models significantly (P < 0.05) for 6WT and 9WT, whereas for 12WT, Model 1 was superior. Estimates of ram were very high and negative (−1.00) for 6WT, moderately negative (−0.26) at 9WT and positive for 12WT (0.33).
In this study, estimate of Va was very small as compared to very large estimate of Ve. This led to the very low estimates of direct heritability for traits. It has been found in spite of including all the known possible fixed effects in the model. This indicates the exclusion of some very important factors that are not accountable or could not be measured. The sheep population that has 75% exotic inheritance is maintained in the harsh environmental conditions in the semi-arid region (temperature varies from 1°C to 46°C in a year). This environment posed a lot of constraints for this breed to exhibit its potential completely. In this year, authorities have agreed to shift the flock to a sub-temperate region (Southern Regional Research Center, Mannavanur, Tamilnadu, India), where already a flock of 100 Bharat Merino sheep is maintained. Temperature at that region ranges from 15°C to 25°C throughout the year. We hope that providing optimum environment will result in better production by these animals in future as a result of positive G × E interaction. Breeding these animals with the sheep already maintained at southern region will result in some variability in the flock. Work in this direction is already in pipeline. We hope that this will help to ameliorate the situation to some extent.
Total heritability estimates were also very low for post-3WTs, leaving meager scope for further improvement in the trait. Similarly, estimates for tm were 0.11 for 6WT, 0.09 for 9WT and 0.02 for 12WT in the Bharat Merino sheep, indicating very low repeatability for the ewe performance and leaving too little scope for improvement. Estimates were similar with the reports of Ozcan et al. (Reference Ozcan, Ekiz, Yilmaz and Ceyhan2005) for Turkish Merino (0.01 for 12WT) and Mandal et al. (Reference Mandal, Neser, Rout, Roy and Notter2006b) for Muzaffarnagri sheep (0.04 for 12WT). Most of the estimates for tm in the literature were higher than that of this study (Abegaz et al., Reference Abegaz, Negussie, Duguma and Rege2002 and Safari et al., Reference Safari, Fogarty and Gilmour2005).
GFW
Additive genetic variance for GFW was low (h 2 = 0.05), using the best model (Model 4), which includes animal as the direct genetic effect and dam as the permanent environment effect. In our data for GFW, Maternal permanent environmental effect accounted for 11% of the total phenotypic variation in GFW. Estimates from the comprehensive model, Model 5, which attempted independent estimation of m 2 and c 2 for GFW (h 2 = 0.05, m 2 = 0.00 and c 2 = 0.10) suggested that all the maternal effects were environmental in origin, and there was no evidence for direct maternal effect as variance converged to zero. Estimates for h2t and tm were 0.05 and 0.12, respectively. Repeatability of ewe performance suggests some scope for trait improvement in Bharat Merino sheep.
Heritability estimates for the GFW were low in this study (0.05), which were similar to some estimates in the literature, viz. Yazdi et al. (Reference Yazdi, Engstrom, Nasholm, Johansson, Jorjani and Liljedahl1997) in Baluchi sheep and Ozcan et al. (Reference Ozcan, Ekiz, Yilmaz and Ceyhan2005) in Turkish Merino sheep (0.08 for GFW in the first shearing, that is, at the average age of 18 months). However, higher estimates were reported by Snyman et al. (Reference Snyman, Olivier and Olivier1996) in Merino sheep (0.20) and Mandal et al. (Reference Mandal, Neser, Rout, Roy and Notter2009) in Muzaffarnagri sheep (0.14).
Correlation estimates
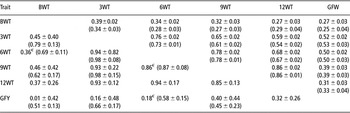
The most appropriate models from the single-trait analyses (Model 4 for BWT, 3WT, 6WT, 9WT and GFW; Model 1 for 12WT) were used in the bivariate analysis for estimation of genetic, phenotypic, permanent environmental and residual correlations between different economic traits of Bharat Merino sheep (Table 3). Estimates for direct genetic correlation between BWs at different ages were ranged from 0.36 for BWT and 6WT to 0.94 for 3WT and 6WT and 6WT and 12WT. The estimate of genetic correlation of BWT with BW up to 9 months was moderate. Genetic correlation estimate of 0.45 for BWT and 3WT was lower than the estimate of 0.56 reported by Hanford et al. (Reference Hanford, Van Vleck and Snowder2002) in Columbia sheep and 0.52 by Hanford et al. (Reference Hanford, Van Vleck and Snowder2003) in Targhee sheep. Genetic correlation between 3WT with post-3WTs was very high (3WT and 6WT = 0.94, 3WT and 9WT = 0.93, 3WT and 12WT = 0.93); indicating the scope of indirect selection for post-3WTs on the basis of 3WT, suggesting that animals with above average 3WT would tend to be above average in genetic merit for 9WT and 12WT too. Genetic correlation between other weight traits (6WT to 12WT) was also high (positive) ranging from 0.85 for 9WT and 12WT to 0.94 for 6WT and 9WT. High genetic correlation also suggests that many of the genetic factors that influence BW at weaning to adult stage were same. This result falls within the range of estimates given by Rashidi et al. (Reference Rashidi, Sheikhahmadi, Rostamzadeh and Shrestha2008) for Markhoz Goats.
Estimates of genetic correlation and permanent environmental correlations (below the diagonal with permanent environmental correlation in brackets) and phenotypic and residual correlations (above the diagonal with residual correlations in brackets) for different economic traits

BWT = birth weight; 3WT = weaning weight; 6WT = 6-month weight; 9WT = 9-month weight; 12WT = 12-month weight; GFW = greasy fleece weight.
€Indicates that the approximation used to define standard errors of parameter estimates failed.
Estimates of maternal permanent environmental correlation (r c) were high and positive (0.62 for BWT and 9WT to 0.98 for 3WT and 6WT and 3WT and 9WT) among weight traits. The estimate of r c for BWT and 3WT was 0.79, which indicates that in the existing managemental conditions, good maternal environment pose positive effects on lambs from birth to adult stage. These results agree with the estimates by Rashidi et al. (Reference Rashidi, Sheikhahmadi, Rostamzadeh and Shrestha2008) for Markhoz goats. Current estimate of r c was higher than the estimate of 0.46 by Hanford et al. (Reference Hanford, Van Vleck and Snowder2002) for Columbia sheep. Estimates for phenotypic correlation between different BW traits were positive and medium to large and also similar to the residual correlation estimates for the respective traits.
Direct genetic correlation estimate of GFW with BWT was small (0.01), and low to moderate (positive) for weight at other ages (0.16 to 0.40). Estimate of 0.01 for BWT and GFW was in contrast to the report of Hanford et al. (Reference Hanford, Van Vleck and Snowder2003) in Targhee sheep (0.24 for BWT and Fleece weight), and review by Safari et al. (Reference Safari, Fogarty and Gilmour2005) for weighted mean value (0.21) for GFW and BWT. Other estimates were within the range of values reviewed by Safari et al. (Reference Safari, Fogarty and Gilmour2005). Current estimates for genetic correlation of GFW with 6WT and 12WT were lower than the estimates by Yazdi et al. (Reference Yazdi, Engstrom, Nasholm, Johansson, Jorjani and Liljedahl1997) in Baluchi sheep at 6 months of age (0.41) and by Mandal et al. (Reference Mandal, Neser, Rout, Roy and Notter2009) in Muzaffarnagri sheep at 6 and 12 months of age (0.61 and 0.67). Corresponding permanent environmental correlation due to dam for GFW with live weights at different ages were moderate in this study (0.45 for GFW and 9WT to 0.66 for GFW and 3WT). These estimates were within the range of values reported by Rashidi et al. (Reference Rashidi, Sheikhahmadi, Rostamzadeh and Shrestha2008) in Markhoz goats. Phenotypic correlation estimates for GFW with live weights at different ages in Bharat Merino sheep were ranging from 0.27 for GFW and BWT to 0.52 for GFW and 3WT. These estimates correspond with the review by Safari et al. (Reference Safari, Fogarty and Gilmour2005). In this study, phenotypic correlations of GFW with 6WT and 12WT were higher than the estimate by Yazdi et al. (Reference Yazdi, Engstrom, Nasholm, Johansson, Jorjani and Liljedahl1997) for Baluchi sheep at 6 months of age (0.02) and similar to estimates by Mandal et al. (Reference Mandal, Neser, Rout, Roy and Notter2009) for Muzaffarnagri sheep at 6 and 12 months of age (0.36 and 0.39). Estimate of genetic and phenotypic correlations of 3WT with GFW are 0.16 and 0.52, respectively.
Conclusions
In this study, genetic parameters for different economic traits were estimated for Bharat Merino sheep. Additive genetic variability for all the traits was low. There was a complete loss of additive variability at the age of 6 months. High (positive) genetic correlations between 3WT and post-3WTs are indicative of similar response to the selection, if selection is carried out at weaning instead of the present practice of selection at 6 months of age. Low heritability at all ages is the matter of concern, as indirect selection demands higher heritability for the correlated trait. Culling of poor growing stock at 3WT and 6WT will be practiced on the basis of their phenotypic value. Maternal heritability was not evident for the BW traits, whereas there was evidence for the permanent environment effects due to dam for live weights at all ages except yearling weight. High (positive) maternal permanent environmental correlation between live weights at all ages is indicative of the positive effects of good maternal environment from birth to 9 months of age.
Acknowledgement
Authors acknowledge the contribution of Shri N. C. Gupta for help in data management. Support provided by the Director, CSWRI, for the execution of the project is deeply acknowledged.