I. INTRODUCTION
In the last two decades, semiconductor nanowires have been widely investigated as building components for a novel generation of semiconductor devices with enhanced performance and functionalities. Reference Lieber1 Due to their unique properties such as large surface-to-volume ratio and aspect ratio as well as high crystal quality, semiconductor nanowires find possible applications as platforms for next-generation solar cells, Reference Tian, Zheng, Kempa, Fang, Yu, Yu, Huang and Lieber2,Reference Colombo, Heibeta, Gratzel and Fontcuberta i Morral3 light-emitting diodes, Reference Huang, Duan and Lieber4–Reference Hayden, Greytak and Bell6 photodetectors Reference Soci, Zhang, Bao, Kim, Lo and Wang7–Reference Kind, Yan, Messer, Law and Yang9 as well as chemical and biosensors. Reference Chen, Wong, Yuan and Zhang10,Reference Comini, Baratto, Faglia, Ferroni, Ponzoni, Zappa and Sberveglieri11 Furthermore, they can be successfully integrated into nanoelectronic circuits Reference Duan, Huang, Cui, Wang and Lieber12 or can act as photonics waveguides and resonant cavities for nanowire-based lasers. Reference Yan, Gargas and Yang13–Reference Röder, Wille, Geburt, Rensberg, Zhang, Lu, Capasso, Buschlinger, Peschel and Ronning15 However, several challenges still must be faced to fully exploit the potential of such nanoscale devices and achieve their large-scale commercial distribution. Among these challenges, we can cite in particular the need for a better control of the nanowire synthesis, integration, and surface properties as well as the development of experimental methods which can enable a standardized characterization of the nanowire devices. Reference Richter, Xiong, Zhu, Wang, Stanford, Hong, Lee, Ioannou and Li16,Reference Dagata, Richter, Silver, Vogel and Martinez de Pinillos17 In particular, the inadequacy of traditional measurement approaches is inherently related to the reduced dimensionality of the nanowire geometry. For instance, the characterization of the photoresponsivity in nanowire-based photodetectors is typically performed by placing the device under a laser spot and measuring the change in its conductivity. Reference Prades, Jimenez-Diaz, Hernandez-Ramirez, Fernandez-Romero, Andreu, Cirera, Romano-Rodriguez, Cornet, Ramon Morante, Barth and Mathur18 However, typical nanowire diameters (∼100 nm) are significantly smaller than the size of the laser spot achievable with objective lenses, which are intrinsically limited by diffraction. This leads to large uncertainties in the quantification of the excitation power incident on the nanowire and consequently of the device’s photoresponsivity. Additionally, it does not allow for locally investigating the impact of the surface states on the nanowire’s photoresponse.
In this paper, we describe an experimental method for the quantification of the photoresponse of photodetectors based on single-contacted GaAs nanowires, which are ideal building components for photodetection applications in the near-infrared and visible spectral ranges thanks to the low band gap (1.42 eV at room temperature), high charge carrier mobility, as well as long photoconductivity lifetimes. Reference Boland, Conesa-Boj, Parkinson, Tütüncüoglu, Matteini, Ruffer, Amaduzzi, Jabeen, Davies, Joyce, Fontcuberta i Morral and Johnston19 Furthermore, we investigate the impact of the optical excitation on the thermal generation of charge carriers in such nanoscale devices and we discuss the main challenges toward their metrological calibration.
II. EXPERIMENTAL METHODS
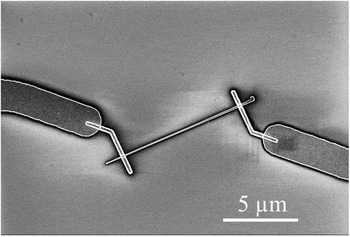
GaAs nanowires with an intrinsic core and n-doped shell were grown by Ga-assisted molecular beam epitaxy on a (111) Si substrate. The nanowire core, with a diameter of 80 nm, was grown at 640 °C with a nominal Ga growth rate of 0.3 Å/s, an As4 partial pressure of 5.5 × 10⁻⁶ torr, and a rotation rate of 7 rpm. Reference Matteini, Tütüncüoglu, Mikulik, Vukajlovic-Plestina, Potts, Leran, Carter and Fontcuberta i Morral20,Reference Russo-Averchi, Heiss, Michelet, Krogstrup, Nygard, Magen, Morante, Uccelli, Arbiol and Fontcuberta i Morral21 In order to grow the shell with a nominal thickness of 40 nm, the nominal Ga growth rate and the As4 partial pressure were increased to 0.95 Å/s and 1.3 × 10⁻⁵ torr, respectively, while the temperature was reduced to 465 °C. Si was added as a dopant during the growth of the shell, which had a nominal doping concentration of 5 × 1018 cm−3. Reference Casadei, Alarcon Llado, Amaduzzi, Russo-Averchi, Rüffer, Heissm, Dal Negro and Fontcuberta i Morral22 After the growth, the nanowires were sonicated and dispersed on a heavily p-type doped Si substrate with 200 nm of SiO2 on top and patterned with a grid of metal markers. The electrical contacts were then defined as described in the following. At first, the nanowires were localized on the substrate by means of an optical microscope. Then, the relative position of the selected nanowires with respect to the marker grid was encoded by an in-house developed software. 23,Reference Blanc, Heiss, Colombo, Mallorquì, Safaei, Krogstrup, Nygård and Fontcuberta i Morral24 The electrodes were defined by e-beam lithography using a Vistec EBPG 5000 system and by e-beam evaporation of Pd/Ge/Au (40/170/100 nm). Immediately prior to the metal deposition, the nanowires were immersed for 1 s in HCl to etch the oxide layer at the surface. A rapid thermal annealing at 300 °C for 120 s was performed, to induce the out-diffusion of Ga atoms and the in-diffusion of Ge atoms into the Ga vacancies. As a substitutional impurity, Ge acts as n-type donor in GaAs and should therefore favor the reduction of the Schottky barrier at the contacts. Reference Gutsche, Lysov, Regolin and Brodt25 A scanning electron microscope (SEM) picture of a typical sample is shown in Fig. 1. Finally, some selected samples were electrically bonded on a commercial chip.
Scanning electron microscopy (SEM) picture of a single-contacted GaAs nanowire. The gap between the electrodes is 8 µm.

Spatially resolved photocurrent measurements were performed with a far-field scanning optical setup equipped with a confocal microscope and a piezoelectric translation stage. A diode laser with a main emission wavelength of 656 nm and an excitation power of 20 mW was used as excitation source with a photon energy above the band gap of GaAs. The current in the devices was measured with a Source-Meter Unit Keithley 2400 (Keithley Instruments, Cleveland, Ohio) by applying a drain-source voltage V ds = 0.3 V between the electrodes. After a rough localization of the sample position on the piezoelectric stage, an optical scan of the substrate surface in the proximity of the selected samples was performed by scanning the sample with the laser beam and collecting the reflected light by means of an optical sensor. This provided a two-dimensional false-color image of the surface morphology, which allowed selecting an appropriate two-dimensional spatial range for the measurement of the photocurrent. In order to optimally focus the laser beam to the sample, the vertical position of the piezoelectric stage was adjusted until the value of the false-color scale in correspondence to the electrodes was maximized with respect to that at the SiO2 surface. At the focal plane, the laser spot was expected to be in the range of 1–3 µm. A neutral-density filter was placed directly after the laser, in order to reduce its excitation power down to 3.5 µW. Considering a power loss of 88.5% along the optical path, this results in an excitation intensity on the sample between 51 and 6 W/cm2. Further details concerning this confocal setup can be found elsewhere. Reference Rodiek, Lopez, Hofer, Porrovecchio, Smid, Chu, Gotzinger, Sandoghdar, Lindner, Becher and Kück26
III. RESULTS AND DISCUSSION
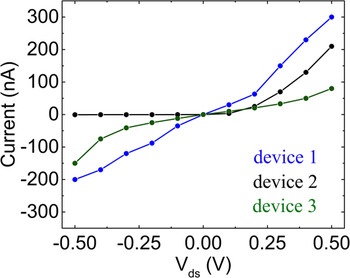
Current–voltage (I–V) measurements in the dark were performed on several single-nanowire devices. As an example, three of them are shown in Fig. 2. The blue curve is approximately linear, revealing the Ohmic properties of the corresponding device. Its resistance can be calculated as the slope of the I–V characteristics, which is around 1.3 MΩ. On the other hand, the other two devices are characterized by lower conductivity and Schottky contacts with different barrier heights, as suggested by the asymmetric and noncomparable shapes of the black and the green curves. This reveals the inhomogeneous contact properties of the produced devices.
Current–voltage (I–V) characteristics in the dark of three single-contacted GaAs nanowires produced under the same conditions. The blue curve is approximately linear, indicating the Ohmic properties of the corresponding device. The electrical properties of the other two devices are instead dominated by Schottky contacts, as revealed by the highly asymmetric I–V characteristics (see the black and green curves).

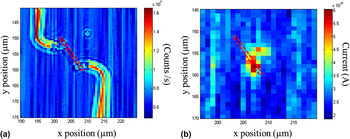
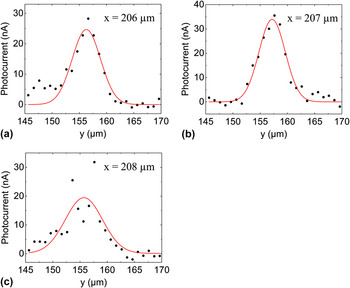
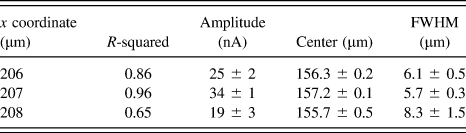
A false-color image of the surface morphology of a selected sample is shown in Fig. 3(a). Both the x- and y-axis refer to the absolute spatial coordinates which are scanned by the piezoelectric stage. A red-dashed rectangular shape roughly indicates the position of the nanowire between the electrodes. The spatially resolved measurement of the photocurrent was performed by scanning the position of the laser spot along vertical lines parallel to the y-axis, within the spatial ranges [x = 145 µm; x = 170 µm] and [y = 195 µm; y = 220 µm] and with a spatial resolution of 1 µm. The laser spot was kept at every position for 1 s and moved to the following position without leaving any appreciable relaxation time for the photocurrent decay. The obtained mapping of the photocurrent [Fig. 3(b)] reveals a nonuniform photoresponse of the device, with a larger generation of photocurrent in the proximity of the contact at (x ≈ 159 µm; y ≈ 207 µm). This indicates that the photoresponse of the investigated device is likely dominated by the separation of photogenerated charge carriers, which is induced by the band bending near a Schottky contact. Reference Gu, Kwak, Lensch, Allen, Odom and Lauhon27 The device photoresponse was then quantitatively investigated by fitting the photocurrent along the y-axis at the positions x = 206 µm, x = 207 µm, and x = 208 µm. The data were fitted with Gaussian functions, since we assumed to have a Gaussian laser beam and a linear photoresponse of the GaAs nanowires in the investigated excitation intensity regime. Reference Thunich, Prechtel, Spirkoska, Abstreiter, Fontcuberta i Morral and Holleitner28 The obtained fitting functions are shown in Figs. 4(a)–4(c) and the values of the fitting parameters are summarized in Table I. The data at x = 206 µm and x = 207 µm are relatively well described by the respective Gaussian curves, while the agreement with the Gaussian model is not as good for those at x = 208 µm, as indicated by the significantly lower value of the R-squared obtained from the fitting procedure. We assume that the scanning of the photocurrent along the y-axis at x = 208 µm is affected by the undesired scattering of the laser light at the electrode in the proximity of the highly photosensitive contact. Such scattering of the light may lead to the larger full width at half maximum (FWHM) of the corresponding photocurrent Gaussian curve as well as to the lower y-coordinate of its center compared to those obtained at x = 206 µm and x = 207 µm. In fact, since the nanowire is tilted with respect to the y-axis [see Fig. 3(a)], without the contribution of undesired light scattering to the nanowire photocurrent, the y-coordinate of the Gaussian centers should progressively increase from x = 206 µm to x = 208 µm.
False-color image of the surface morphology of a selected sample (a) and a corresponding two-dimensional mapping of the photocurrent (b). The dashed red rectangular shape indicates the position of the nanowire. The higher values of the current in the proximity of one contact reveal the nonuniform photoresponse of the nanowire along its length.

Gaussian fitting of the photocurrent values along the y-axis at x = 206 µm (a), x = 207 µm (b), and x = 208 µm (c). The obtained fitting parameters for the gaussian curves are summarized in Table I.

Fitting parameters of the Gaussian curves, which were used to fit the photocurrent values along the y-axis at x = 206 µm, x = 207 µm, and x = 208 µm.

Furthermore, we compared the FWHM of the Gaussian curves obtained at x = 206 μm and x = 207 µm with that of the Gaussian profile of the laser beam intensity, which can be written as:
 $${I_{{\rm{beam}}}}(r) = {I_0} \cdot \exp \left( { - 2 \cdot {{{r^2}} \over {r_{{\rm{beam}}}^2}}} \right)\quad ,$$
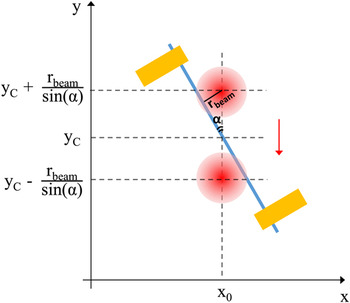
where r is the distance with respect to the beam center and r beam is the beam radius. Correspondingly, I beam(r beam) = I 0/e 2 and FWHMbeam ≈ 1.17·r beam. Considering a beam diameter between 1 and 3 µm, we obtain a FWHMbeam comprised, respectively, between 0.59 and 1.77 µm. As such, the values of the FWHM of the photocurrent Gaussian curves obtained at x = 206 μm and x = 207 µm are significantly larger than the FWHM of the laser beam. This is caused by two main reasons, which are related to the experimental conditions of the scanning of the photocurrent. First of all, the FWHM of the photocurrent profile along the y-axis depends on the angle between the scanning direction and the main axis of the nanowire. We can determine a quantitative relation by considering the schematic geometrical representation in Fig. 5. The two red circles indicate the positions of the laser spot along the y-axis at which the distance between the spot and the nanowire corresponds to r beam. In conditions of linear photoresponse, as in our experimental case, when the spot is located at these two positions we expect to measure the photocurrent I ph = I ph,0/e 2, where I ph,0 is the photocurrent maximum. The latter is observed when the center of the laser spot is located at y = y C. The y-coordinates at which I ph = I ph,0/e 2 can be expressed by means of simple geometrical considerations as y C ± r beam/sin(α), where α is the angle between the main axis of the nanowire and the scanning direction. This determines the following relation between the FWHM of the photocurrent Gaussian curve and FWHMbeam:
 $${\rm{FWHM}} = {{{\rm{FWH}}{{\rm{M}}_{{\rm{beam}}}}} \over {\sin \left( \alpha \right)}}\quad .$$
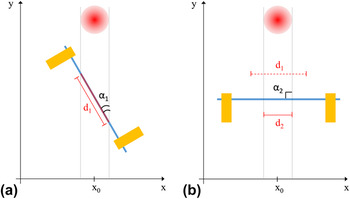
From Fig. 3(a), we can assume an angle α ≈ 35°. Using Eq. (2) and considering d beam ≈ 1–3 µm, we obtain the values for the FWHM of the photocurrent profile between, respectively, 1.04 and 3.1 µm. Although these values are larger than the respective values of the FWHMbeam, they are however still lower than those which we obtained from the fitting of the experimental data (Table I). The second factor, which likely leads to the larger profile of the experimentally measured photocurrent, is the fact that the measurement was performed without any appreciable relaxation time for the photocurrent decay. Preliminary photoconductivity measurements, not reported here, show that after 1 s of the laser excitation with the laser spot centered on the nanowire, the photocurrent decay proceeds on the temporal scale of few minutes. In principle, if the scanning is performed with such relaxation time, the experimental FWHM of the Gaussian photocurrent curves can be appropriately normalized with respect to the angle α by using Eq. (2). Such angle-normalized FWHM of the photocurrent profile should therefore numerically correspond to the FWHM of the beam profile. The amplitude of the Gaussian curve depends on the angle α as well, as schematically explained in Fig. 6 by considering the scanning along the y-axis at two different angles α1 and α2. At the angle α1 [Fig. 6(a)], the laser beam hits during the scanning of segment d 1 of the nanowire, which is indicated by the continuous red line. On the other hand, at the angle α2 [Fig. 6(b)], a different portion of the nanowire is hit, as demonstrated by comparing the segments d 1 and d 2. Therefore, the corresponding Gaussian curves of the photocurrent along the y-axis will be characterized by different values of the amplitude. In principle, if the nanowire is characterized by a uniform photoresponse along its length, the amplitude can be normalized with respect to the area of the nanowire portion which is hit by the laser beam. Under this condition, both the angle-normalized FWHM as well as the angle-normalized amplitude of the Gaussian function depend simply on the laser profile, on its intensity, and on the photoconductivity properties of the nanowire. The device’s photoresponse along the nanowire diameter can be therefore univocally described in terms of such Gaussian photocurrent curves. However, when the photoresponse is not uniform along the nanowire length, as in our experimental case, the amplitude of the Gaussian function has a more complex dependence on the angle between the main nanowire axis and the scanning direction.
Schematic geometrical description of the photocurrent scanning along the y-axis at x = x 0. The main axis of the nanowire forms an angle α with the scanning direction, which is indicated by the red arrow. The two red circles indicate the positions of the laser spot along the y-axis at which the distance between the spot and the nanowire corresponds to r beam. In conditions of linear photoresponse, we expect to measure at these positions a photocurrent I ph = I ph,0/e 2, where I ph,0 is the photocurrent maximum measured with the laser spot at y C. By means of simple geometrical considerations, the y-coordinates at which I ph = I ph,0/e 2 can be expressed as y C ± r beam/sin(α). Since FWHMbeam ≈ 1.17·r beam, the FWHM of the photocurrent profile along the y-axis is given by FWHM = FWHMbeam/sin(α).

The scanning of the photocurrent along the y-axis under the angles α1 (a) and α2 (b) involves respectively the segments d 1 and d 2 of the nanowire. Since the two segments are different, the corresponding Gaussian curves of the photocurrent along the y-axis will be characterized by different values of the amplitude.

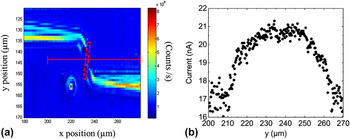
The lack of appreciable photoresponse in some of the produced samples also allowed for investigation into the impact of laser-induced heating effects on the photodetection performances of such nanowire-based devices. For this purpose, we performed a photocurrent scanning on a second sample within a broad spatial interval. A relaxation time of 4 min between the light excitations at consecutive positions was introduced by adding a mechanical shutter to the measurement setup. In order to limit the total duration of the measurement, the scanning was performed along a single line, which is highlighted by a continuous red line on the false-color image of the surface morphology of the sample [Fig. 7(a)]. The position of the nanowire is indicated in the figure by the dashed rectangular shape. The values of the current measured along this scanning line are shown in Fig. 7(b). Between x = 200 µm and x = 225 µm, the current increases approximately from 17 to 20.5 nA, then it saturates and remains constant in the interval [x = 225 µm; x = 250 µm], in which the nanowire is certainly hit by the laser spot. Then, the current decreases progressively until it reaches the original value. The substantial absence of current increase in the interval [x = 225 µm; x = 250 µm] indicates that the increase of around 3.5 nA between x = 200 µm and x = 225 µm cannot be attributed to a direct photoexcitation of charge carriers in the nanowire. We suggest instead that it is caused by a thermal excitation of charge carriers in the nanowire, which occurs due to the heating of the substrate during light excitation. In particular, when the laser spot hits the substrate surface at a large distance from the nanowire, the light can penetrate without any significant loss through the SiO2 layer and gets absorbed by the Si substrate, generating heat. Since the SiO2 layer is relatively thin (200 nm), heat transfer toward the nanowires likely occurs inducing the thermal generation of charge carriers and consequently the increase of the device’s conductivity.
False color image of the surface morphology of a selected sample (a) and the corresponding scanning of the photocurrent (b) along the direction indicated by the red line. Within x = 225 µm and x = 250 µm, in which the laser spot hits the nanowire, the current does not increase. Therefore, the current increase observed between y = 200 µm and y = 225 µm is not caused by photoexcitation of charge carriers in the nanowire.

In view of a metrological calibration of such nanoscale photodetectors, further experiments have to be performed, in order to examine in depth at least the two main aspects. At first, it is fundamental to determine the dependence of such laser-induced thermal effects on the light excitation and the scanning conditions as well as on the single device components (substrate, oxide layer, nanowire). Secondly, it must be clarified whether the samples produced according to the same standard are affected by such effects similarly. In general, the quantification of laser-induced heating effects is fundamental, since the thermal generation of charge carriers may negatively affect the precise determination of the detector quantum efficiency. Nowadays, detection of the optical power in the range of 100 pW can be achieved according to the metrological standards with an uncertainty of 0.1%. Reference Chunnilall, Degiovanni, Kück, Müller and Sinclair29 Therefore, in order to use such nanoscale photodetectors for low-power detection applications, their photoresponse must be at least 1000 times higher than this laser-induced thermal contribution.
IV. CONCLUSIONS
We have reported about the challenges which must be faced, to achieve a metrological calibration of photodetectors based on contacted single GaAs nanowires. We have described an experimental method based on the far-field photocurrent spectroscopy, which allows a quantitative description of the photoresponse properties of such nanoscale devices. This method provides a two-dimensional mapping of the photocurrent, which is quantitatively evaluated by means of a fitting procedure with spatially dependent Gaussian functions. The FWHM and the amplitude of such Gaussian functions depend on the experimental conditions under which the scanning of the photocurrent is performed. In particular, we have quantitatively discussed their dependence on the angle which is formed between the main axis of the nanowire and the scanning direction. Additionally, we have investigated the impact of laser-induced heating effects on the device’s photoresponse, suggesting that the absorption of the laser light in the substrate in the proximity of the nanowire leads to the thermal generation of charge carriers in the nanowire and correspondingly to an enhanced device’s conductivity.
The presented study highlights fundamental aspects concerning the quantification of the photoresponse in nanowire-based photodetectors, which must be taken into consideration for the future development of standardized calibration methods for nanowire photodetectors with subwavelength spatial resolution as well as low-power sensitivity.
ACKNOWLEDGMENTS
We gratefully acknowledge Gözde Tütüncüoglu, Nicholas G. Morgan, Martin Friedl and Anna Fontcuberta i Morral (Laboratory of Semiconductor Materials of the École Polytechnique Fédérale de Lausanne) for sample preparation and comments on the manuscript. Furthermore, we gratefully acknowledge support of the Braunschweig International Graduate School of Metrology B-IGSM and the DFG Research Training Group GrK1952/1 “Metrology for complex Nanosystems” as well as that of the DFG-funded research group FOR1616 (project Vo 1265/6-2).