Introduction
Concerns about animal health and welfare, on the one hand, and slim economic margins, on the other, are the reality in dairy farming of today. In view of this, clinical mastitis (CM) is of considerable interest, since it causes both animal suffering and economic losses. Clearly, CM control is paramount. However, preventive measures can be costly, so farmers will want an assurance that any expenses they incur will be offset by financial gains. Accurate estimates of the economic impact of a reduced incidence of CM are therefore important in the decision-making process.
Direct costs of CM associated with treatment, discarded milk, increased labour and decreased milk production can be readily assessed in individual cows. Indirect consequences, arising through dynamic effects in the herd, by contrast, often reflect management decisions taken by the farmer. They therefore need to be addressed at herd level. Increased risk of culling, and thus increased replacement costs, as well as penalties or loss of premiums related to increased somatic cell count (SCC) in the bulk tank milk, are good examples of dynamic factors. The decision to cull a mastitic cow in order to increase the average milk yield per cow and decrease the SCC in the bulk tank, and thus incur a replacement cost, illustrates the way in which dynamics within the herd impact on herd-level economy (Seegers et al., Reference Seegers, Fourichon and Beaudeau2003). Such dynamics require the economic impact of CM to be addressed at herd level, preferably with a methodology capable of reflecting the consequences of different management strategies. Stochastic simulation has therefore been suggested to be the most relevant method to use when studying the effects of CM in a dairy herd (Dijkhuizen et al., Reference Dijkhuizen, Huirne and Jalvingh1995; Allore and Erb, Reference Allore and Erb1999; Seegers et al., Reference Seegers, Fourichon and Beaudeau2003).
Estimates of the economic impact of a case of CM show large variation. The main reasons for this variation seem to be differences in the sources of loss included, the estimation method and the origin of the data (Schepers and Dijkhuizen, Reference Schepers and Dijkhuizen1991; McInerney et al., Reference McInerney, Howe and Schepers1992; Halasa et al., Reference Halasa, Huijps, Osteras and Hogeveen2007). The definition of a case of mastitis also differs from one study to another. Any generalization of results should therefore be made with caution, and evaluations of the economic consequences of CM based on the effects of the disease on production should be conducted for a specific herd and in a specific economic context; this will result in more usable figures (Seegers et al., Reference Seegers, Fourichon and Beaudeau2003).
In most previous work on the economic consequences of CM, yield loss has been described in the same manner irrespective of when, in lactation, CM occurred: Kossaibati and Esslemont (Reference Kossaibati and Esslemont1997) and Yalcin (Reference Yalcin2000) used a constant yield loss, whereas Østergaard et al. (Reference Østergaard, Chagunda, Friggens, Bennedsgaard and Klaas2005) used a spline function to illustrate the yield loss. Studies have, however, indicated that the magnitude of yield loss depends on the lactation stage in which the cow develops CM (Lucey and Rowlands, Reference Lucey and Rowlands1984; Rajala-Schultz et al., Reference Rajala-Schultz, Grohn, McCulloch and Guard1999; Hagnestam et al., Reference Hagnestam, Emanuelson and Berglund2007). As loss of milk production is the single largest factor in the total economic loss caused by CM (Degraves and Fetrow, Reference Degraves and Fetrow1993; Kossaibati and Esslemont, Reference Kossaibati and Esslemont1997; Seegers et al., Reference Seegers, Fourichon and Beaudeau2003), the timing of the disease event can be expected to have a substantial impact on the cost per case. This has been confirmed by Huijps et al. (Reference Huijps, Lam and Hogeveen2008).
The main aim of this study was to assess, at herd level, the economic impact of reducing the incidence of CM under current Swedish farming conditions. A second objective was to ask whether recognition that yield loss varies depending on when, during lactation, CM occurs results in an evaluation of the cost of CM that differs from that derived when just one yield loss is modelled and the modelling ignores the point, during lactation, that CM occurs.
Material and methods
The SimHerd model
SimHerd simulates a dairy herd and is capable of simulating both SCC and mastitis in individual cows. It has been used by Østergaard et al. (Reference Østergaard, Chagunda, Friggens, Bennedsgaard and Klaas2005) to study the effects of pathogen-specific mastitis. SimHerd is able to simulate different types of mastitis and was therefore a suitable choice for modelling the effects of CM occurring at different stages of lactation. A modified version of SimHerd IV (Østergaard et al., Reference Østergaard, Chagunda, Friggens, Bennedsgaard and Klaas2005) was used in the present study.
SimHerd is a dynamic bio-economic model with stochastic elements. It simulates production and associated events in a dairy herd through weekly time-increments. The simulation unit in the model is the individual animal. Herd-level production is simulated through the changes in state and production of individual animals. The state of an animal in each week is defined by age, parity, lactation stage, milk yield, body weight (BW), reproductive status (oestrus and pregnancy) and disease status. Discrete events, such as oestrus detection, conception, sex and viability of the calf, disease occurrences, non-voluntary culling and mortality, are triggered stochastically.
Primiparous and multiparous cows are modelled with differently shaped lactation curves. The yield capacity of a cow is decided at birth by assigning each heifer calf a random value taken from a normal distribution. This procedure creates variation in the performance of cows. At each calving, a second value is drawn, modifying the yield level of the cow and thus causing variation between consecutive lactations in the same cow (Kristensen et al., Reference Kristensen, Østergaard, Krogh and Enevoldsen2008).
The SCC is expressed as the natural logarithm of cells/ml of milk. A function of parity, lactation stage, CM occurrence and a Gaussian random effect is used to model SCC in individual cows.
Replacement heifers are recruited from own young stock, if available, and otherwise through the purchase of pregnant heifers. The number of heifer calves in the herd is determined by the simulated number of calvings, the probability of a cow delivering a female calf and the stillbirth rate. Heifers enter the dairy unit in an advanced stage of pregnancy if the number of cows is less than the maximum capacity of the herd or if at least one cow has been selected for culling. Otherwise they are sold. If no heifer is available at the time a cow is exiting the herd, a replacement heifer is purchased.
Voluntary culling decisions are based on the number of days open and milk yield. Non-voluntary culling accounts for cullings triggered by diseases not included in the model or other unforeseen events. Disease and unforeseen events can also result in mortality.
Modelling the effect of CM on milk yield
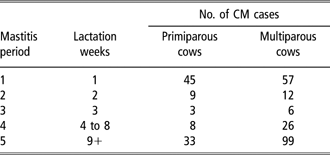
The methodology and the data set previously described by Hagnestam et al. (Reference Hagnestam, Emanuelson and Berglund2007) were used to generate estimates of the yield losses caused by CM (expressed in kg of energy-corrected milk (ECM)). Test-day yields were related to time of diagnosis through a mastitis index. The index was a categorical variable for time intervals before and after the diagnosis. Separate index categories were created for 4 weeks preceding diagnosis and 10 weeks following diagnosis. All test days occurring earlier than 4 weeks before diagnosis were grouped into one category, and all test days occurring later than 10 weeks after diagnosis were grouped into another category. Non-mastitic cows constituted a separate index category. In the model used by Hagnestam et al. (Reference Hagnestam, Emanuelson and Berglund2007) to analyse yield losses, daily milk yield was the outcome variable and an interaction term between the mastitis index and stage of lactation was among the independent variables. Yield loss was calculated as the difference between daily yield in mastitic and non-mastitic cows. These analyses resulted in unique yield losses for CM cases occurring in different weeks of lactation. The amount of detail in the results was therefore considerable; hence, in order to be implemented into SimHerd, the results had to be generalized. For that reason, five periods of lactation in which the yield losses from CM were similar (from here on denoted mastitis periods) were created (Table 1). Shorter periods were specified in early lactation, because most cases develop then, and the shapes of the yield-loss patterns also differed more.
Definition of the mastitis periods used in the simulation and the empirical numbers of clinical mastitis cases occurring within each period in the study by Hagnestam et al. (Reference Hagnestam, Emanuelson and Berglund2007)

CM = clinical mastitis.
Patterns of yield loss caused by CM
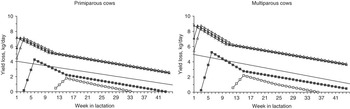
Different yield-loss patterns were defined for each of the five mastitis periods (Figure 1). The yield-loss patterns were modelled through three-phase linear spline functions that were parameterized on the basis of analyses described by Hagnestam et al. (Reference Hagnestam, Emanuelson and Berglund2007). The decline in daily milk yield was modelled to start 3 weeks prior to diagnosis, in accordance with the results of Hagnestam et al. (Reference Hagnestam, Emanuelson and Berglund2007). Peak yield loss occurred in the week when the diagnosis was made. The final knot in the spline functions was defined 9 weeks following diagnosis. Throughout the remaining lactation, the yield loss was modelled by a daily slope.
Yield loss (kg of energy-corrected milk/day) in different weeks of lactation, expressed relative to the cow’s own yield potential, in cows diagnosed with clinical mastitis in lactation week 1 (×), lactation week 2 (▴), lactation week 3 (▵), lactation week 6 (▪) and lactation week 15 (□). The solid line represents conventional modelling. Diagnosis occurred at the time of peak yield loss.

Yield-loss patterns were constructed for multiparous cows and were subsequently adjusted to fit the corresponding yield-loss patterns in primiparous cows. Two general shapes of yield-loss pattern for cases developing before and after peak yield (weeks 1 to 8 and weeks 9+) were defined. The first of these patterns was adjusted to fit the specific yield-loss patterns of mastitis periods 1 to 4. The second was applied to all cases of CM occurring after peak yield. The general yield-loss pattern representing weeks 9+ was based on CM cases occurring in weeks 9 to 30 (excluding 7 and 13 cases developing after week 30 in primiparous and multiparous cows, respectively).
Yield-loss patterns of mastitis periods 1 to 4 were defined by horizontal and vertical parallel displacement of the general yield-loss pattern for cases developing before peak yield. The horizontal displacement adjusted the yield-loss pattern of each mastitis period to the point, in lactation, when the yield loss occurred, whereas the vertical displacement determined the size of the yield loss. Yield loss in each mastitis period was calculated as the weighted average daily yield loss in weeks −1, 0, +1, +2 and +7 relative to the week of diagnosis in the results from Hagnestam et al. (Reference Hagnestam, Emanuelson and Berglund2007). Average daily yield loss in mastitis periods 1 to 3 were of the same size (3.5 kg of ECM larger than the average yield loss in mastitis period 4), and the only difference between these yield-loss patterns was consequently the number of weeks of loss prior to diagnosis. Tables 2 and 3 give the input parameters for the yield-loss pattern in each mastitis period in primiparous and multiparous cows, respectively.
Parameterization of the three-line spline functions describing the yield-loss patterns caused by clinical mastitis in primiparous cows with own potential yield of mastitic primiparous cows as reference level for the yield loss

MP = mastitis period; YL = yield loss (kg of energy-corrected milk/day); DIM = days in milk.
Parameterization of the three-line spline functions describing the yield-loss patterns caused by clinical mastitis in multiparous cows with own potential yield of mastitic multiparous cows as reference level for the yield loss

MP = mastitis period; YL = yield loss (kg of energy-corrected milk/day); DIM = days in milk.
Yield-loss patterns of primiparous cows were obtained by scaling the yield-loss patterns of multiparous cows by 0.81, because of the limited number of CM cases in primiparous cows. This factor was attained by comparing the average daily yield loss in weeks −1, 0, +1, +2 and +7 relative to the week of diagnosis in primiparous and multiparous cows developing CM in the first 3 weeks of lactation. The decline in yield loss later than 9 weeks after diagnosis was adopted directly from the yield-loss patterns of multiparous cows.
Two subsets of general yield-loss patterns with different reference levels for the yield loss were created. The yield of non-mastitic (no-CM) cows was used as the reference in one subset. In the other subset, the potential yield of mastitic cows, had they not developed CM (own), was used, because high milk yield is a known risk factor for CM and hence mastitic cows can be assumed to have a higher milk yield potential than non-mastitic cows. The yield potential of mastitic cows was obtained by comparing their production prior to 3 weeks before diagnosis with the production of non-mastitic cows in the same weeks of lactation. The general yield-loss patterns with own as reference were consequently defined by scaling the corresponding yield-loss patterns with no-CM as reference by +2.5 kg of ECM for mastitis periods 1 to 4 and by +0.8 kg of ECM for mastitis period 5.
Figure 1 illustrates the yield-loss patterns in each of the mastitis periods with own as the reference level, together with a linear yield-loss pattern. The linear yield-loss pattern described a more conventional way of modelling yield losses because it was applied irrespective of the timing of CM. It modelled yield loss starting at the time of diagnosis and a decreasing yield reduction thereafter, and it was used as a scenario contrasting with yield-loss patterns specific to each mastitis period. The linear yield-loss patterns were obtained by re-analysing the data from Hagnestam et al. (Reference Hagnestam, Emanuelson and Berglund2007). Instead of including an interaction term between mastitis index and lactation stage in the model, we now only included the main effects. Test days were thus adjusted in accordance with when they were sampled with respect to diagnosis, but they were not adjusted in accordance with when, during the lactation period, the diagnosis occurred. Yield losses were calculated as the difference between yield in mastitic and yield in no-CM cows. Estimates from the period between diagnosis and 10 weeks after diagnosis were used to fit the linear yield-loss pattern in multiparous cows. A linear yield-loss pattern with own as reference was also defined, and this was done by adding an extra yield loss of 2.5 kg of ECM/day. The linear yield-loss pattern in primiparous cows was obtained by scaling the linear yield-loss pattern in multiparous cows by 0.81. Those adjustments were the same as for three-phased yield-loss patterns. In no linear yield-loss pattern was the effect of CM on milk yield allowed to be positive (i.e. such as to increase milk yield). The effect of CM was assumed to stop at drying off.
Effects of CM on other traits
Milk withdrawal
The length of the withdrawal period was 12 days (assuming 6 days of treatment and a 6-day waiting period). Milk withdrawal was modelled to begin at the time of diagnosis.
SCC
The increase in SCC induced by CM was represented in the same manner as it is in Østergaard et al. (Reference Østergaard, Chagunda, Friggens, Bennedsgaard and Klaas2005). All cases were modelled to affect SCC to the same extent, irrespective of the parity of the cow and the lactation stage in which CM occurred. We chose the values of CM caused by minor pathogens in Østergaard et al. (Reference Østergaard, Chagunda, Friggens, Bennedsgaard and Klaas2005) to represent the shape of the three-phase linear spline function. As compared with the other pathogens in the study, these values caused an intermediate effect on SCC.
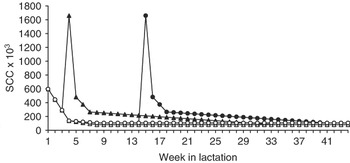
The reduction in milk yield was modelled to begin 3 weeks prior to diagnosis. The effect on SCC was, however, assumed to occur at the time of diagnosis. The SCC patterns in primiparous and multiparous cows with and without CM are described in Figure 2.
The somatic cell count profile (mean values) in non-mastitic primiparous cows (▵) and non-mastitic multiparous cows (○). Primiparous cows diagnosed with clinical mastitis in the 4th week of lactation (▴) and multiparous cows diagnosed with clinical mastitis in the 15th week of lactation (●) are also shown.

No direct association of SCC and milk yield was modelled. This relationship was expressed only through the effect of CM on SCC and milk yield.
Feed intake
One total mixed ration was modelled, and ad libitum feed intake was assumed for all cows. Daily feed intake was measured in MJ/SFU (Scandinavian feed unit) (1 SFU corresponds to 7.89 MJ of net energy for milk production). The actual feed intake of a cow was calculated on the basis of her current energy requirement for maintenance, foetal growth, milk yield and BW change. The effect of CM on feed intake was modelled as a reduced energy requirement related to reduced daily milk yield.
Removal of cows
Cows were not culled directly as a result of CM. Nor did CM have any direct effect on the length of the insemination period. Instead, the effect on culling was wholly mediated through reduction in daily milk yield. Decrease in milk yield caused a shortened insemination period and thereby increased the risk of voluntary culling. Østergaard et al. (Reference Østergaard, Chagunda, Friggens, Bennedsgaard and Klaas2005) used a mortality rate of 0.3% and 2.0%, depending on the pathogen involved. An intermediate value, 1.0%, was chosen in this study, because we did not distinguish between different pathogens.
Diseases and reproduction
The statistical model from which the yield losses caused by CM were estimated included the effects of calving disorders, reproductive disorders, metabolic diseases and claw disorders. The estimated yield losses were consequently valid for cows with an average incidence of other diseases, and the option of including those diseases in SimHerd was therefore not taken up. CM was modelled to have no effect on oestrus detection, conception rate and abortion.
Risk factors for CM
Whether or not a cow developed CM was generated stochastically through a disease risk parameter. The base risk, which differed in primiparous and multiparous cows, was determined by week in lactation. This base risk and a risk factor, yield level, were assumed to determine the overall risk for an individual cow. The overall risk was then compared with a number drawn at random from a uniform distribution. Where the risk was higher than the random number, the cow was modelled to develop CM.
Parity and week in lactation
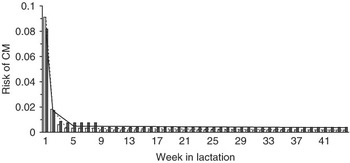
The effects of parity and week in lactation were modelled using parity-specific risk profiles for primiparous and multiparous cows, respectively (Figure 3). The incidence in each mastitis period was calculated from the data set used by Hagnestam et al. (Reference Hagnestam, Emanuelson and Berglund2007). The number of cases within a given mastitis period was divided by the total number of cases in the data set, giving the relative risk in that period. The weekly relative risk was thereafter obtained by dividing the relative risk in the mastitis period by the number of weeks in the period.
The relative risk of clinical mastitis (CM) during different weeks of lactation. White bars represent primiparous cows and grey bars represent multiparous cows. The lines depict the functions used when applying the conventional strategy. The dotted line represents primiparous cows and the solid line represents multiparous cows.

The conventional method of modelling yield losses did not include mastitis periods. Occurrences of CM during lactation were instead modelled by functions – one for primiparous cows and one for multiparous cows. The distribution of CM cases in the data set used by Hagnestam et al. (Reference Hagnestam, Emanuelson and Berglund2007) was transformed into two three-phase linear spline functions representing the distribution of cases in primiparous and multiparous cows, respectively.
Only the first lactational incidence of CM was modelled. Thus, a cow was considered to be at risk until she developed CM, and thereafter the risk of a new case emerging was treated as zero. CM occurring within the heifer period or within a dry period was not modelled.
Production level
The correlation between milk yield and risk of CM, as described by Østergaard et al. (Reference Østergaard, Chagunda, Friggens, Bennedsgaard and Klaas2005), was included. A cow that produced 4 kg of ECM more than the parity-specific average had an increased risk of CM, modelled by an odds ratio of 1.044 = 1.17.
Other risk factors
SimHerd allows the effect of season as a risk factor for CM to be included. In this study, however, we did not include such an effect: we assumed no seasonal effect on CM. The possibility of modelling previous occurrences of CM, and of modelling other diseases as risk factors for CM, was ignored, because the estimated yield losses were applicable to cows with at least one case of CM per lactation and with an average level of other diseases, as explained earlier.
Herd description
SimHerd was parameterized to model an average Swedish herd with 150 cows (Swedish Holstein and Swedish Red). The milk yield of the cows was calibrated to a level of 9000 kg of ECM per cow-year (Swedish Dairy Association, 2005b). The standard deviations (s.d.) in daily yield capacity between cows and between successive lactations in the same cow were both set to 3.0 kg. Cows were dried off 8 weeks before the next calving or when their daily milk yield dropped below 8.0 kg of ECM. No quota constraint was modelled.
The SCC profile of no-CM cows was modelled by a three-phase linear spline function identical to that used by Østergaard et al. (Reference Østergaard, Chagunda, Friggens, Bennedsgaard and Klaas2005). Random variation was added to the SCC profiles of individual cows by multiplying the mean values with random numbers drawn from a normal distribution. The same s.d. was used for all parities and for all weeks in lactation.
A non-grazing system was assumed for reasons of simplicity.
The average incidence of stillbirth in Sweden was 0.08 and 0.05 in calves born of primiparous and multiparous cows, respectively (Swedish Dairy Association, 2005b). A total risk of mortality in calves, including stillbirth and death in the heifer period, of 0.09 in calves born of primiparous cows and 0.06 in calves born of multiparous cows was modelled.
The oestrus detection rate was assumed to be 0.50 in both cows and heifers. The average conception rate in Swedish Holstein and Swedish Red cows in 2005 was 0.41 (B. Berglund, personal communication). The model parameters for conception rate (at 42 days after insemination) were adjusted to fit this figure. The insemination period started 42 days after calving; its length was determined by the yield level of the cow. Cows with a yield level above the parity-specific average were considered high-yielding and given an insemination period of 217 days. Those with a yield level below the parity-specific average were considered low-yielding and assigned an insemination period of 175 days. Cows that were not pregnant at the end of the insemination period were put on a culling list. Cows on the culling list were not inseminated. When a heifer was due to calve, the lowest-yielding cow among the cows on the culling list was sent to slaughter. Voluntary culling also took place if a non-pregnant cow produced less than 8.0 kg of ECM/day. Non-voluntary culling and mortality were assumed to occur at constant weekly risks of 0.2% and 0.04%, respectively, throughout lactation.
Simulated scenarios
In total, 64 scenarios were simulated. These involved various combinations of the risk levels of CM, the strategies for modelling yield losses, the milk production levels and the levels of reproductive performance.
The relative risk in the different mastitis periods was the relative risk given the initial management practice. Herd-level consequences of applying additional preventive measures were addressed by reducing the initial relative risk by 50% and 90%. The initial CM risk was not reduced to zero, because there will always be some cases that cannot be avoided simply by changes in management. An incidence of zero is thus unrealistic and would encourage overestimation of the costs of CM. Seegers et al. (Reference Seegers, Fourichon and Beaudeau2003) recommended the use of the 10th percentile of the initial incidence as a realistic reference level. We therefore defined the lowest achievable incidence of CM as 10% of the initial incidence.
Most CM cases occur before peak yield, and it is also in early lactation that yield losses are the greatest (Hagnestam et al., Reference Hagnestam, Emanuelson and Berglund2007). Some preventive measures, such as dry cow therapy, are applied in the dry period with the aim of reducing CM incidence during this critical period. To investigate the impact of such measures, we also simulated a reduced risk of CM before peak yield while holding the risk of CM after peak yield constant. The risk before peak yield decreased to 50% and 10% of the risk given the initial management practice, and the risk of CM after peak yield remained at the initial level. This approach was not applicable in the conventional modelling of yield losses. The risk of CM was then modelled through a risk function (Figure 3), which meant that it was impossible to reduce only the risk of CM before peak yield. The consequences of decreased risk of CM in the early stages of lactation were therefore only studied using the new strategy of modelling yield losses.
Four different strategies to model yield losses were compared. The potential advantage of using five different mastitis periods, each with a detailed yield-loss pattern, instead of using just one linear yield-loss pattern irrespective of when CM occurred, was examined. In both types of yield-loss pattern, the effects of using either no-CM or own as the reference for yield in healthy cows were considered.
Four types of herd were simulated in order to study whether or not the outcomes of CM depend on herd characteristics. The shape of the average lactation curve and reproductive performance defined the herds. Two types of lactation curve were modelled. One described a normal lactation curve and an average yield level. This curve was derived from the test-day records in the data set described by Hagnestam et al. (Reference Hagnestam, Emanuelson and Berglund2007). The other was more persistent and represented a higher yield level. This curve was based on data for persistent lactation curves as reported by Enevoldsen and Madsen (2006). Reproductive performance was defined as either normal or poor. Poor performance was modelled as a 10% decrease in both oestrus detection rate and conception rate relative to levels in the average herd.
The simulation procedure
SimHerd forecasts the development of the initial herd under the circumstances specified. The parameterization of the initial herd will consequently affect the outcome variables, unless the simulations are run over a sufficiently long period of time. Each scenario was therefore simulated over 10 years, but only the average annual results from the last 5 years of each replicate were used. Any proven differences in the outcome variables could then be attributed largely to the different scenarios. Stable estimates were attained by replicating each scenario 250 times.
Analysis of results
Statistical modelling
The results were analysed by univariate ANOVA. Simultaneous pairwise comparisons of scenarios were conducted using t-tests (P < 0.05).
Economic factors
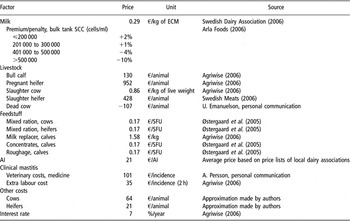
The impact of the scenarios on herd-level profit was evaluated by applying prices and costs to the results. Prices and costs, in 2005 Swedish market prices and expressed in Euro (€1 = 9.35 Swedish Kronor (SEK) by 12 September 2007), are shown in Table 4. They were obtained from a web-service supplying economic information on Swedish agriculture (i.e. Agriwise, 2006).
Applied prices and costs

ECM = energy-corrected milk; SCC = somatic cell count; SFU = Scandinavian feed unit; AI = artificial insemination.
Net return was calculated as the total revenue from the dairy herd net of variable costs for cows and replacements. Variable costs included feed, artificial insemination, CM and other costs. Labour and management costs were generally not included as variable costs. The farmer does, however, administer some of the CM treatment and the additional labour requirement (i.e. the opportunity cost of the farmer’s time), assumed to be 2 h per case, was included in the cost per case. The cost per case of CM also included veterinary costs and the cost of antibiotics, priced at €101 (A. Persson, personal communication). The cost per case was thus €133. The effects of CM on production and culling were mediated through the yield-loss patterns and by culling induced by reduced production. Milk from cows treated with antibiotics was not fed to calves, and hence was not given an alternative value. The interest rate of herd value, representing capital costs for the herd investment, was 7% per year (Agriwise, 2006).
Results
Consequences of reducing the incidence of CM
Herd-level effects of a reduction in CM incidence were examined using the new method for modelling yield losses and the yield potential of mastitic cows as the reference when yield losses were estimated. The default herd was one with an average level of production and average reproductive performance.
Technical results
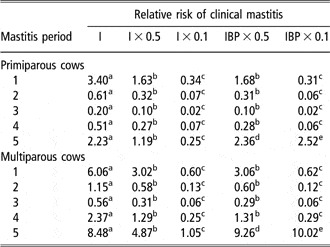
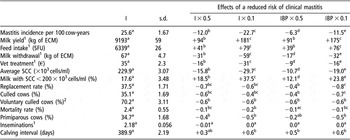
The incidence of CM per 100 cow-years in the different mastitis periods (cow-year was calculated as the number of feeding days divided by days in the year), expressed as the average of 250 replicated simulations, given the initial relative risk of CM and when that risk was reduced either throughout the entire lactation or for the period before peak yield, is shown in Table 5. Total incidence of CM in the herd is recorded in Table 6, together with various outcome variables describing the herd given different risks of CM.
Incidence of clinical mastitis per 100 cow-years in the mastitis periods given different relative risks of clinical mastitis. Different superscripts within rows indicate significantly different incidences (P < 0.05).

I = initial risk; IBP = initial risk before peak yield.
The results, which are valid in a herd with an average level of production and average reproductive performance, were estimated using the new method to model yield losses and the potential yield of mastitic cows as the reference when yield losses were estimated.
Technical results given the initial relative risk of clinical mastitis and when that risk was reduced. Different superscripts within rows indicate significant differences between the results achieved given different risks of clinical mastitis (P < 0.05).

I = initial risk; IBP = initial risk before peak yield; ECM = energy-corrected milk; SFU = Scandinavian feed unit; SCC = somatic cell count.
The results, which are valid in a herd with an average level of production and average reproductive performance, were estimated using the new method to model yield losses and the potential yield of mastitic cows as the reference when yield losses were estimated.
1Per cow-year.
2Out of all culled cows.
When the risk of CM was reduced to 50% of the initial relative risk the reduction in total CM incidence was half of that observed when the CM risk was reduced to 10% of the initial risk. The incidence of CM was reduced to almost the same extent when the risk of CM throughout lactation was halved and when the risk before peak yield was reduced to 10% of the initial risk. The amount of withdrawn milk and the costs of veterinary treatment showed a similar pattern.
There was no significant difference between the increase in either production or feed intake when the initial relative risk of CM was halved throughout lactation or halved solely before peak yield. The same finding was made when the relative risk was reduced to 10% of the initial risk. The average production per cow-year increased by 1% when the initial relative risk of CM was halved throughout lactation and by 2% when it was reduced to 10% of the initial risk. The average yield loss per case of CM was 797 kg of ECM, calculated by dividing the increase in production when the risk of CM was reduced to 10% of the initial relative risk by the corresponding reduction in CM incidence per cow-year.
A reduced relative risk of CM had a marked effect on both the average SCC of the milk produced in the herd (delivered and discarded) and the proportion of milk that had a SCC of less than 200 000 cells/ml. The proportion of milk with a SCC below 200 000 cells/ml increased by almost 40 percentage units when the risk of CM was reduced to 10% of the initial relative risk throughout lactation.
A small, but significant, reduction in replacement rate was observed when the relative risk of CM was decreased. It was attributable principally to a decrease in the proportion of culled cows, but also, to some extent, to a reduced mortality rate. A corresponding reduction in the proportion of primiparous cows therefore occurred. Another effect of lowered relative risk of CM was that the proportion of culled cows designated for culling on a voluntary basis was slightly reduced.
Economic results
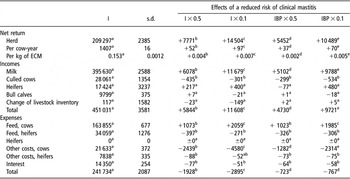
The impact of CM risk on herd-level profit is presented in Table 7.
Annual economic results (€) given the initial relative risk of clinical mastitis and when that risk was reduced. Different superscripts within rows indicate significant differences between the results achieved given different risks of clinical mastitis (P < 0.05).

I = initial risk; IBP = initial risk before peak yield; ECM = energy-corrected milk.
The results, which are valid in a herd with an average level of production and average reproductive performance, were estimated using the new method to model yield losses and the potential yield of mastitic cows as the reference when yield losses were estimated.
A reduction in the risk of CM to 10% of the initial relative risk throughout the lactation increased the net return by 6.9%. Reducing the risk of CM before peak yield to 10% of the initial relative risk gave a higher net return at herd level than did halving the initial relative risk throughout lactation. The smallest effect on net return was observed when the initial relative risk of CM before peak yield was halved.
The higher net return achieved when the initial relative risk of CM was reduced was primarily due to increased income. The increased income from milk sales derived mainly from higher milk yield, but also from the rise in milk price that the lower average SCC in the milk secured.
The maximum avoidable cost of CM in a herd of 150 cows was estimated at €14 504. Expressed per cow-year, the maximum avoidable cost of CM was €97. The cost per case of CM in Sweden today is thus €428 (calculated by dividing the maximum avoidable cost per cow-year by the reduction in incidence when the risk of CM was reduced to 10% of the initial relative risk).
Different types of herd
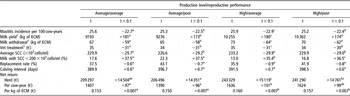
The consequences of reduced CM incidence were studied in four types of herd, defined by production level and reproductive performance, in order to investigate the possibility of significant interactions between herd type and technical and economic results given different risks of CM. The most important results achieved in the different herds, given the initial relative risk of CM and when that risk was reduced by 90%, are presented in Table 8.
Annual technical and economic results achieved in different types of herd given the initial relative risk of clinical mastitis and when that risk was reduced by 90%. Different superscripts within rows indicate significant differences between the effects of a reduction of the initial relative risk by 90% in different types of herd (P < 0.05).

I = initial risk; ECM = energy-corrected milk; SCC = somatic cell count.
Results were estimated using the new method to model yield losses and the potential yield of mastitic cows as the reference when yield losses were estimated.
1Per cow-year.
The changes obtained in both technical and economic results after reducing the risk of CM to 10% of the initial relative risk were estimated to be of the same magnitude irrespective of herd type. The cost per case of CM was also similar in all types of herd.
Effects of strategy for modelling yield losses
The importance of the choice of strategy for modelling yield losses was investigated by comparing the new and the conventional method in combination with two different reference levels for yield in healthy cows when estimating yield losses: own and no-CM.
Technical results
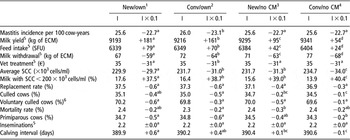
The estimated response to a reduction in the risk of CM to 10% of the initial relative risk was similar for all technical results, except for milk yield and feed intake, irrespective of the method used for modelling yield losses and the choice of reference level when estimating yield losses (Table 9).
Effects of the method used for modelling yield losses, and of the chosen reference level when yield losses were estimated, on technical results. Different superscripts within rows indicate significant differences between the different methods as regards the effects of reducing the initial relative risk of clinical mastitis (P < 0.05).

CM = clinical mastitis; I = initial risk; ECM = energy-corrected milk; SFU = Scandinavian feed unit; SCC = somatic cell count.
Results are valid in a herd with an average level of production and average reproductive performance. Results given the initial relative risk of clinical mastitis and after that risk was reduced by 90% are shown.
1New/own = new method and potential yield of mastitic cows as reference.
2Conv/own = conventional method and potential yield of mastitic cows as reference.
3New/no CM = new method and yield level of non-mastitic cows as reference.
4Conv/no CM = conventional method and yield level of non-mastitic cows as reference.
5Per cow-year.
6Out of all culled cows.
The average yield loss per case of CM largely depended on the choice of method for modelling yield losses and the reference level for yield in healthy cows. The new method combined with own as the reference level resulted in the highest average yield loss per case, at 797 kg of ECM. The conventional method in combination with no-CM as the reference level gave the lowest average yield loss per case, at 239 kg of ECM. The conventional method with own as reference and the new method with no-CM as reference resulted in yield losses of 695 and 420 kg of ECM, respectively.
Economic results
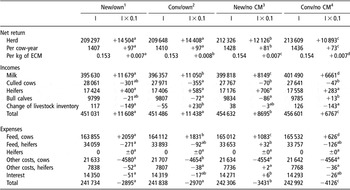
The method for modelling yield losses had a limited impact on the changes in economic results seen following a reduction in the risk of CM to 10% of the initial relative risk (Table 10). The differences between the results obtained using the new and the conventional method were especially small when own was used as the reference.
Effects of the method used for modelling yield losses, and of the chosen reference level when yield losses were estimated, on annual economic results (€). Different superscripts within rows indicate significant differences between the different methods as regards the effects of reducing the initial relative risk of clinical mastitis (P < 0.05).

CM = clinical mastitis; I = initial risk; ECM = energy-corrected milk.
Results are valid in a herd with average level of production and average reproductive performance. Results given the initial relative risk of clinical mastitis and after that risk was reduced by 90% are shown.
1New/own = new method and potential yield of mastitic cows as reference.
2Conv/own = conventional method and potential yield of mastitic cows as reference.
3New/no CM = new method and yield level of non-mastitic cows as reference.
4Conv/no CM = conventional method and yield level of non-mastitic cows as reference.
Table 11 illustrates how the estimated cost per case of CM was affected by the choice of method for modelling yield losses and the reference level for yield in healthy cows. The cost was highest when the new method was combined with own as the reference level for yield in healthy cows. The lowest cost per case was obtained using the conventional method of modelling yield losses together with no-CM as the reference level when yield losses were estimated.
Cost per case of clinical mastitis (€) in different types of herd

CM = clinical mastitis.
Costs were estimated using two different methods to model yield losses in combination with two different reference levels for yield in healthy cows when yield losses were estimated.
1New/own = new method and potential yield of mastitic cows as reference.
2Conv/own = conventional method and potential yield of mastitic cows as reference.
3New/no CM = new method and yield level of non-mastitic cows as reference.
4Conv/no CM = conventional method and yield level of non-mastitic cows as reference.
Discussion
Validation of the parameterization of the model
Total CM incidence in the initial relative risk situation was 25.6 per 100 cow-years. This figure corresponds well with the incidence of 25.0 per 100 cow-years in the research herd described by Hagnestam et al. (Reference Hagnestam, Emanuelson and Berglund2007), from which the risks in the present study were derived. Total CM incidence was considerably higher than the incidence of 16.2 per 100 cow-years reported by Swedish veterinarians in 2004/05 (Swedish Dairy Association, 2005a). The reported incidence of CM in Sweden has, however, been found to be 16% lower than the incidence of vet-treated CM reported by farmers (M. Mörk, A. Lindberg, S. Alenius, I. Vågsholm, A. Egenvall, unpublished results). The modelled incidence in this study therefore seems to correspond relatively well with actual incidence.
Average yield loss per case of CM was estimated at 797 kg of ECM. This figure is well within the range of yield loss estimated by Hagnestam et al. (Reference Hagnestam, Emanuelson and Berglund2007), and the three-line spline functions appear, therefore, to express the yield loss caused by CM accurately.
Consequences of reducing the incidence of CM
Technical results
The reduction in total CM incidence observed when the initial relative risk of CM was reduced solely before peak yield was half that obtained when a similar reduction was imposed throughout lactation. Moreover, there was no significant difference between the increase in milk yield per cow-year achieved when the initial relative risk of CM was reduced solely before peak yield and the corresponding increase achieved when the relative risk of CM was reduced throughout lactation. The net return per cow-year did, however, respond differently; a reduction in the initial relative risk of CM solely before peak yield, rather than throughout lactation, gave a significantly lower increase in the net return per cow-year. These findings indicate that quite a large effect on the technical results can be achieved by concentrating preventive measures on the first 8 weeks of lactation; they also indicate that if the aim is to maximize net returns per cow-year, the risk of CM should be reduced throughout lactation.
The average SCC of the milk produced was significantly affected by the risk of CM. The reduction in incidence thus brought about a considerable improvement in milk quality, and this was reflected in a €0.003 higher price per kg of ECM.
Reduction in the incidence of CM caused a somewhat reduced replacement rate, and the proportion of voluntary culled cows was also slightly reduced. When fewer cows developed CM, the average milk yield per cow-year increased. Higher milk yield qualified cows for a longer insemination period, fewer cows qualified for voluntary culling, and the cows remained in the herd longer. The lowered replacement rate was thus, at least to some extent, an effect of the chosen modelling strategy. It could certainly also be justified, in practice, following reduced risk of CM, but an alternative scenario is that the farmer would employ the culling marginal to displace low-yielding cows or cows with health problems in order to maximize net herd-returns. The effect of a reduction in CM incidence on the replacement rate might not, therefore, be observed in dairy herds.
Economic results
The maximum avoidable cost of CM in a 150-cow Swedish dairy herd with an average level of production and average reproductive performance was estimated at €14 504. This is a high figure, corresponding to 6.9% of the net return achieved given the initial relative risk of CM. Maximum avoidable cost on herd level expresses maximum expenditure on preventive measures per year. Given the interest rate and depreciation period, the annuity method can be used to calculate the maximum investment that can be made to prevent CM. In the present study, we used an interest rate of 7%/year. With an assumed depreciation period of 10 years, and given that the risk of CM is reduced to 10% of the initial relative risk, €100 000, corresponding to approximately 10% of the investment volume for a 150-cow free-stall barn with milking parlour (Agriwise, 2006), can be invested in new techniques or be used to improve management routines in the herd. Another way to express the maximum avoidable cost of CM is to say that €14 504 equates to 2.3 h additional labour per day (at a cost of €17.5/h, Agriwise, 2006). This is labour that could of course be spent on preventive work in the herd.
The cost per case of CM was estimated at €428 per case. Estimates from other European studies that have been published within the last 10 years and include the cost of increased risk of culling in the cost of CM can now be compared. Before any comparisons are made, however, it should be noted that these studies relate to different populations, refer to different points in time, define CM differently, evaluate effects on production differently, have used different producer prices and, perhaps most importantly, have applied different methods of economic assessment. Comparisons are therefore problematic and can only be made to place our estimates in a wider context. All results have been transformed to the price level of 2005 using consumer price indices (Organization for Economic Co-operation and Development, 2007). British Pounds Sterling have then been converted to Euros (exchange rate of 12 September 2007) to facilitate comparison of results expressed in different currencies.
In a UK study, Kossaibati and Esslemont (Reference Kossaibati and Esslemont1997) estimated the cost per case of CM (of average severity) at €313 using partial budgeting. Yalcin (Reference Yalcin2000), also using partial budgeting, calculated the cost per case of mastitis (subclinical and clinical) in Scotland at €234. In a Danish stochastic simulation study (Østergaard et al., Reference Østergaard, Chagunda, Friggens, Bennedsgaard and Klaas2005), a cost per case of CM of €347 was arrived at, assuming that subclinical cases are a natural part of clinical cases. Based on a deterministic model, Huijps et al. (Reference Huijps, Lam and Hogeveen2008) reported a cost per case of CM that varied between €159 and €229 depending on month of lactation in which CM occurred. The cost per case of CM in the present study was high relative to these estimates. The main component of economic loss caused by CM is reduced milk yield (Degraves and Fetrow, Reference Degraves and Fetrow1993; Kossaibati and Esslemont, Reference Kossaibati and Esslemont1997; Seegers et al., Reference Seegers, Fourichon and Beaudeau2003). Loss in production in the present study was on average 797 kg of ECM per case. Kossaibati and Esslemont (Reference Kossaibati and Esslemont1997) reported a yield loss of 247 l for mild cases and 450 l for severe cases. Østergaard et al. (Reference Østergaard, Chagunda, Friggens, Bennedsgaard and Klaas2005) estimated yield loss at 392 kg of ECM. Yalcin (Reference Yalcin2000) attributed the entire yield loss caused by mastitis to subclinical cases and hence did not present an estimate that could be used for comparison. The high yield loss in the present study partly explains the high cost per case of CM, but it is probably not the whole explanation. The proposed new strategy to model yield losses was certainly an important factor in the high cost per case found in the present study. When the more conventional approach was used in combination with no-CM as reference for the yield level in healthy cows, a cost of €322 per case was obtained. The conventional approach produced a yield loss of on average 239 kg of ECM per case. These results are in line with what might be expected; the scenario giving rise to the most extensive yield losses also caused the highest cost per case. The new methodology is more appealing from a biological perspective, and it is likely that the higher cost per case of CM obtained in the present study is closer to the actual cost.
The entire effect of mastitis on herd results was mediated through clinical cases. Subclinical cases were not accounted for, as no direct association between SCC and milk yield was modelled. The cost of mastitis resulting from this study therefore applies exclusively to CM, although it has been shown (Yalcin, Reference Yalcin2000) that subclinical cases are responsible for a large proportion of the economic loss caused by mastitis. Therefore, to fully examine the impact of mastitis on the profitability of a dairy herd, the effects of subclinical mastitis need to be accounted for in future studies.
Different types of herds
Net herd-return was affected more by the production level than by the reproductive performance. No direct effects of CM on oestrus detection, conception rate or abortion were modelled, however. Had a relationship between CM and these reproductive traits been included, a more pronounced effect on reproduction would most certainly have been observed. From this study, it is clear that it is of great importance to specify the yield level of the cows properly when one is evaluating the economic consequences of CM. It is likely that reproduction also plays an important role in determining CM costs, although this was not explicitly investigated in the present study. The different herd types behaved similarly, regarding changes in both technical and economic results, when the initial relative risk of CM was altered. The simulated results therefore appeared to be stable irrespective of production level and reproductive performance, and no obvious interactions between herd type and reaction to a reduction in the initial relative risk of CM could consequently be detected in any of the technical or economic outcome variables. No herd characteristic that might be used to single out herds that would have higher or lower economic gain following a reduction in their incidence of CM could thus be identified. Halasa et al. (Reference Halasa, Huijps, Osteras and Hogeveen2007) proposed that large discrepancies between herds with respect to economic damage caused by a case of CM might be due to different management strategies, among other factors. In the present study, the cost per case of CM was found to be about the same in all types of herd, suggesting that management strategy, at least within the simulated ranges of production level and reproductive performance, does not affect the economic loss associated with a case of CM.
Effects of strategy for modelling yield losses
Among the technical results in Table 9, only the effect on milk yield per cow-year (and consequently feed intake) after reduction in the initial relative risk of CM was markedly affected by the modelling strategy. The method for modelling yield losses and the reference level for yield in healthy cows also affected the increase in net returns following a reduction in the initial relative risk of CM. No substantial differences in the other outcome variables were found.
Average yield losses per case of CM largely depended on the modelling strategy. Estimates of average yield loss based on the new method in combination with own as the reference level were more than three times as high as those based on the conventional method and using no-CM as the reference. This finding was anticipated, because the majority of the CM cases were modelled to occur in early lactation and the new strategy modelled severe yield losses during the same time period.
There were no major discrepancies between new and conventional modelling regarding the response to a reduced risk of CM. This was a surprising result, since the amount of detail in the modelling strategies differed considerably. The present study suggests that the conventional way to model yield losses, i.e. using one yield-loss pattern irrespective of when, in lactation, CM occurs, is good enough, and that no additional effort needs to be put into deriving lactation-week-specific yield-loss patterns. The similarity in the results obtained using the two methods was especially pronounced when the reference level for yield in healthy cows was own. The yield level of mastitic cows, had they not developed CM, is also the most correct reference level to use from a biological point of view, as it accounts for the higher initial production in cows that later develop CM. In the foreseeable future, it should be used in decision support systems.
Conclusions
The yearly maximum avoidable cost of CM in a Swedish dairy herd with 150 cows was estimated at €14 504, a figure corresponding to 6.9% of the net return given a CM incidence of 25.6 per 100 cow-years. Expressed per cow-year, the maximum avoidable cost was €97. The cost per case of CM was estimated at €428. No interaction between herd type and the response to a reduction in the initial relative risk of CM was found. All herd types, irrespective of production level and reproductive performance (at least within the simulated ranges), can thus be assumed to be equally affected by a reduction in the relative risk of CM. There were no major differences between the results obtained using specific yield-loss patterns for different periods in lactation and the results obtained using one yield-loss pattern irrespective of the lactational timing of CM, except with respect to average yield loss per case of CM and the cost per case of CM. The similarities between the results obtained using the two methods were particularly evident when the mastitic cows’ own yield level, had they not developed CM, was used as reference for production in healthy cows when yield losses were estimated.
Acknowledgements
The Swedish Farmers’ Foundation for Agricultural Research is acknowledged for having supported this study financially. We would like to thank Hans Andersson, Britt Berglund, Ulf Emanuelson and Erling Strandberg for valuable comments on the manuscript.