Introduction
Vertebrates utilizing powered flight have inherently limited morphological disparity in forelimb morphology. There have been several examinations of variation in forelimb morphology in birds and direct links to flight ability or style (e.g., Wang et al. Reference Wang, McGowan and Dyke2011; Hieronymous Reference Hieronymous2015; Serrano et al. Reference Serrano, Chiappe, Palmqvist, Figueirido, Marugán-Lobón and Sanz2018). The avian hind limb, however, shows overall greater disparity (Gatesy and Middleton Reference Gatesy and Middleton1997) as compared to the forelimb (Middleton and Gatesy Reference Middleton and Gatesy2000). Avian hind limbs show demonstrable direct links to ecology (Bell and Chiappe Reference Bell and Chiappe2011) and life habit (DeGrange Reference DeGrange2017); however, these studies focus primarily on the long bones of the hind limb (femur, tibiotarsus, and tarsometatarsus) and not on the digits. There have been studies that examine the link between pedal phalanges and arboreality (e.g., Hopson Reference Hopson, Gauthier and Gall2001), which suggest that arboreal birds show elongation of the distal pedal phalanges, and shortening of the proximal ones (Hopson Reference Hopson, Gauthier and Gall2001; Dececchi and Larsson Reference Dececchi and Larsson2011; Fowler et al. Reference Fowler, Freedman, Scannella and Kambic2011; O'Connor et al. Reference O'Connor, Chiappe, Gao and Zhao2011); however, detailed examination of total digit length to ecology, life habit, and avian foot morphotype has not been examined. This paper examines both long bones and digits of the avian hind limb to determine whether avian feet are as evolutionarily plastic as the long bones in the hind limb and whether any link between ecology, morphology, and phylogeny exists in both the feet and hind limb of birds.
Previous studies have used a wide variety of ecological “bins” to group modern and fossil birds; however, it is important to keep in mind that these studies did not consider all of the exact same components and measurements. Bins have ranged from foraging habits (terrestrial, wing-powered, arboreal, aquatic; Bell and Chiappe Reference Bell and Chiappe2011) to habitat groups (aerial, ground, raptorial [bird of prey], tree [arboreal], swimmer, wader; Zeffer et al. Reference Zeffer, Johansson and Marmebro2003) to functional groups (flightless, various types of hind limb swimmer, cursorial, raptorial, pelagic soarer, arboreal, wing-propelled swimmer, hyperaerial; Habib and Ruff Reference Habib and Ruff2008). In some cases there is overlap between these groups (e.g., foraging and functional groups both contain a terrestrial/ground group), which may lead to confusion; furthermore, it is vital to prevent assigning functional traits to habitat groups, or vice versa, when focusing specifically on one of these parameters (e.g., habitat groups containing a “birds of prey” category).
One difficulty that arises when placing birds into ecological or other groups is the wide variety of locomotor types or life habits that a single species may perform (DeGrange Reference DeGrange2017). For example, “arboreal” is often used as an ecological category, but many birds spend some period of time in trees. Wild turkeys (Meleagris gallopavo), for example, will roost in trees and may in fact rely on these roosting habitats for survival (e.g., Mackey Reference Mackey1984); however, no one would argue that a wild turkey belongs in an arboreal group. Establishment of particular categories to use in a study should be based on the bird's primary method of performing whatever is under study (locomotion, etc.). Glen and Bennet (Reference Glen and Bennet2007) divide birds that spend time in both trees and on the ground into distinct categories; we have generally followed this suggestion with a few modifications (see “Data and Methods”).
Recent advances in molecular phylogenetic methods have allowed for a highly resolved whole-genome phylogeny of extant birds (e.g., Jarvis et al. Reference Jarvis, Mirarab, Aberer, Li, Houde, Li and Hou2014; Prum et al. Reference Prum, Berv, Dornburg, Field, Townsend, Lemmon and Lemmon2015); morphological trees have also been produced, though less frequently (Livezey and Zusi Reference Livezey and Zusi2007; Myer Reference Myer2008), with calls for further integration of molecular and morphological trees (Xu et al. Reference Xu, Zhou, Dudley, Mackem, Chung, Erickson and Varricchio2014) to aid in better understanding of the early evolution of birds. However, mapping ecologies onto avian phylogeny, which has been practiced in other groups (sensu Lamsdell et al. Reference Lamsdell, Congreve, Hopkins, Krug and Patzkowsky2017), has not been performed. Ecology has been taken into account while building phylogenies (e.g., Burin et al. Reference Burin, Kissling, Guimarães, Şekercioğlu and Quental2016); however, this is not the same as mapping ecologies directly onto a phylogenetic tree. Here, we explore the distribution of both avian ecology and foot morphotype on a composite phylogeny composed of a broad sample of living and extinct birds. We then use this framework to examine patterns of ecological and morphological convergence, with a particular focus on any discordance between ecological and morphological patterns.
Data and Methods
We combined both fossil and modern avian skeletal material in this study; modern skeletal material was accessed from the University of Kansas Natural History Museum and the University of Michigan Natural History Museum. Fossil skeletal material was measured from the literature or accessed at the Institute of Vertebrate Paleontology and Paleoanthropology, the Dalian Museum of Natural History, and the Paleontological Museum of Liaoning, all in China.
A total of 21 measurements were taken on every specimen used in the study; some specimens had 30 or more different measurements taken; however, the most useful measurements are those shown in Figure 1. Measurements to the nearest 0.01 mm were taken using digital calipers. Measurements of both articulated and disarticulated feet and hind limbs could be taken, although disarticulated phalanges provided more accurate data. Those feet that were disarticulated were reconstructed, and each toe length was measured with the bones rearticulated. If a toe was articulated and curled, and could not be straightened, the individual phalanx lengths were added together to get a more accurate measurement than the curled-toe length.
Measurements taken on all modern and fossil specimens. Dashed gray lines represent extent of lengths. Abbreviations: Lofem, length of femur; Lott, length of tibiotarsus; Lotmt, length of tarsometatarsus.

Avian species were placed into two categories: one based on foot morphology, the other based on general ecology and life habit (Table 1). Species were also grouped by taxonomic family for a third analysis to test for phylogenetic impact on morphology. Foot morphologies are described later in this section. A species’ ecology was based on its primary life habit; many birds experience some degree of overlap in their ecological niches. Remember that organisms have a wide range of conditions and habitats that they can and do tolerate. Niche breadth explicitly refers to the range of habitats occupied, geographic ranges, habitat resources utilized, and the range of environmental tolerances that a species expresses (Sexton et al. Reference Sexton, Montiel, Shay, Stephens and Slatyer2017). Miles (Reference Miles1990) reported temporal variation in the niche of foraging birds in the North American desert Southwest, and more recently Hall et al. (Reference Hall, Braham, Nolan, Conley, Brandt, Mendenhall, Lanzone, McGann and Katzner2019) have shown that California condors exhibit not only a seasonal variation in the intensity of foraging ground site use but also a wide diversity in land cover among utilized ground sites, despite a general proclivity for favoring open cover on steep slopes. These observations all provide further support of the need for an understanding of the differences between primary and secondary ecology in birds. We explicitly base our ecotypes on a unique combination of behavioral and environmental conditions that reflect the primary ecology of the bird. That is not to say, of course, that a foot-propelled diver does not swim on the surface, or walk (poorly) on land, or fly. Most birds (with the notable exception of swifts, which have very small and weak legs; Worth Reference Worth1943) walk on land at some point, regardless of how ungainly they may be. This does not mean that all birds should be classified as “ground birds,” as this would not be considered the primary ecology of many birds. Instead, we focus on the primary method of foraging, hind limb locomotion, or a combination of those two concepts. As the avian hind limb is often used for both of these functions regularly, it is important to consider both foraging and locomotion when determining ecotypes.
Ecotypes used in this study and their definitions. Classifications are based on primary ecological uses of the foot. While many birds exhibit a number of uses of the foot and hind limb, our definitions are based on the most commonly used habitats and functions. Definitions were based strictly on hind limb use, which may conflict with other ecological definitions of some species. For example, although Cepphus columba is considered a diving bird, it swims underwater using its wings; feet are used only in surface swimming. Similarly, Pelecanus species are known to dive from heights to swim; however, Pelecanus erythrorhynchos is a surface swimmer (Eliott Reference Elliott, Hoyo, Elliott and Sargatal1992).

Many avian species are classified with an anisodactyl foot morphotype, which results in lumping a large amount of significant variation into this morphotype. This lumping is often less of an issue in unique morphologies such as zygodactyl or totipalmate, where the degree of variation is much less. This paper presents a series of subcategories within the anisodactyl morphotype in order to reflect the high degree of variation among anisodactyl birds. These new morphotypes include euryanisodactyl (incumbent anisodactyl feet with a wide angle [~100 degree] of divarication between toes II and IV), mesanisodatyl (traditional or incumbent anisodactyl feet with a medium [~90 degree] angle of divarication), and stenanisodactyl (anisodactyl feet with a long hallux and a narrow [~30 degree] angle of divarication).
Ecological groups were determined primarily by mode of locomotion or feeding habit. These include subaqueous saturated sediment foragers (commonly thought of as “waders”), saturated sediment foragers (commonly thought of as “shorebirds”), non-climbing arboreal birds (“perching” birds), swimmers (specifically surface swimmers), foot-propelled divers, climbers, ground birds, predominantly ground foragers, and birds of prey (Table 1). Birds of prey are defined as raptorial hunters that primarily use feet to bind or strike prey in the air. The differentiation between subaqueous saturated and saturated sediment foragers was determined based on the primary foraging habits of these birds; while a subaqueous saturated sediment forager will spend time out of the water foraging (e.g., a heron walking along a lakeshore), the majority of its time is spent with its feet and legs partially or wholly submerged in water as it forages. This may result in birds traditionally categorized as “shorebirds” (e.g., Numenius) being reclassified in this paper as subaqueous saturated sediment foragers, due to their habits of foraging in deeper waters of lagoons and tidal flats.
Principal component analysis (PCA) was carried out in the core functions of R (R Core Team 2018) with phylogenetic principal component analysis (PPCA) implemented through phytools (Revell Reference Revell2012). Permutational multivariate analysis of variance (PERMANOVA) was carried out in PAST (Hammer and Harper Reference Hammer and Harper2005). Data was log adjusted to account for size bias. Three different analyses were carried out using the three categories of foot morphotype, ecological bin, or taxonomy.
The sampled species were placed into a phylogenetic hypothesis compiled from several source trees representing the most recent and comprehensive treatment of avian relationships combined with detailed analyses of constituent clades. The molecular analysis of Jarvis et al. (Reference Jarvis, Mirarab, Aberer, Li, Houde, Li and Hou2014) was used to form the backbone of the phylogeny, with finer-scaled analyses informing the internal topology of Gruiformes (Garcia-R et al. Reference Garcia-R, Gibb and Trewick2014), Anseriformes (Sun et al. Reference Sun, Pan, Hu, Sun, Ding, Wang and Zhang2017), Charadriiformes (Baker et al. Reference Baker, Pereira and Paton2007; Pereira and Baker Reference Pereira and Baker2008; Gibson and Baker Reference Gibson and Baker2012; Barth et al. Reference Barth, Matschiner and Robertson2013), and Passeriformes (Mackiewicz et al. Reference Mackiewicz, Urantówka, Kroczak and Mackiewicz2019). The placement of Mesozoic birds follows O'Connor et al. (Reference O'Connor, Wang, Chiappe, Gao, Meng, Cheng and Liu2009) and Wang et al. (Reference Wang, O'Connor, Zheng, Wang, Hu and Zhou2014, Reference Wang, O'Connor, Pan and Zhou2017). To determine the degree of phylogenetic signal in the distribution of foot morphotypes and avian ecologies, Fritz and Purvis's (Reference Fritz and Purvis2010) D was estimated for each trait using the phylo.d function in R (R Core Team 2018) implemented through the package caper (Orme et al. Reference Orme, Freckleton, Thomas, Petzoldt, Fritz, Isaac and Pearse2013). Values of D, estimated from 1000 permutations in which trait values are shuffled among the tips of the phylogeny to create a random distribution to compare with the observed distribution, are 1 if a trait distribution is random with respect to phylogeny and 0 if a trait exhibits a partially clumped distribution as expected under a Brownian motion model of evolution. Traits that are overdispersed result in a value of D greater than 1, while those that are extremely clumped result in a negative value. The degree of clumping or dispersal was determined for each morphotype and ecology.
Results
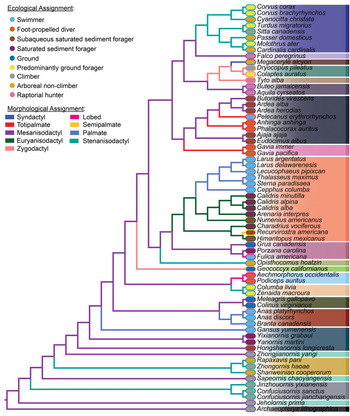
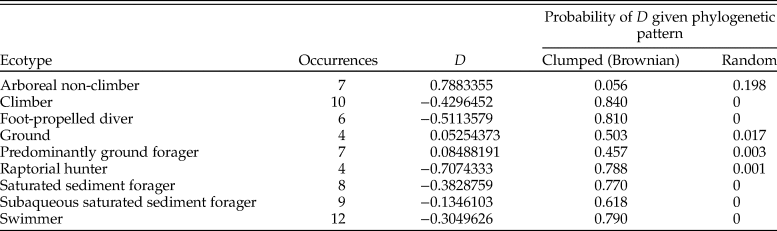
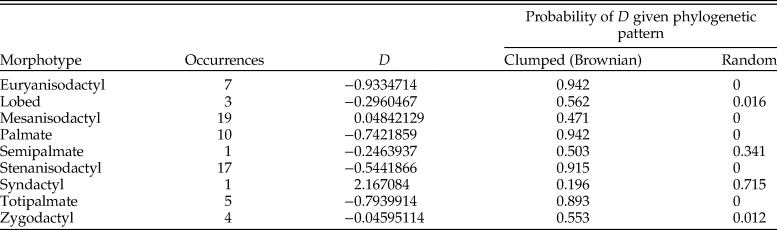
Foot morphotypes and ecological categories are unevenly distributed across the avian phylogeny (Fig. 2). The majority of ecologies have a negative D value (Table 2), indicating that they exhibit greater phylogenetic clustering than what would be normally expected from a Brownian model of evolution; however, the probability that these values are the result of Brownian evolution are still high, generally between 0.77 and 0.87, with the exception of the subaqueous saturated sediment forager ecotype with a probability of approximately 0.6. Notable exceptions are the ground and predominantly ground forager ecotypes, which have a D between 0.05 and 0.08, placing their distribution intermediate between what would be expected from a clumped Brownian and random distribution. The closest any ecotype comes to being overdispersed on the phylogeny are the arboreal non-climbers, with a D of almost 0.8. Arboreal non-climbers are, however, the only ecotype that may be explained by a random phylogenetic distribution, with all other ecotypes exhibiting a negligible probability of exhibiting a random distribution. Similar trends are apparent among foot morphotypes (Table 3), with all morphotypes exhibiting negative D values, except Mesanisodactyl (~0.05) and Syndactyl (>2). The probability of the observed morphotype distributions being random is negligible, except for in Semipalmate and Syndactyl species, each of which has a sample size of one. Despite the prevalence of negative D values among morphotypes, the probability that the clumped distribution is due to a Brownian mode of evolution is generally high (0.89–0.94), with the exception of the lobed (0.56), zygodactyl (0.55), and mesanisodactyl (0.47) morphologies.
Composite phylogeny of sampled avian species, compiled from Jarvis et al. (Reference Jarvis, Mirarab, Aberer, Li, Houde, Li and Hou2014), Garcia-R et al. (Reference Garcia-R, Gibb and Trewick2014), Sun et al. (Reference Sun, Pan, Hu, Sun, Ding, Wang and Zhang2017), Baker et al. (Reference Baker, Pereira and Paton2007), Pereira and Baker (Reference Pereira and Baker2008), Gibson and Baker (Reference Gibson and Baker2012), Barth et al. (Reference Barth, Matschiner and Robertson2013), Mackiewicz (Reference Mackiewicz, Urantówka, Kroczak and Mackiewicz2019), O'Connor et al. (Reference O'Connor, Wang, Chiappe, Gao, Meng, Cheng and Liu2009), and Wang et al. (Reference Wang, O'Connor, Zheng, Wang, Hu and Zhou2014, Reference Wang, O'Connor, Pan and Zhou2017). Hind limb morphology is indicated via coloring on the branches, while species ecological assignment is shown via coloring on the tips alongside the species name.

Phylogenetic signal in ecological categories for 67 bird species tested using the phylogenetic topology shown in Fig. 2.

Phylogenetic signal in ecological categories for 67 bird species tested using the phylogenetic topology shown in Fig. 2.

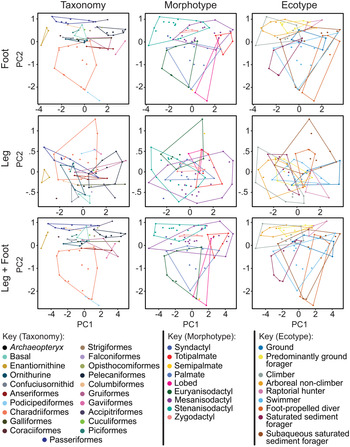
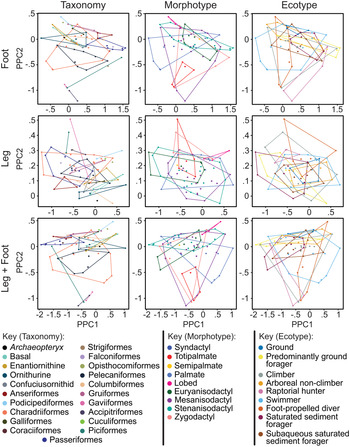
PCA is a common method of studying theoretical morphospace occupation in fossil birds (e.g., Bell and Chiappe Reference Bell and Chiappe2011; Anten-Houston et al. Reference Anten-Houston, Ruta and Deeming2017; DeGrange Reference DeGrange2017). In previous agricultural studies, PC 1 has been shown to correlate with overall body shape or form, dominated by size (e.g., Udeh and Ogbu Reference Udeh and Ogbu2011; Verma et al. Reference Verma, Sankhyan, Katoch and Thakur2015; Vohra et al. Reference Vohra, Niranjan, Mishra, Jamuna, Chopra, Sharma and Jeong2015). This suggests that PC 1 is tightly linked to overall body size in this analysis, which has been observed in other studies of fossil birds that use PCA (Hopson Reference Hopson, Gauthier and Gall2001; Bell and Chiappe Reference Bell and Chiappe2011). PC 1 loadings were all very similar, suggesting a linear relationship most likely linked to body size, as previously reported (Bell and Chiappe Reference Bell and Chiappe2011). This link to body size was supported by great distance between small birds (e.g., Sitta canadensis) and large birds (e.g., Grus canadensis) along the PC 1 axis (Fig. 3). This link to body size was also supported by the results of the PPCA (Fig. 4). We therefore focus more attention on PC 2 and PC 3 in all analyses, as they contain pertinent evolutionary information.
Theoretical morphospace plots for PC 1–PC 2 of the foot only (top), leg only (middle), and whole hind limb (bottom). Species were grouped by taxonomy (left), foot morphotype (middle), and ecology (right). PC 1 is strongly influenced by body size; the species farthest to the left are the ones with the smallest limbs (e.g., enantiornithines, Sitta canadensis, Megaceryle alcyon.) Note that the hind limb–only analysis shows little clustering or distinct separation between groups, outside of enantiornithines in the taxonomy plot. This is especially true when looking at morphotype, which stands to reason, as the morphotype is based strictly on the structure of the digits and does not factor in any of the three hind limb elements. This suggests a decoupling of the foot and hind limb elements.

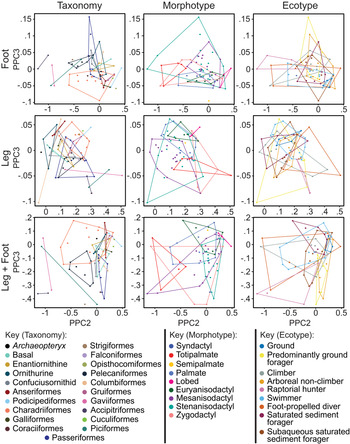
Theoretical morphospace plots for PPC 1–PPC 2 of the foot only (top), leg only (middle), and whole hind limb (bottom). Species were grouped by taxonomy (left), foot morphotype (middle), and ecology (right). PPC 1 is still strongly influenced by body size, though there seems to be some decoupling as body size is, to some extent, correlated with phylogeny.

Toe Length-Only Analysis
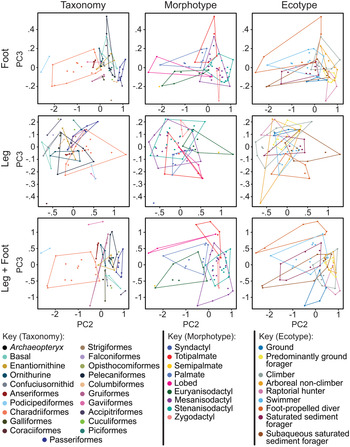
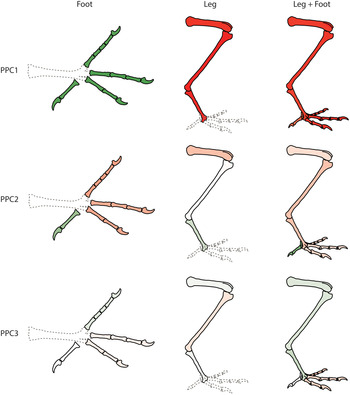
PC 1 values are all positive and account for 75.2% of the variation in the data. Species on the positive side of the axis show longer overall toe lengths, and species on the negative side show smaller overall toe lengths. PC 2 and PC 3 combined for 24.5% of the variation in the data. A positive PC 2 value reflects the presence of a robust hallux (digit I) (Fig. 5), and a negative PC 2 value suggests that toe I is relatively small or reduced in size; this would suggest that digits II–IV are more developed. A positive PC 3 value reflects the presence of a robust toe IV (Fig. 5). This is reflected in the scatter plots, where non-climbing arboreal birds are found clustered on the right side of the PC 2 axis, and shorebirds, palmate birds, and foot-propelled divers are clustered on the left (Fig. 5). Euryanisodactyl feet trend positive on both the PC 2 and PC 3 axes. Mesanisodactyl feet straddle both sides of the PC 2 axis, but are only found on the positive side of the PC 3 axis. Lobed-footed birds form a wide triangle that overlaps with eury- and mesanisodactyl. Totipalmate birds trend strongly positive along the PC 3 axis, but slightly straddle the PC 2 axis, with most totipalmate birds falling on the positive side of the axis. Zygodactyl birds are on the positive side of the PC 2 axis, but most trend weakly negative along the PC 3 axis, except for Tyto alba, which is strongly negative. Interestingly, the only syndactyl bird (Megaceryle) is found within the cluster of basal birds. Stenanisodactyl birds are generally strongly positive along the PC 2 axis, and straddle the PC 3 axis, though the majority of species are found on the negative side.
Theoretical morphospace plots for PC 2–PC 3 of the foot only (top), leg only (middle), and whole hind limb (bottom). Species were grouped by taxonomy (left), foot morphotype (middle), and ecology (right). These show more distinct groupings, though the leg-only analysis still shows a great deal of overlap, especially when specimens are grouped by morphotype. Note the extreme outlier position of Megaceryle alcyon in the negative quadrant of the leg-only scatter plots. This results in a dramatic increase in morphospace occupation when this species is included in non-climbing arboreal birds.

When examining the ecological groupings, some clear delineations within mesanisodactyly appear. Subaqueous saturated sediment foragers and ground birds (both considered mesanisodactyl) show some significant overlap; however, raptorial hunters (also considered mesanisodactyl) are largely isolated (Fig. 5). Arboreal non-climbing birds cover a significantly larger area of the morphospace than simple stenanisodactyl birds, due to the inclusion of the syndactyl Megaceryle. Swimming birds, which include both palmate birds and totipalmate birds, cover a large portion of the morphospace that remains largely negative along the PC 2 axis and evenly distributed across PC 3. This group shows significant overlap with foot-propelled divers and both subaqueous saturated sediment and saturated sediment foragers.
Taxonomically there are some interesting trends. Archaeopteryx, confuciusornithids, and basal ornithurines plot near the center of the morphospace, while basal birds are found both in the center of the morphospace and expand toward the negative side of the PC 2 axis. Enantiornithines cluster exclusively on the negative side of the PC 2 axis. Interestingly, birds with webbed feet show stronger negative PC 3 values; Archaeopteryx, confuciusornithids, and basal ornithurines also trend weakly negative. Charadriiformes covers a large area of the morphospace, straddling the PC 3 axis, but remaining nearly entirely on the negative side of the PC 2 axis (Fig. 5). Pelecaniformes, on the positive side of the PC 2 axis, forms the second largest cluster in the morphospace. Tyto alba, sole representative of the Strigiformes, is isolated, away from any other cluster of species. Passeriformes shows a tight cluster, strongly positive along the PC 2 axis. Both Gaviiformes and Anseriformes cluster within the large cluster of Charadriiformes. The sole representative of Falconiformes (Falco peregrinus) is found very near the two representatives of Piciformes—slightly positive along the PC 2 axis, but neutral along the PC 3 axis.
The PPCA results show some differences from the PCA results, primarily in the location of Accipitiriformes, Podicipediformes, Piciformes, and Gaviiformes (Figs. 4, 6). The foot-only analysis loadings between PCA and PPCA show that variables contribute similarly to the PC axes across both analyses (Figs. 7, 8). Accipitiriformes shift from positive along both the PC 1 and PC 2 axes to neutral along PPC 1 and strongly negative along PPC 2 (Fig. 4, Taxonomy). Podicipediformes go from neutral along PC 1 and strongly negative along PC 2 to strongly positive along PPC 2 (essentially “flipped”), although the relative position along PC 1 does not significantly change. Gaviiformes jump from strongly positive along PC 1 and relatively neutral along PC 2 to neutral along PPC 1 and strongly negative along PPC 2. Piciformes shift from neutral along both the PC 1 and PC 2 axes to neutral along PPC 1 and negative along PPC 2 (Dryocopus) to strongly positive along PPC 1 and negative along PPC 2 (Coalptes). Passeriforms also experience a more dramatic shift, remaining relatively neutral along the PPC 2 axis, but shifting from negative along the PC 1 axis to positive along the PPC 1 axis (Fig. 4, Taxonomy). Other taxonomic groupings experience slight shifts in morphospace occupation, but are not dramatically different than in the PCA. These changes in position result in distinct changes to the positions of lobed-footed birds, totipalmate birds, and zygodactyl birds in the morphotype morphospace, and foot-propelled divers, raptorial hunters, and climbing birds in the ecotype morphospace. We see similar species shifting in the morphospace in the PPC 2–PPC 3 analysis (Fig. 6), as well as dramatic changes in Pelecaniformes, which strongly contract and form a much tighter cluster in the PPCA than in the PCA (Fig. 6, Taxonomy). The strigiform T. alba also changes position, moving from positive along PC 2 and neutral along PC 3 to neutral along PPC 2 and negative along PPC 3 (Fig. 6, Foot, Taxonomy).
Theoretical morphospace plots for PPC 2–PPC 3 of the foot only (top), leg only (middle), and whole hind limb (bottom). Species were grouped by taxonomy (left), foot morphotype (middle), and ecology (right). Note that the leg-only analysis, as in the PC 2–PC 3 analysis, shows significant overlap between groups, especially in groupings based on morphotype.

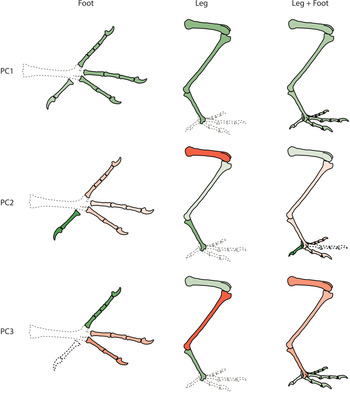
Graphical representations of the loadings of PC 1–PC 3 of the foot-only, hind limb–only, and whole-leg analyses (left, middle, and right respectively). Red indicates negative loading values, green indicates positive. Loadings are shown as a heat map; the paler the color, the smaller the value. Dashed gray lines represent portions of the drawing that were not measured in that analysis. Dashed black lines represent portions of the measured material that were not applicable for that particular component. Note that values for PC 1 all trend in the same direction (positive) and are approximately equal in value.

Graphical representations of the loadings of PPC 1–PPC 3 of the foot-only, hind limb–only, and whole-leg analyses (left, middle, and right respectively). As in the PCA loadings, red indicates negative loading values, green indicates positive. Loadings are shown as a heat map; the paler the color, the smaller the value. Dashed gray lines represent portions of the drawing that were not measured in that analysis. Note the “flipped” nature of the PPC 1 loadings for the leg-only and whole-hind limb analyses; however, all three PPCs are still trending in the same direction (negative) and are approximately the same value.

Hind Limb-Only Analysis
PC 1 accounts for 95.3% of the variation; once again, the values are positive, suggesting that species on the positive side of the axis have longer relative limb-bone lengths than species on the negative side of the axis. PC 2 and PC 3 combine for only 4.7% variation in the data. A positive PC 2 value suggests that the tarsometatarsus is the more dominant element in the hind limb. A negative PC 2 value suggests that the femur contributes more strongly to the hind limb. A negative PC 3 value reflects the importance of the tibiotarsus, while a positive PC 3 value reflects a more even distribution between femur and tarsometatarsus (Fig. 7).
Mesanisodactyl birds cover the largest amount of the morphospace; though there are few species in the positive PC 2–positive PC 3 quadrant, there are species scattered throughout the rest of the morphospace. Stenanisodactyl birds cover the second-largest amount of morphospace, and are evenly distributed around the PC 2 axis, but mainly found on the positive side of the PC 3 axis; interestingly, this seems largely split between fossil stenanisodactyl birds (mostly negative) and modern ones (mostly positive). Euryanisodactyl birds also cover a large area of morphospace, but plot exclusively on the positive side of the PC 2 axis. The lone syndactyl bird plots very strongly negative on both the PC 2 and PC 3 axes and is very isolated in the morphospace. Overall there seems to be no distinct clustering of foot morphotypes; with the exception of zygodactyl birds, most groups seem largely scattered over the morphospace (Fig. 5, Leg).
Interestingly, raptorial hunters and two arboreal non-climbing birds (Opisthocomus and Megaceryle) plot on the negative side of the PC 2 axis, overlapping with basal birds and confuciusornithids (Fig. 5). The extreme positioning of Megaceryle causes the arboreal non-climbing bird polygon to cover the highest amount of morphospace. Subaqueous saturated sediment foragers tend more negative along the PC 3 and more positive along the PC 2 axis than their ground and raptorial mesanisodactyl counterparts, which are both clustered solidly on the positive side of the PC 3 axis. Climbing birds are also shifted strongly negatively along the PC 2 axis. However, as with foot morphotypes, few isolated clusters are seen; the only strongly isolated group is the foot-propelled divers, which plot strongly positive on the PC 2 axis and negative on the PC 3 axis; even these have some overlap with swimmers and non-climbing arboreal birds due to the position of Megaceryle.
Archaeopteryx, confuciusornithids, and basal birds trend strongly positive along the PC 2 axis (Fig. 5). Enantiornithines trend more toward the middle of the PC 2 axis, and basal ornithurines stretch from strongly positive to negative. Accipitriformes, the lone falconiform, and the hoatzin completely overlap with the cluster of fossil birds (Fig. 5, Taxonomy). Charadriiform birds once again cover a large area of the morphospace, but are found mainly on the positive side of the PC 2 axis and roughly evenly straddle the PC 3 axis. Passeriforms form a relatively narrow polygon that plots largely on the positive side of both PC axes, but has a handful of species on the negative side of the PC 2 axis and one (Corvus corax) on the negative side of the PC 3 axis. The strigiform T. alba nests within the passeriform cluster. Anseriform birds also form a relatively narrow polygon that is completely nested within the center of a large polygon formed by Pelecaniformes. Pelecaniformes also almost completely enclose enantiornithines, strongly overlap with basal ornithurines and Charadriiformes, and enclose Anseriformes and the lobed-footed gruiiform Fulicia americana.
The PPCA PPC 1–PPC 2 results for the leg-only analysis do not show the same degree of dramatic shifts as seen in the foot-only analysis, with the exception of enantiornithines and some charadriiforms, and, to a lesser extent, pelecaniforms and anseriforms. Enantiornithines shift dramatically along the PC 1 axis from strongly negative to neutral or positive, but shift only slightly positively along the PPC 2 axis. Some charadriiforms (specifically Himantopus mexicanus and Recurvirostra americana) shift from very strongly positive to smaller positive values (Figs. 3, 4). Pelecaniforms shift from being positive along the PC 1 axis to neutral or more negative along the PPC 1 axis, and shift slightly positively along the PPC 2 axis. Anseriforms also shift from more positive or neutral values along the PC 1 axis to more strongly negative along the PPC 1 axis; however, their position along the PPC 2 shifts only slightly positively (Fig. 4). The changes to morphospace occupation affect totipalmate birds, euryanisodactyl birds, and stenanisodactyl birds the most on the morphological side of the analysis, and foot-propelled divers, subaqueous saturated sediment for agers, and non-climbing arboreal birds in terms of ecotype. The most significant change in the PPC 2–PPC 3 analysis is the change in position of Megaceryle, which shifts from strongly negative along the PC 3 axis to neutral along the PPC 3 axis. In general, morphospace occupation contracts in the PPCA 2–PPCA 3 analysis and shifts positively along PPC 2 and toward neutral along PPC 3, but the overall relative position remains the same, with the exception of one columbiform (Zenaida macrocura), which shifts negatively along the PPC 3 axis (Fig. 6).
Foot + Hind Limb Analysis
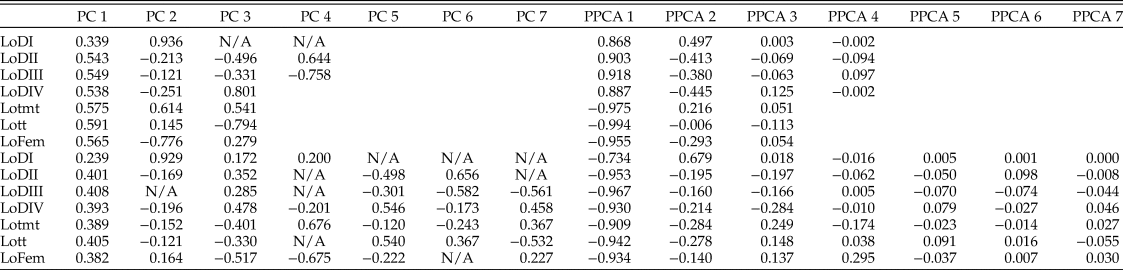
PC 1 accounts for 77.5% of the variation; all loadings are positive, with similar values between 0.382 and 0.408. PC 2 and PC 3 combine for 20.9% of the variation in the data. The loadings for the leg-only analysis suggest that a positive PC 2 value implies that the first digit (with a loadings value of 0.929; Table 4) is large, while a negative value implies a smaller digit I; this feature is the most important aspect of the entire hind limb (Fig. 7); the other elements have a much smaller influence compared with this along the PC 2 axis. A positive PC 3 value indicates the foot (specifically digits II and IV) is the more important part of the entire hind limb, while a negative PC 3 value suggests that the three individual long bones of the hind limb (femur, tibiotarsus, and tarsometatarsus) contribute more to the morphology of the overall foot and hind limb (Fig. 7).
Loadings of the principal component analysis (PCA) and phylogenetic principal component analysis (PPCA) performed in this study. Some variables had no influence on a particular principal component of an analysis; these are noted as “N/A.”

Stenanisodactyl and zygodactyl are found generally only on the positive side of the PC 2 axis, but on both sides of the PC 3 axis. Fossil birds included in stenanisodactyl are more negatively skewed than modern counterparts, similar to the foot-only analysis. Mesanisodactyl birds cover a large area of the morphospace, although they are found almost exclusively on the positive side of the PC 2 axis, and many are on the negative side of the PC 3 axis. Both euryanisodactyl and palmate birds are found exclusively on the negative side of the PC 2 axis, but straddle the PC 3 axis. Lobed-footed and totipalmate birds are strongly positive along the PC 3 axis. Totipalmates trend more neutrally along the PC 2 axis, whereas lobed-footed birds trend strongly negative, except for F. americana, which overlaps with the totipalmate polygon.
When examining ecology, subaqueous saturated sediment foragers cover a large area of the morphospace (due to the inclusion of R. americana and H. mexicanus as subaqueous saturated sediment foragers, which plot strongly on the negative side of both axes), but are mainly found on the negative sides of both axes (Fig. 5). Ground birds straddle the PC 2 axis but are only found on the negative side of the PC 3 axis. Saturated sediment foragers are almost exclusively on the negative side of the PC 2 axis, as are the majority of palmate birds. Both saturated sediment foragers and palmate birds straddle the PC 3 axis. Foot-propelled divers are strongly negative along the PC 3 axis but mainly positive along the PC 2 axis. Raptorial hunters, climbing birds (with the exception of Zhongornis), and arboreal non-climbing birds are exclusively clustered on the positive side of the PC 2 axis. Raptorial hunters are almost exclusively negative along the PC 3 axis, while arboreal non-climbers and primarily ground foragers are evenly distributed across both sides of that axis. Climbing birds also straddle the PC 3 axis, with modern birds plotting more positive and fossil birds plotting more negative.
Once again, fossil birds trend toward the neutral area of the morphospace along the PC 2 axis, with two enantiornithines and Sapeornis being the sole distant outliers, clustering on the positive side of the axis (Fig. 3, Taxonomy). Basal ornithurines are found on the positive side of the PC 3 axis, whereas confuciusornithids are found only on the negative side. Charadriiform birds once again cover a large area of the morphospace; however, this area is exclusively on the negative side of the PC 2 axis (Fig. 5). Passeriforms, accipitriforms, and pelecaniforms all plot on the positive side of the PC 2 axis, as do columbiforms, piciforms, and the lone falconiform. Accipitiriforms are strongly negative along the PC 3 axis; however, F. peregrinus plots neutrally along the PC 3 axis, near columbiforms and piciforms. Gaviiforms are very strongly positive along the PC 3 axis; podicipediforms are also positive, but not as strongly so. Podicipediforms are, however, very strongly negative along the PC 2 axis, while gaviiforms are either weakly positive or weakly negative. Gruiiforms span a huge area of the morphospace; G. canadensis is solidly in the negative area of the morphospace for both axes, whereas F. americana and Porazana carolina are solidly in the positive area of the morphospace for both axes. Anseriforms form a small cluster that is nearly neutral along the PC 2 axis and positive along the PC 3 axis. Galliforms are found only on the negative side of the PC 3 axis, but trend weakly positive along the PC 2 axis. The sole coraciiform (Megaceryle) plots within pelecaniforms. Strigiforms and cuculiforms cluster together on the positive side of the PC 2 axis but are strongly negative on the PC 3 axis. The hoatzin sits near Pelecaniformes, plotting positive along both PC axes.
The PPCA results for the whole-limb analysis show similarities to the foot-only analysis, with only slight changes to the PPC 2 loadings (Fig. 8). PPC 1 loadings also indicate that body size is correlated with phylogeny, as there is a noticeable difference between the value of toe I to the remainder of the foot and hind limb, which is not seen in PC 1 (Fig. 7). Accipitiriformes and Gaviiformes shift in similar ways, as do Podicipediformes. Only one piciform (Dryocopus) experiences a dramatic change in morphospace (Fig. 4). Enantiornithines do experience a more dramatic shift along the PPC 1 axis, moving from negative along PC 1 to positive along PPC 1, than what is seen in the foot-only analysis (Fig. 4). Passeriforms do not show the same shift along the PPC 1 axis as is seen in the foot-only analysis. Charadriiforms do not shift much along the PPC 1 axis, but do shift sharply negatively along the PPC 2 axis. As with the foot-only analysis, lobed-footed and totipalmate bird groups experience significant changes in morphospace occupation, as do euryanisodactyl and, to a lesser extent, stenanisodactyl birds. Climbing birds, saturated sediment foragers, subaqueous saturated sediment foragers, and ground birds experience changes in morphospace occupation (Fig. 4). PPCA 2–PPCA 3 shows similar changes in gaviiform and podicipediform morphospace occupation, as well as a dramatic change in the position of Charadriiformes, which shifts sharply more negative along the PPC 3 axis. Gruiiform birds also experience a dramatic contraction of morphospace occupation due to the shift of G. canadensis from strongly negative along PC 3 to neutral along PPC 3. Passeriform birds shift negatively along the PPC 3 axis. Pelecaniform birds also shift negatively along the PPC 2 and PPC 3 axes (Fig. 6). These shifts result in changes in morphospace occupation of lobed-footed and totipalmate birds, as well as palmate, mesanisodactyl, and euryanisodactyl birds (Fig. 6). Raptorial hunters greatly expand their morphospace covered, as do foot-propelled divers, non-climbing arboreal birds, predominantly ground foragers, and saturated sediment foragers (Fig. 6).
PERMANOVA Results
Results of the PERMANOVA analysis of the PCA and PPCA data show similar results (Supplementary Material). In both PCA and PPCA, the hind limb–only analysis showed the least amount of variation between groups; in fact, in both the PCA and PPCA, there was no significant difference between groups based on ecology, and only lobed-footed birds showed any significant difference when examining morphotype groups. Passeriformes showed the greatest number of statistically significant differences from other groups, including Podicipediformes, basal ornithurines, basal birds, and confuciusornithids in the PCA PERMANOVA analysis; the PPCA is identical, except for the addition of enantiornithines. Basal birds are also significantly different from anseriform birds.
The foot-only analysis shows a much higher degree of statistical significance across all three types of groupings. The PPCA typically shows a higher number of statistically significant groupings than does the PCA PERMANOVA. Consistent patterns do emerge; in both analyses, Passeriformes show the highest degree of statistically significant differences compared with other groups, with p-values of 0.05 or smaller found in 11 of 20 comparisons with other taxonomic groups. Other taxonomic groups show scattered significant differences, though no other clear patterns emerge. The PPCA of morphotype results show lobed-footed birds and totipalmate birds are significantly different from four other morphotypes each. The PCA PERMANOVA does not show as much statistically significant variation, though lobed-footed birds are still significantly different from three other morphotypes. Ecological groupings show statistically significant groupings, unlike in the leg-only analysis. Predominantly ground-foraging birds and raptorial hunters are significantly different from a large number of other morphotypes in both the PCA and PPCA.
The whole-limb analysis PERMANOVAs are identical between the PCA and PPCA when examining taxonomic groupings. Passeriformes remain the most significantly different, again showing 11 of 20 with p-values less than or equal to 0.05. Morphotype groupings show more significant differences in the PCA; in the PPCA only lobed-footed birds have any significant differences. The PCA shows a number of significant differences within totipalmate birds, and two for both euryanisodactyl and stenanisodactyl birds. Significant differences in groups based on ecology are generally similar between the PCA and PPCA PERMANOVA results; however, the PCA results show a higher number of statistically significant groupings, specifically in raptorial hunters. Lobed-footed birds also show a slightly higher number of statistically significant comparisons (five in the PCA vs. four in the PPCA).
Discussion
The Phylogeny and Ecology of Avian Feet and Hind Limbs
Morphology and ecology exhibit the same general phylogenetic trend of distinct trait clumping more extreme than what would be expected under a purely Brownian model of evolution (Tables 2, 3). Despite this, the observed distributions have a high probability of Brownian evolution–type clustering. This can be interpreted a result of the repeated evolution of a morphotype or ecotype that is subsequently conserved within the group; in phylogenetic parlance, these traits would exhibit low consistency but high retention. This can be clearly seen when plotting traits on the phylogeny (Fig. 2). For example, a swimming ecology evolved five times, twice associated with the diversification of major clades that maintain the swimming life habit. A stenanisodactyl morphology has also evolved five times, and four of those times it was conserved across subsequent radiations.
The exact relationship between avian ecology and hind limb morphology is unclear, and it seems likely that different degrees of specialization required for different ecologies result in different potentials for covariation. This results in ecology and morphology exhibiting a strong correlative but not linear relationship. Climbing and perching ecologies appear to have similar morphological requirements and regularly occur with both mesanisodactyl and stenanisodactyl morphologies, but can also occur with the highly specialized syndactyl and zygodactyl morphologies. Shorebird ecologies are associated with both mesanisodactyl and euryanisodactyl morphologies, while diving birds either have a lobed or totipalmate morphology. Some ecologies therefore appear to result in concerted convergent changes, as is the case with the palmate foot morphology, which categorizes two phylogenetically distant groups of swimmers, while other morphologies potentially occur due to parallelism, as appears to be the case for the totipalmate morphology among Gaviiformes and Pelecaniformes.
Toe-Length Analysis
The presence of Archaeopteryx and basal ornithurines, as well as many of the basal birds (with the notable exception of the basal pygostylian Sapeornis), near the center of the morphospace, especially near 0 along the PC 2 axis, suggests that a generalized basal foot morphotype was present in early birds. Early ornithurine birds would have retained a similar basal morphotype; the diversity in the morphospace occupied by modern birds would have evolved after the Cretaceous–Paleogene (K-Pg) extinction event from basal morphotypes remaining. This divergence was largely based upon the presence of an elongate reversed hallux, a fundamental necessity for successful perching (Middleton Reference Middleton2001). That is not to say that Mesozoic birds did not possess an elongate reversed hallux; this is present in some of the earliest birds and continues throughout the avian phylogenetic tree. However, it is the modification of the hallux from a generalized ancestral morphotype (one that is not especially long or short) that drives changes in morphospace occupation seen in Neornithine birds (Fig. 5).
Enantiornithines clustering with arboreal non-climbing and climbing birds is not surprising. Enantiornithines are the dominant terrestrial birds of the Mesozoic, filling the arboreal niches occupied today by groups such as Passeriformes; this is reflected by the fact that they cluster within the polygon of arboreal non-climbing birds, with the exception of Zhongornis (Fig. 5, Taxonomy). Many enantiornithines have large reflexed hallux toes; however, the rest of their foot anatomy can be highly variable (e.g., Chiappe and Walker Reference Chiappe, Walker, Chiappe and Witmer2002).
Foot morphotype and taxonomy do not often appear to be tightly linked. Indeed, some taxonomic groups are found to contain several different foot morphotypes; for example, Charadriiformes includes palmate, semipalmate, and euryanisodactyl morphotypes. There are exceptions; for example, Passeriformes are all considered stenanisodactyl (Fig. 5). The same is true for ecology; swimmers are spread across totipalmate and semipalmate morphotypes and include representatives of Charadriiformes, Pelecaniformes, and Anseriformes. Though passeriforms have traditionally been considered “perching” birds, several are categorized as predominantly ground foragers, and furthermore, the perching bird ecology includes individuals from Cuculiformes, Coraciiformes, Opisthocomiformes, and Columbiformes. Foot structure is clearly generally variable within taxonomic groups.
Hind Limb Analysis
The majority of fossil birds are found on the far right of the scatter plot (Fig. 5, Taxonomy). The exceptions are enantiornithines, which plot more centrally, and multiple basal ornithurine birds, which plot more toward the left side of the PC 2 axis. This represents dramatic shifts in the structure and function of the femoral muscles and bipedal locomotor system of birds. The modern avian femur is tightly bound to the body wall with muscle, with the greater trochanter of the femur resting against the antitrochanter of the pelvis. The antitrochanter functions as a brace for body weight as part of the unique knee-driven locomotion in birds (Hertel and Campbell Reference Hertel and Campbell2007), and the antitrochanter acts as an accessory articulation surface (Hutchinson and Allen Reference Hutchinson and Allen2009); it is not a site for muscle attachment. The femur contributes only approximately 9.5° of flexion/extension or adduction/abduction in highly cursorial birds (Rubinson et al. Reference Rubinson, Lloyd, Besier, Heliams and Fournier2007). Movement of the hip joint is also minimal (Stoessel and Fischer Reference Stoessel and Fischer2012). Studies that examine both the hind limb elements and the pelvis find that pelvis and femur length covary (Barbosa and Moreno Reference Barbosa and Moreno1999a,Reference Barbosa and Morenob), which, combined with previous examinations of femoral contribution to hind limb motion (e.g., Rubinson et al. Reference Rubinson, Lloyd, Besier, Heliams and Fournier2007; Stoessel and Fischer Reference Stoessel and Fischer2012), suggests that both femur and pelvis contribute little to forward locomotion in birds. Furthermore, the pelvis has shown to be critical in the role of cuirassal breathing in archosaurs, specifically playing a role in birds for pelvic aspiration both during song and flight (Carrier and Farmer Reference Carrier and Farmer2000). Contribution of the pelvis to breathing during bipedal walking has not been examined, but this may represent the main function of the pelvis during this particular method of avian locomotion.
Basal ornithurines may occupy a significant portion of the morphospace due to this transition from a free-moving femur to one locked to the body wall with muscle; interestingly, of the two that plot in among the swimmers and subaqueous saturated sediment foragers (Gansus and Hongshanornis), one, Gansus, has a definitive antitrochanter (You et al. Reference You, Lamanna, Harris, Chiappe, O'Connor, Ji and Lü2006). No antitrochanter has been reported from Hongshanornis; however, this may be due to preservation, as published specimens are preserved in ventral view (Zhou and Zhang Reference Zhou and Zhang2005) or poorly preserved (Chiappe et al. Reference Chiappe, Zhao, O'Connor, Gao, Wang, Habib, Marugan-Lobon, Meng and Cheng2017). Yixianornis has not been reported to have an antitrochanter, nor has Yanornis. This transition to knee-driven locomotion may have taken place in early ornithurines and been “locked-in” as those surviving across the K/Pg boundary would have had this hind limb structure; interestingly, there are enantiornithines with an antitrochanter on the pelvis (e.g., Shanweiniao; O'Connor et al. Reference O'Connor, Wang, Chiappe, Gao, Meng, Cheng and Liu2009). This may suggest a convergent evolution of an antitrochanter across these two distantly related groups.
A handful of modern birds do plot strongly negatively along the PC 2 axis, with many of the fossil birds. These include Megaceryle, F. peregrinus, and Aquila cyseatos. Opisthocomus and Buteo jamaicensis, along with both galliforms and columbiforms and a few pelecaniforms, also plot near the edge of the “basal” morphospace as defined by Archaeopteryx. This shift back toward a femur-dominated leg morphology may be due to specific life habits, including predatory striking with the legs in birds of prey or the lunging habits of kingfishers. This requires a closer examination of this phenomenon and an expansion of the dataset with specific focus on these groups, which is beyond the scope of this study.
Complete Hind Limb Analysis
The final analysis shows the influence of the hallux (PC 2) and the entire foot in comparison to the entire remainder of the hind limb (PC 3) (Fig. 5). In this analysis, fossil groups tended to cluster near the center of the morphospace; Archaeopteryx is nearly neutral along the PC 2 axis and only somewhat negative along the PC 3 axis (Taxonomy; Fig. 5). Enantiornithines shift toward the positive side of the PC 2 axis, along with a handful of basal birds (specifically, Sapeornis plots most strongly positive along PC 2 and negative along PC 3; Fig. 5, Taxonomy). Interestingly, modern stenansiodactyl birds are more strongly positive along the PC 2 axis than fossil birds that are considered stenanisodactyl, with the exception of the enantiornithines Shanweiniao and Rapaxavis. Mesanisodactyl birds are broadly distributed, indicating that the variation among this group of both the influence of the hallux and the influence of the hind limb elements highly varies. Both euryanisodactyl and palmate birds plot negatively along the PC 2 axis, reflecting the reduction of the hallux toe in these groups, while stenanisodactyl and zygodactyl birds plot positively, reflecting the importance of the hallux in these morphotypes.
Examining the ecology of these groups, ground birds plot strongly along the positive side of the PC 3 axis, as do most raptorial hunters; interestingly, ground birds are relatively neutral along the PC 2 axis (Fig. 5, Ecotype), save for G. canadensis, which plots more negatively along the PC 2 axis than other ground birds, representing a smaller relative hallux. Grus canadensis often occupies marginal habitats (i.e., it is found in both open fields and near swampy, saturated ground; Sibley Reference Sibley2000); however, both subaqueous saturated sediment foragers and ground birds typically possess a longer hallux than G. canadensis, which has an overall hallux morphology more similar to that of saturated sediment foragers. Subaqueous saturated sediment foragers cover a huge portion of the morphospace; this is due to Recurvirostra and Himantopus being included in this ecology. Without them, subaqueous saturated sediment foragers are restricted to the positive side of the PC 2 axis; this reflects the difference in foot morphotype. Recurvirostra and Himantopus are both euryanisodactyl, whereas the other subaqueous saturated sediment foragers are mesanisodactyl, with long halluxes. Enantiornithines still cluster mostly closely with arboreal non-climbing and climbing birds and most of the subaqueous saturated sediment foragers along the PC 2 axis, a result of their more robust hallux; like arboreal non-climbing and primarily ground-foraging birds, they are distributed across both positive and negative sides of the PC 3 axis. Basal ornithurines are enclosed within swimmers, subaqueous saturated sediment foragers, or saturated sediment foragers, which show significant overlap. This fits well with the previous interpretations about life habits for many early ornithurine birds, including Gansus, Hongshanornis, Yanornis, and others (Zhou and Zhang Reference Zhou and Zhang2005; You et al. Reference You, Lamanna, Harris, Chiappe, O'Connor, Ji and Lü2006; Nudds et al. Reference Nudds, Atterholt, Wang and Dyke2013).
Charadriiformes covers the largest amount of the morphospace, equally divided on either side of the PC 3 axis but entirely on the negative side of PC 2. Charadriiform birds in general have a reduced hallux, but this suggests that some birds have a more hind limb–dominated structure, while others have a foot-dominated structure. This may represent a fundamental split between charadriiforms that swim and those that are considered “shorebirds,” save for Calidris minutilla, which plots positive along the PC 3 axis (Fig. 5, Taxonomy). Gruiiforms are the other group that appears very disparate in this analysis, though only along the PC 3 axis. This, again, likely represents a difference in life habits that is not constrained by taxonomy. Some groups, however, do seem to have relatively constrained distributions, such as Passeriformes and, to a lesser extent, Pelecaniformes. Some morphologies seem to have become “locked-in” and are less likely to vary with changing life habits than others. Differential contributions to a group's disparity by constituent clades have been documented in a variety of taxa (Hopkins Reference Hopkins2016) and can be correlated with differences in ecology, as seen in horseshoe crabs (Lamsdell Reference Lamsdell2016), although it is currently unclear whether some groups within Aves appear more morphologically plastic due to aspects of their ecology.
What the Fossils Represent
Based on these three analyses, Aves began with a basal, generalized foot morphotype, with an unspecialized reflexed hallux and generic toe lengths. The femur was not bound to the body wall with musculature, resulting in a more freely mobile hind limb that also had not undergone significant specializations seen in derived avian species. Enantiornithines underwent their own foot and hind limb specializations, which included the reduction of toe IV and the enlarging of toe II, as well as other specializations for arboreal life habits (Chiappe and Walker Reference Chiappe, Walker, Chiappe and Witmer2002; O'Connor et al. Reference O'Connor, Wang, Chiappe, Gao, Meng, Cheng and Liu2009, Reference O'Connor, Chiappe, Gao and Zhao2011). Basal birds, confuciusornithids, and basal ornithurines appear to have relatively unspecialized feet (Fig. 5, Foot, Taxonomy); however, basal ornithurines seem to show a distinct shift toward a modern avian hind limb system, with an antitrochanter present and the femur locked to the side of the body wall with muscle. Basal birds and confuciusornithids do not show occupation of the same morphospace, and likely lacked this specialization. This suggests that knee-driven locomotion was present in birds by the Early Cretaceous. This matches well with the hind limb evolutionary continuum proposed by Hutchinson and Allen (Reference Hutchinson and Allen2009), which suggests shifts toward a more caudally directed horizontal buttress avian-style trochanter were beginning in eumaniraptorans. As the avian bony tail was lost and the center of gravity shifted forward (Hutchinson and Allen Reference Hutchinson and Allen2009), this would have further supported a shift to this method of locomotion.
In some modern birds, there appears to have been a reversal toward more basal hind limb proportions—however, the femur remains solidly locked to the body wall with muscle in these groups. In Falconidae, the femoral muscles are not as significant as the muscles of the tibiotarsus (Mosto Reference Mosto2017), despite the fact that F. peregrinus plots as the third-most femur-dominated individual among modern birds (Fig 5, Taxonomy, Leg). This likely reflects some shift in life habit—either hind limb–striking predation as in birds of prey, specialized feeding in Megaceryle and other kingfishers, or more terrestrial life habits, such as those in most gruiiforms. The two passeriform birds that plot toward the femur-dominated side of the morphospace are two Corvus species, which are classified as predominately ground-foraging birds.
Conclusions
PCAs of avian feet, hind limb elements, and the combined foot + hind limb complex suggest an unspecialized foot morphotype in early birds, along with a freely mobile femur and hip-driven locomotion. In the analysis, basal ornithurines such as Gansus show that even in the Early Cretaceous birds had shifted to knee-driven locomotion, with the femur locked to the body wall with muscle. Overall, however, the link between ecology and phylogeny is complicated; our results are preliminary and may be heavily impacted by sampling bias, as there are only 60 species sampled out of tens of thousands. Our analysis should be treated as a preliminary study that further studies should explore, especially concerning the foot and hind limbs of modern taxa. A fundamental takeaway from this study, however, is the evidence that modern birds show far greater specialization of the foot than stem birds. This may be related to a wider breadth of niches occupied by modern birds.
Acknowledgments
We are grateful to Z. Zhou, D. Hu, and C. Gao for access to fossil specimens. We thank J. Hinshaw for access to the University of Michigan Natural History Museum ornithology collections and M. Robbins for access to the University of Kansas Natural History Museum ornithology collections. This research was supported in part by a Fulbright Full Student Grant, and part of the dataset comes from a dissertation completed by A.R.F. We thank T. A. Dececchi for his review and comments, which greatly improved the article. We also thank an anonymous reviewer for comments.