INTRODUCTION
Killer whales (Orcinus orca, Linnaeus 1758) have an important role in the marine environment as top-predators. Information on their distribution, abundance and population dynamics is necessary to be able to evaluate their impact on the marine ecosystem, and knowledge of their status is crucial to monitor their population specific viability for conservation purposes (Boyd et al., Reference Boyd, Wanless and Camphuysen2006). Killer whales have a global distribution and are found in all major oceans (Matkin & Leatherwood, Reference Matkin, Leatherwood, Kirkevold and Lockard1986; Forney & Wade, Reference Forney, Wade and Estes2007). World-wide dispersal is possible through the generalist foraging habits of this species, their diet varying from various fish species, e.g. herring and salmon, to large baleen whales (Guinet, Reference Guinet1991; Similä et al., Reference Similä, Holst and Christensen1996; Ford et al., Reference Ford, Ellis, Barrett-Lennard, Morton, Palm and Balcomb1998, Reference Ford, Ellis, Matkin, Balcomb, Briggs and Morton2005; Visser, Reference Visser1999; Pitman & Ensor, Reference Pitman and Ensor2003; Higdon et al., Reference Higdon, Hauser and Ferguson2011; Reisinger et al., Reference Reisinger, de Bruyn, Tosh, Oosthuizen, Mufanadzo and Bester2011a).
Local adaptations, behaviours and specific prey preferences have lead to the formation of different ‘ecotypes’ of killer whales which can be distinguished morphologically and/or genetically (LeDuc et al., Reference LeDuc, Robertson and Pitman2008; Foote et al., Reference Foote, Newton, Piertney, Willerslev and Gilbert2009, Reference Foote, Vilstrup, de Stephanis, Verborgh, Abel Nielsen, Deaville, Kleivane, Martín, Miller, Øien, Pérez-Gil, Rasmussen, Reid, Robertson, Rogan, Similä, Tejedor, Vester, Víkingsson, Willerslev, Gilbert and Piertney2011; Morin et al., Reference Morin, Archer, Foote, Vilstrup, Allen, Wade, Durban, Parsons, Pitman, Li, Bouffard, Abel Nielsen, Rasmussen, Willerslev, Gilbert and Harkins2010; Pilot et al., Reference Pilot, Dahlheim and Hoelzel2010). Two different types; fish-eating (1) and potential mammal-eating (2) have been identified in the North Atlantic (Foote et al., Reference Foote, Newton, Piertney, Willerslev and Gilbert2009). Fish-eating killer whales in the north-east Atlantic form three different populations; herring-feeding (A), mackerel-feeding (B) and tuna-feeding (C) (Foote et al., Reference Foote, Vilstrup, de Stephanis, Verborgh, Abel Nielsen, Deaville, Kleivane, Martín, Miller, Øien, Pérez-Gil, Rasmussen, Reid, Robertson, Rogan, Similä, Tejedor, Vester, Víkingsson, Willerslev, Gilbert and Piertney2011). The killer whale population in northern Norway represents type (1) and population (A).
The main prey of killer whales in northern Norwegian waters is the Norwegian spring-spawning herring (Clupea harengus, Linnaeus 1758) (hereafter called NSS herring) (Jonsgård & Lyshoel, Reference Jonsgård and Lyshoel1970; Christensen, Reference Christensen, Sigurjónsson and Leatherwood1988; Similä et al., Reference Similä, Holst and Christensen1996). The NSS herring stock conducts large-scale seasonal migrations over thousands of kilometres between coastal and offshore waters, and is known to alter this migration pattern at uneven intervals (Dragesund et al., Reference Dragesund, Johannessen and Ulltang1997; Holst et al., Reference Holst, Dragesund, Hamre, Misund and Østvedt2002, Reference Holst, Røttingen, Melle and Skjoldal2004; Huse et al., Reference Huse, Railsback and Fernö2002). The NSS herring stock has also gone through major changes in its abundance within the last six decades, the last stock collapse happening at the end of the 1960s (Dragesund et al., Reference Dragesund, Johannessen and Ulltang1997; Toresen & Østvedt, Reference Toresen and Østvedt2000).
The distribution and local abundance of killer whales in northern Norway is associated with the presence of this dynamic NSS herring stock (Jonsgård & Lyshoel, Reference Jonsgård and Lyshoel1970; Christensen, Reference Christensen1982, Reference Christensen, Sigurjónsson and Leatherwood1988; Øien, Reference Øien, Sigurjónsson and Leatherwood1988; Similä et al., Reference Similä, Holst and Christensen1996). Since 1986, the NSS herring started wintering in Vestfjord, expanding to the tributary fjords of Tysfjord and Ofotfjord in 1987 between October and January (Holst et al., Reference Holst, Dragesund, Hamre, Misund and Østvedt2002; Orellana, Reference Orellana2006; Huse et al., Reference Huse, Fernö and Holst2010). A long-term study on killer whales in this accessible area was initiated in 1986 (Lyrholm, Reference Lyrholm, Sigurjónsson and Leatherwood1988; Similä, Reference Similä1997a). Throughout the 1990s, the whole spawning stock of NSS herring was concentrated in Tysfjord, Ofotfjord and Vestfjord areas in winter. The biomass of spawning NSS herring stock reached about 10 million tonnes in the late 1990s (Toresen & Østvedt, Reference Toresen and Østvedt2000; Orellana, Reference Orellana2006). Since 2002, part of the NSS herring stock started to winter in a new area outside the fjord system in offshore waters of the Norwegian Sea between 69 and 73°N (Holst et al., Reference Holst, Røttingen, Melle and Skjoldal2004; Huse et al., Reference Huse, Fernö and Holst2010).
Most information on killer whale population parameters and social organization comes from studies conducted off the Pacific coast of North America (Bigg et al., Reference Bigg, Olesiuk and Ellis1990; Olesiuk et al., Reference Olesiuk, Bigg and Ellis1990; Ford et al., Reference Ford, Ellis and Balcomb2000; Olesiuk et al., Reference Olesiuk, Ellis and Ford2005; Zerbini et al., Reference Zerbini, Waite, Durban, LeDuc, Dahlheim and Wade2007; Ward et al., Reference Ward, Semmens, Holmes and Balcolm2011). Recent information on population size and survival rates of killer whales has been produced from the Crozet Archipelago (Poncelet et al., Reference Poncelet, Barbraud and Guinet2010) and on abundance from Marion Island (Reisinger et al., Reference Reisinger, de Bruyn and Bester2011b). Previous work in northern Norway has produced estimates of about 490–550 killer whales in the NSS herring wintering areas during October–January 1990–1993 (Similä & Christensen, Reference Similä and Christensen1992; Similä, Reference Similä1997a). No previous survival or calving rate estimates exist for northern Norwegian killer whales.
Analysis in this study used individual recognition data of northern Norwegian killer whales, collected during 1986–2003 between October–December each year from the NSS herring wintering ground inside the fjord system. This 18 year dataset was used to estimate a time-series of population size taking into account also those individuals in the population that were insufficiently marked to include in mark–recapture analysis. For estimating population size, a simple closed two-sample Chapman estimator was used for pairs of years and also multi-sample closed capture models were used for each year. Apparent survival rates were estimated with Cormack–Jolly–Seber (hereafter called CJS) models for adult males and adult females, and for sub-adults where possible. Calving rates were calculated using data from 1989–2002.
MATERIALS AND METHODS
Data collection and processing
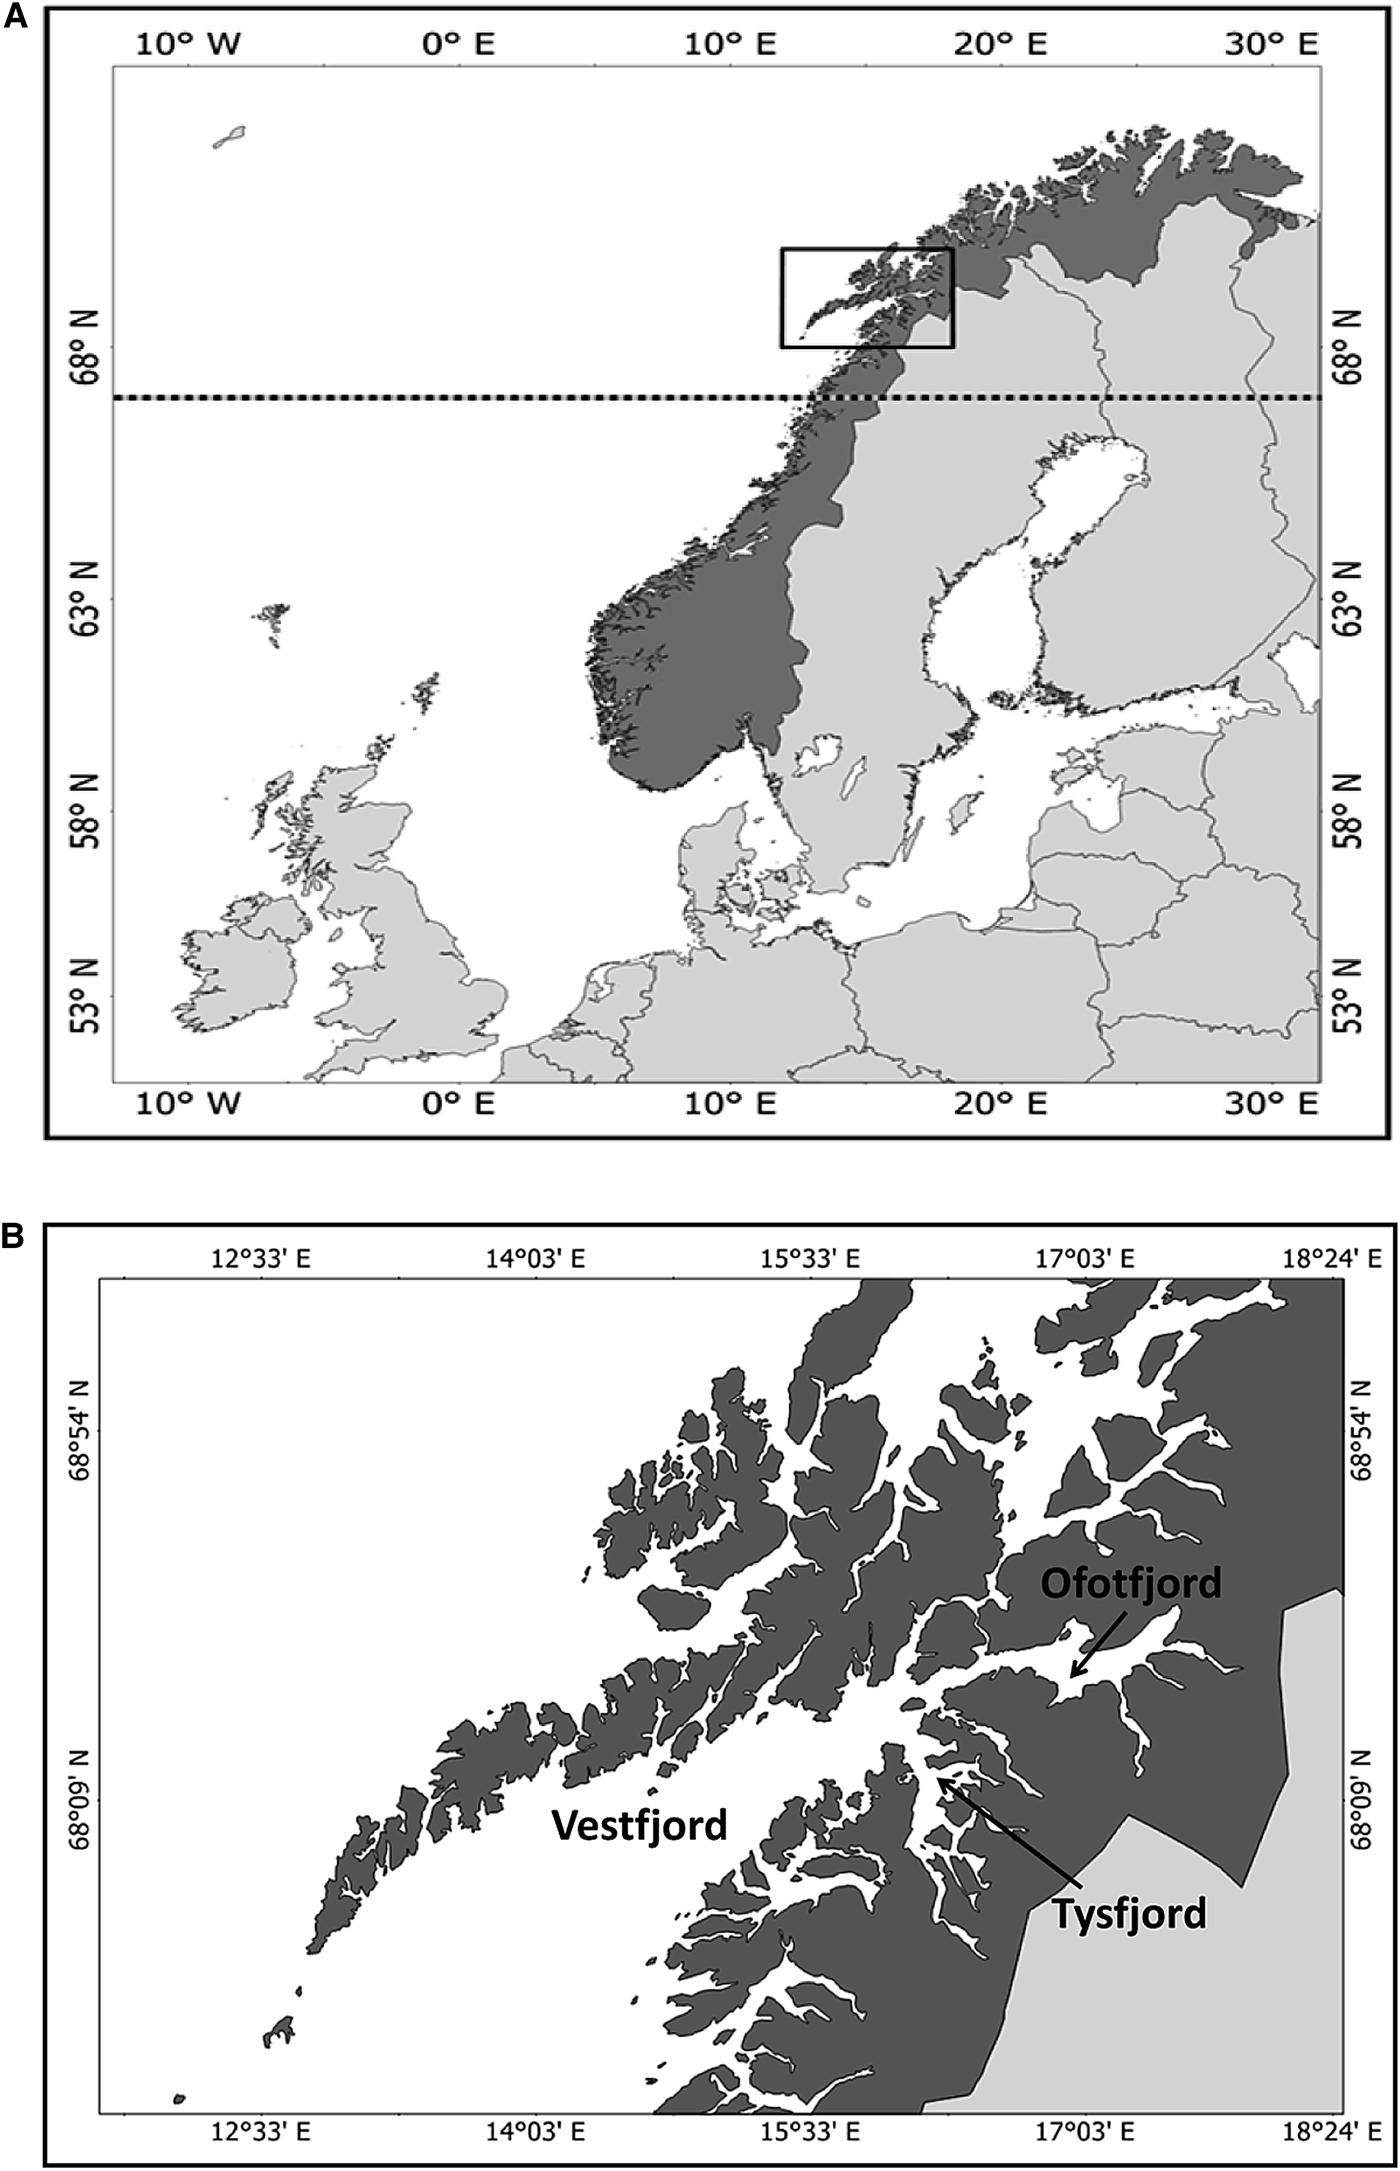
The research area is located above the Arctic Circle in the waters south of the Lofoten Islands in northern Norway (Figure 1A). The data were collected in Ofotfjord, Tysfjord and Vestfjord (Figure 1B) between October and January. The field season shifted later over the years because of herring entering the fjords later each year. For consistency throughout the study, the data collected between October and December 1986–2003 were selected for analysis.
(A) The research area (dark square) located in northern Norway above the Arctic Circle (dashed line); (B) the research areas of Vestfjord, Tysfjord and Ofotfjord in northern Norway.

Killer whales were searched for opportunistically, aided by information from the crew of ferries, whale-watching boats and fishing vessels. When killer whales were encountered the size of the pod and/or group was estimated and, when possible, the number of adult males, adult females, sub-adults, juveniles and calves was recorded. Throughout, the term ‘pod’ refers to a matrilineal family unit of killer whales whereas the term ‘group’ refers to a cluster of killer whales including individuals from different pods.
Identification photographs were taken, with preference for the left side of the animal, using the method described by Bigg (Bigg, Reference Bigg1982; Bigg et al., Reference Bigg, Olesiuk and Ellis1990). An effort was made to photograph as many of the individuals as possible in an encounter and all individuals equally regardless of their degree of identifiability. In 1986–2000 pictures were taken with SLR cameras equipped with 200 or 300 mm lenses. The majority of images were taken with Kodak T MAX 400 ASA film pushed to 1600 ASA. From 2001, images were taken using digital cameras with 200 or 300 mm lenses.
The films were inspected using a stereoscopic microscope and the digital images were viewed in Adobe Photoshop. Individuals were identified by the shape of the dorsal fin and the grey saddle patch behind the dorsal fin and by natural markings in these areas (Bigg, Reference Bigg1982). The identified individuals were divided into different categories: males, females, sub-adults, juveniles and calves (see below). The best picture of each individual from each encounter was compared to pictures in the identification (ID)-catalogue, which held 585 identified individuals from northern Norway by the end of the study. Some individuals included into the ID-catalogue were identified with pictures of insufficient quality to be included in the mark–recapture analysis. Where possible the individual whales were assigned to pods based on stable associations with other individuals and thereby also given a pod-associated identification-code.
Only good quality left-hand-side photographs of identifiable individuals with permanent markings (Similä & Lindblom, Reference Similä and Lindblom1993) were used for further analysis. The quality of each picture was evaluated for contrast and focus, using a scale from 1 to 4, value 1 being the best. The angle of the picture was evaluated from 1 to 3, angle 1 being parallel, 2 being with a slight angle from behind and 3 being with a slight angle from front. The amount of the saddle patch seen in the picture was measured on a scale 1 to 3, 1 being the top 1/3, 2 being the top 2/3 and 3 when saddle patch was seen fully. From these, the overall quality of the picture was assessed. Good quality was defined as a focus of at least 2 and contrast of at least 3.
Encounter histories of identifiable individuals were built through 18 years and used for estimating population size and survival rates using mark–recapture analyses. For calculating calving rates, a calf was assigned to a specific female based on close proximity, swimming in the echelon position (Mann & Smuts, Reference Mann and Smuts1999; Noren et al., Reference Noren, Biedenbach, Redfern and Edwards2008) and the calf needed to be seen on at least two days with the same female to be assigned to that specific female.
DETERMINING SEX AND AGE-CLASS
Adult male killer whales can be identified correctly as males from the first sighting based on their tall dorsal fin (Bigg, Reference Bigg1982). Females do not have such clear morphological evidence of physical maturity, so several years of encounters were needed and other methods were used to determine sex correctly.
A multistep process was conducted to determine the sex of each identifiable individual from northern Norway. Those individuals seen in close and consistent association with a calf were assigned as adult females. The sighting history data of each killer whale individual were used to determine the number of years an individual was encountered and especially the years between first and last sighting. A protocol was then created to determine the age-class of each identifiable individual with the information from the encounter histories. Calves were categorized to be 1–2 years old, juveniles 3–6 years and sub-adults 6+ years old. If a calf, juvenile or sub-adult was only seen in one year throughout the sighting history data, it was assigned as a calf, juvenile or sub-adult, respectively. If an individual was first seen as a calf, only if it was still seen after 15 years was it assigned as an adult female or an adult male. An individual first seen as a juvenile needed to have been encountered 13 or more years to be assigned as an adult female or an adult male. Individuals first seen as a sub-adult could be assigned as an adult female or an adult male after observations of nine or more years. Individuals that could not be categorized into any sex/age specific groups were omitted from analysis.
Data analysis
ANALYTICAL ASSUMPTIONS
Assumptions about the data when using natural or tag markings for mark–recapture analysis are that marks should be unique, permanent and need to be correctly recorded to minimize the risk of false positive or negative matching (Hammond, Reference Hammond1986, Reference Hammond, Boyd, Bowen and Iverson2010). In basic mark–recapture models it is assumed that all individuals have an equal chance of being captured in each sampling occasion (Hammond, Reference Hammond1986, Reference Hammond, Boyd, Bowen and Iverson2010). Violation of this assumption leads to heterogeneity of capture probabilities and downward bias in estimates of population size, survival rate and underestimation of variance (Hammond, Reference Hammond, Blix, Walloe and Ulltang1995). The assumption of equal capture probability can be violated due to differences in behaviour by individuals and/or pods, or by inadequate implementation of the methodology.
The population of killer whales was considered to be closed to births, deaths and permanent emigration and immigration during each field season and so closed capture methods were used to estimate population size in each year. This can be assumed to be true in the case of long-lived mammal species like killer whale and when the sampling is done over a short period of time, e.g. months (Hammond, Reference Hammond1986, Reference Hammond, Perrin, Würsig and Thewissen2009). Open population CJS models assume that all animals have an equal chance of survival from one sampling occasion to another and that marking does not affect the probability of survival (Cormack, Reference Cormack1964; Pledger et al., Reference Pledger, Pollock and Norris2003).
Sufficient time (at least one day) was allowed between weekly sampling occasions to permit all individuals/pods to mix within the research area. Attempts were made to take differences in behaviour into account in selected mark–recapture models.
ESTIMATING POPULATION SIZE
Photo-identification data from October–December 1986–2003 were first used to estimate the number of identifiable individuals ( $\widehat{N}$) for pairs of years using a simple two-sample closed population Chapman estimator (Chapman, Reference Chapman1951):
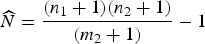 $$\widehat{N} = {\lpar n_1 + 1\rpar \lpar n_2 + 1\rpar \over \lpar m_2 + 1\rpar } -1$$
where n 1 and n 2 are the number of individuals captured in each of the two years, and m 2 is the individuals captured in both years. Variance was estimated as:
 $$V\hat{a}r \lpar \widehat{N}\rpar = {\lpar n_2 + 1\rpar \lpar n_1 + 1\rpar \lpar n_2 - m_2\rpar \lpar n_1 - m_2\rpar \over \lpar m_2 + 1\rpar ^2 \lpar m_2 + 2\rpar }$$
To explore the likely occurrence of heterogeneity in capture probabilities, population size of identifiable individuals was estimated independently for each year by fitting multi-sample closed capture models in program CAPTURE implemented within program MARK (Otis et al., Reference Otis, Burnham, White and Anderson1978; Pollock et al., Reference Pollock, Nichols, Brownie and Hines1990; Chao & Huggins, Reference Chao, Huggins, Amstrup, McDonald and Manly2005; Cooch & White, Reference Cooch and White2012). Weeks were used as sampling occasions within years. The most likely fitting models in the CAPTURE program can be selected based on the model selection criterion (MSC), which is based on the results of hypothesis tests run in CAPTURE to investigate the support for models with different forms of variation in capture probability. No unique ‘goodness of fit’ test exists for closed capture models, so the actual fits of the models to the data were not possible to test.
Data on the number of individuals with and without permanent markings were used to derive estimates of the proportion of the population that was identifiable ( $\hat{\theta}$). The total number of individuals and the number of identifiable individuals were known only for 20 killer whale groups encountered during 1992–2003. The data were split into two periods because of the possibility that the proportion with permanent markings had changed over time. Six groups from 1992–1995 were used to calculate the proportion of identifiable individuals to correct population estimates for 1990–1996. Fourteen groups from 1997–2003 were used for estimates for these years.
Total population size was then estimated as:
 $$\widehat{N}_{total} = {\widehat{N} \over {\hat\theta}}$$
where  $\widehat{N}_{total} =$ estimated total population size,
 $\widehat{N} =$ estimated number of identifiable individuals in the population and
 ${\hat\theta} =$ proportion of identifiable individuals in the population. Variance was estimated directly from the data on proportions of identifiable individuals, using R v.2.15.2 (R Development Core Team, 2012) as:
 $$V\hat{a}r \lpar \widehat{N}_{total}\rpar = \widehat{N}_{total}^2 \left({V\hat{a}r \lpar \widehat{N}\rpar \over \widehat{N}^2} \right)+ \left({V\hat{a}r \lpar \hat{\theta}\rpar \over \hat{\theta}^2} \right)$$
This method is the same as in Wilson et al. (Reference Wilson, Hammond and Thompson1999) but with variance estimation  $\hat{\theta}$ accounting for sampling variability.
APPARENT SURVIVAL RATES
For the estimation of apparent survival, the data were organised into four datasets: (1) adult males, adult females and sub-adults together (dataset MFS); (2) adult males and adult females together (dataset MF); (3) adult males only; and (4) adult females only.
Investigating goodness of fit and over-dispersion
Goodness of fit of the CJS model was assessed using Program U-CARE (v.2.3.2) (Choquet et al., Reference Choquet, Lebreton, Gimenez, Reboulet and Pradel2009). Program U-CARE performs four directional χ2 tests to assess different aspects of model fit to evaluate potential issues with assumed equal survival (3.SR and 3.SM) and capture probabilities (2.CT and 2.CL) (Choquet et al., Reference Choquet, Reboulet, Lebreton, Gimenez and Pradel2005). Test 3.SR evaluates transience (see below) in the data and test 3.SM compares when previously and newly marked individuals were seen. Test 2.CT identifies trap-dependency (see below) and 2.CL evaluates the difference in the expected time of next recapture among individuals. The U-CARE program also performs a global χ2 test of the general goodness of fit which combines the statistics of the directional tests.
Transients are defined as individuals that are photographically captured only once in the study area during the study period as after the first capture they permanently emigrated from the area (Pradel et al., Reference Pradel, Hines, Lebreton and Nichols1997). These transient individuals are thus never recaptured, thereby violating the assumption of equal capture probability and potentially leading to biased estimates of population size and survival rate. Transient individuals are not to be confused with the transient killer whale ecotype of the north-east Pacific.
Although it is unlikely that actual trap-dependency (Pradel Reference Pradel, Lebreton and North1993; Pradel & Sanz-Aguilar Reference Pradel and Sanz-Aguilar2012) would occur with marine mammals that are not physically handled in photographic capture, the unequal capture probabilities between individuals could manifest itself as ‘trap-shyness’ (probability of capture decreases after first capture) or ‘trap-happiness’ (probability of capture increases after first capture) due to differences among individuals and/or in the behaviour of pods.
The amount of over-dispersion in the data was investigated with the variance inflation factor  $\hat{c}$, calculated by dividing the χ2 statistic by the degrees of freedom, with
 $\hat{c} = 1$ indicating no over-dispersion (Anderson et al., Reference Anderson, Burnham and White1994; Cooch & White, Reference Cooch and White2012). To ensure this was investigated comprehensively, four different methods were used to estimate
 $\hat{c}$ in programs U-CARE, RELEASE and MARK. Details of methods can be found in Cooch & White (Reference Cooch and White2012). Results of different methods to measure
 $\hat{c}$ were compared.
Cormack–Jolly–Seber models
Cormack–Jolly–Seber open population models (Cormack, Reference Cormack1964; Jolly, Reference Jolly1965; Seber, Reference Seber1965) implemented in program MARK were used to estimate apparent survival rates (φ) for sex/stage specific groups: adult males, adult females and sub-adults. Apparent survival includes death and permanent emigration.
Initially, adult males, adult females and sub-adults were all analysed together (dataset MFS). The CJS models assume that all individuals have the same probability of survival from one sampling occasion to another (Cormack, Reference Cormack1964; Schwarz & Seber, Reference Schwarz and Seber1999; Pledger et al., Reference Pledger, Pollock and Norris2003). However, sub-adults were likely to have lower apparent survival compared to adult individuals, so a second analysis included only adult males and adult females (MF). A third analysis estimated apparent survival separately for adult males and for adult females.
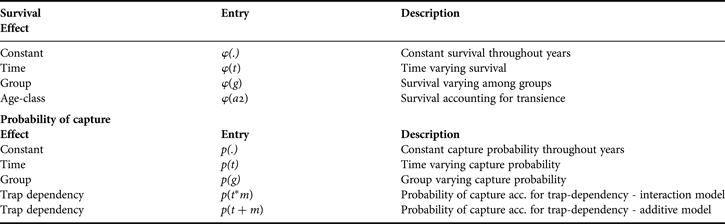
Several CJS models were constructed (Table 1), including models that allowed apparent survival and capture probabilities to be constant or to vary by time or by group (i.e. sex/stage). The interaction model φ(t) p(t*m) was built to account for the trap-dependency (m) (Sandland & Kirkwood, Reference Sandland and Kirkwood1981; Pradel, Reference Pradel, Lebreton and North1993), identified by the U-CARE goodness of fit tests (see Results). This model estimated probability of capture as a function of time, trap-dependency and the interaction of time and trap-dependency. Ignoring trap-dependency can lead into underestimation of apparent survival rates (Pradel, Reference Pradel, Lebreton and North1993; Pradel & Sanz-Aguilar, Reference Pradel and Sanz-Aguilar2012). To reduce the number of parameters in the model, an additive model where the interaction between time and trap-dependency was removed was also implemented φ(t) p(t + m). An ‘age-class model’ φ(a2) was built to account for the transience in the adult male data (Pradel et al., Reference Pradel, Hines, Lebreton and Nichols1997), identified by the U-CARE goodness of fit tests (see Results). This model estimated apparent survival separately for individuals identified as transients and for killer whales sighted regularly in the study area. Without excluding transients as a separate cohort, apparent survival of adult males could be underestimated (Pradel et al., Reference Pradel, Hines, Lebreton and Nichols1997).
Description of the Cormack–Jolly–Seber model variables used to estimate apparent survival.
Model selection was based on the quasi-likelihood Akaike's information criterion (QAICc) (Anderson et al., Reference Anderson, Burnham and White1994; Burnham & Anderson, Reference Burnham and Anderson2002), which is the AIC adjusted for small sample size and incorporating the appropriate  $\hat{c}$ value to account for the degree of over-dispersion in the data. As a conservative approach, the highest
 $\hat{c}$ value given by U-CARE, RELEASE or bootstrapping was used for correction in each analysis. The model having the lowest QAICc was considered to be the best model. Different models having ΔQAIC of less than 2 were considered to have similar support from the data. For models with similar support from the data, the model averaging procedure based on the normalized Akaike weights was applied to take account of model uncertainty (Burnham & Anderson, Reference Burnham and Anderson2002; Cooch & White, Reference Cooch and White2012).
CALVING RATES
Calving intervals and fecundity rates were obtained by direct calculations from individual capture histories of identifiable females over a period of 14 years (1989–2002), including whether or not each female had a calf born that year. Not all of the females were encountered every year. Individual encounter histories, that had a minimum of nine years between first and last sighting and had no more than two years in which the female was not seen, were included in the analysis.
RESULTS
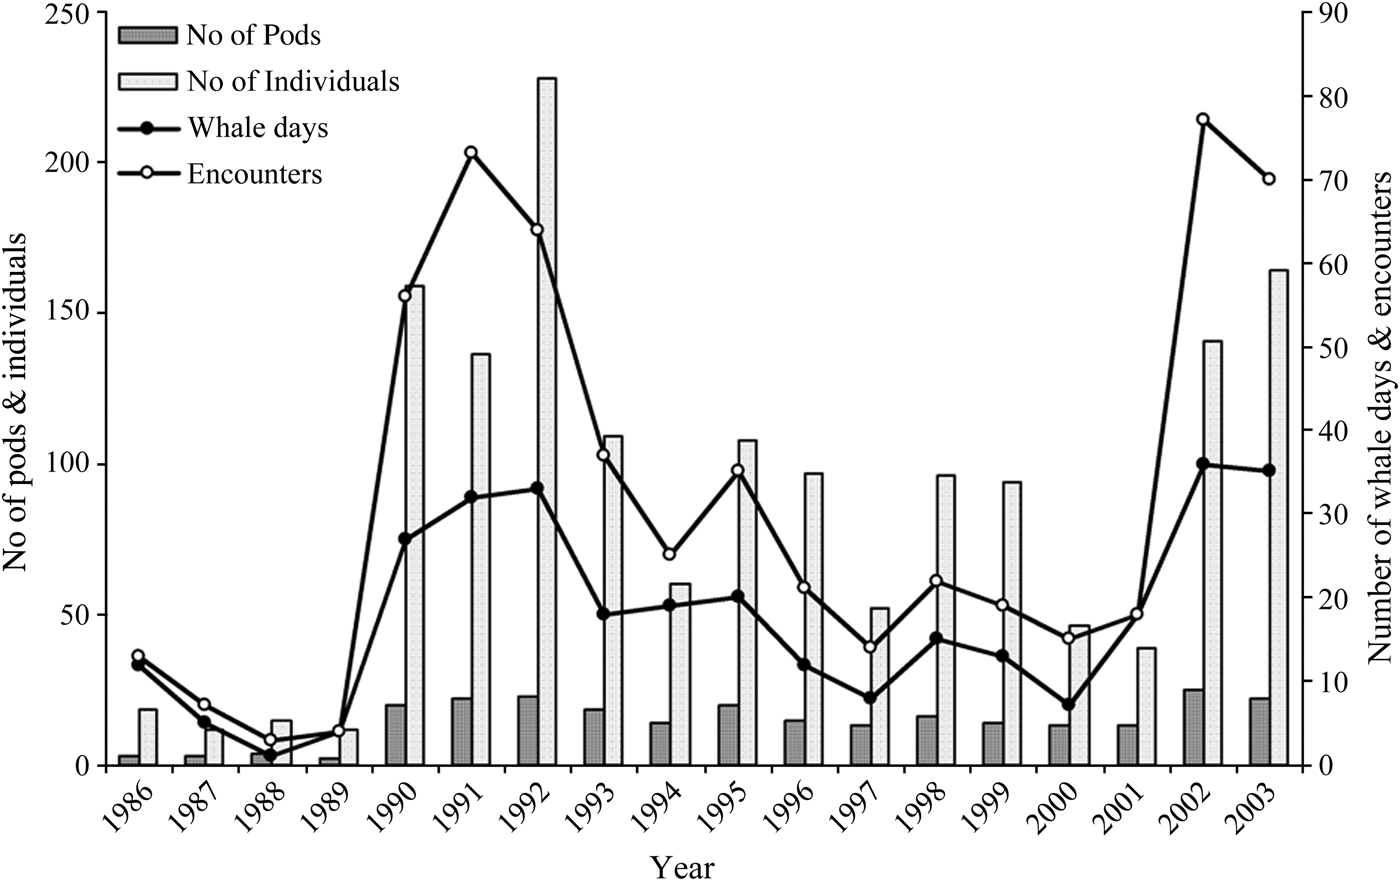
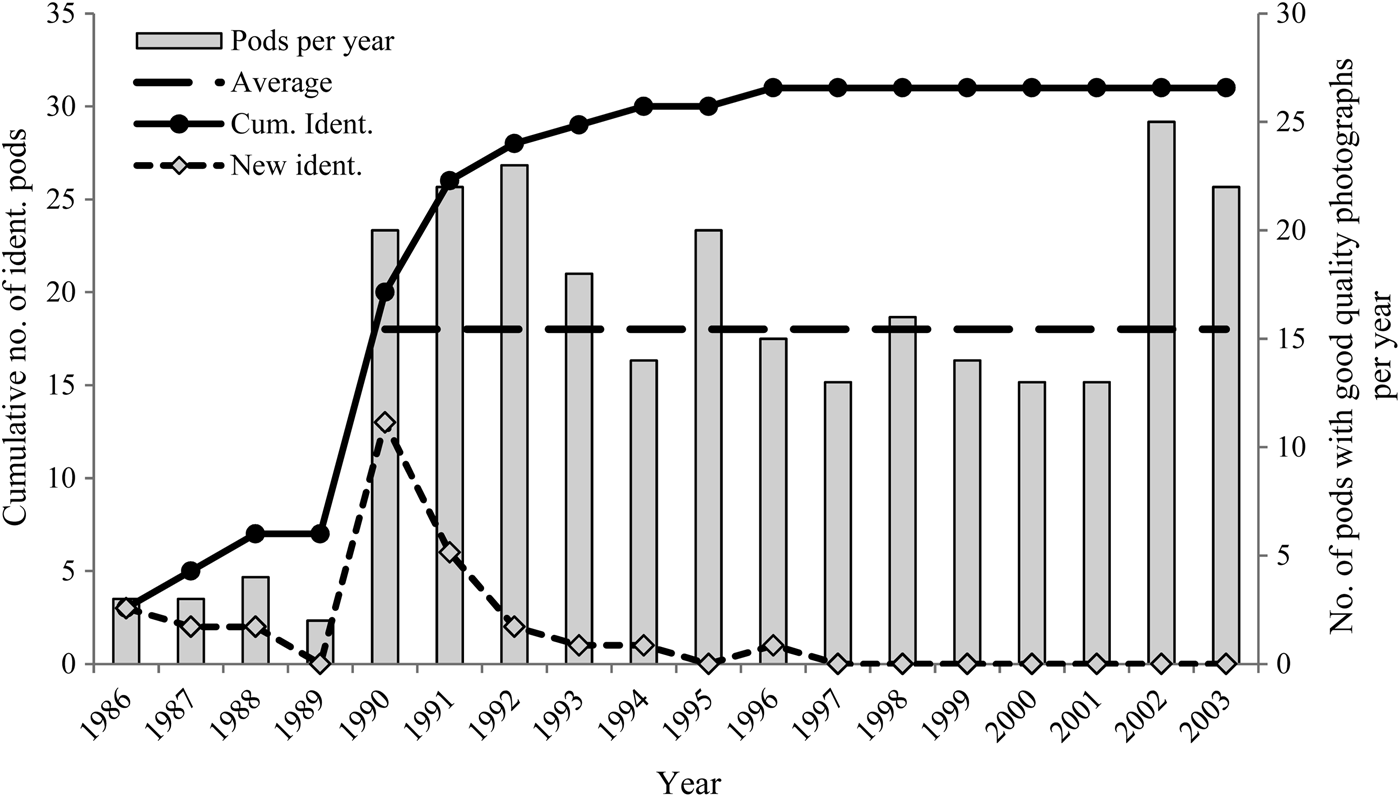
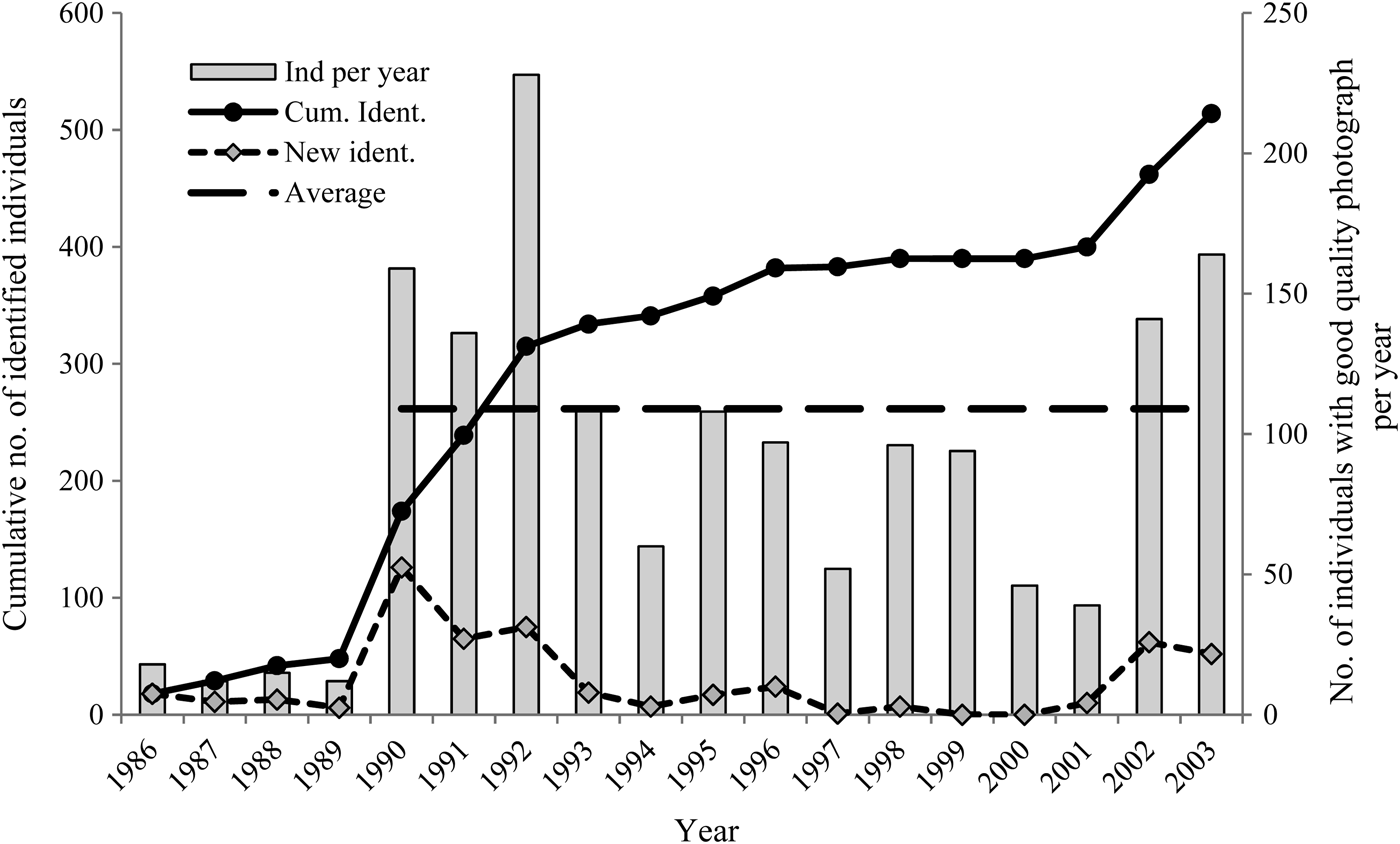
Survey effort and encounter rates were variable during 1986–2003 (Figure 2). For the 18 years investigated, a total of 573 encounters, revealing 513 identified individuals and 31 pods with good quality photographs were recorded. Most of the identified killer whale pods were encountered in the fieldwork area on multiple years during the period of 18 years, showing a high degree of return to the same location (Figure 3).
The number of days when whales were photographed (whale days), number of total encounters per year, number of pods identified per year and number of identified individuals with good quality photographs used in the analysis for each year 1986–2003.
Cumulative number of identified killer whale pods (black line), number of newly identified pods per year (dotted line) and number of killer whale pods encountered per year with good quality photographs (grey bar). The horizontal dashed line is the annual average of the number of killer whale pods encountered in 1990–2003.
The number of killer whale pods and individuals encountered per year varied (Figures 3 & 4). The number of days with whales was highest in 1990–1992 & 2002–2003 resulting in more pods and individuals encountered. The cumulative number of identified individuals increased sharply in the early 1990s with the increased fieldwork effort and levelled out towards the early 2000s (Figure 4). In 2002 and 2003 a large number of new identifiable individuals were photographed. The number of identified pods has stayed the same from 1996 onwards (Figure 3).
Cumulative number of identified killer whale individuals (black line), number of new identified individuals per year (dotted line) and number of identifiable killer whale individuals encountered per year with good quality photographs (grey bar). The horizontal dashed black line is the annual average of the number of killer whale individuals encountered in 1990–2003.
In total, 187 identifiable individuals were seen only once during the study and 97 of these were new individuals identified for the first time in either 2002 or 2003. The remaining 326 individuals (63.5%) were seen two or more times during the period of 18 years.
Estimates of population size
Sample sizes prior to 1990 were insufficient to obtain reliable estimates of population size with either the Chapman two-sample model or the annual multi-sample closed capture models and so all the results for population size are for 1990–2003.
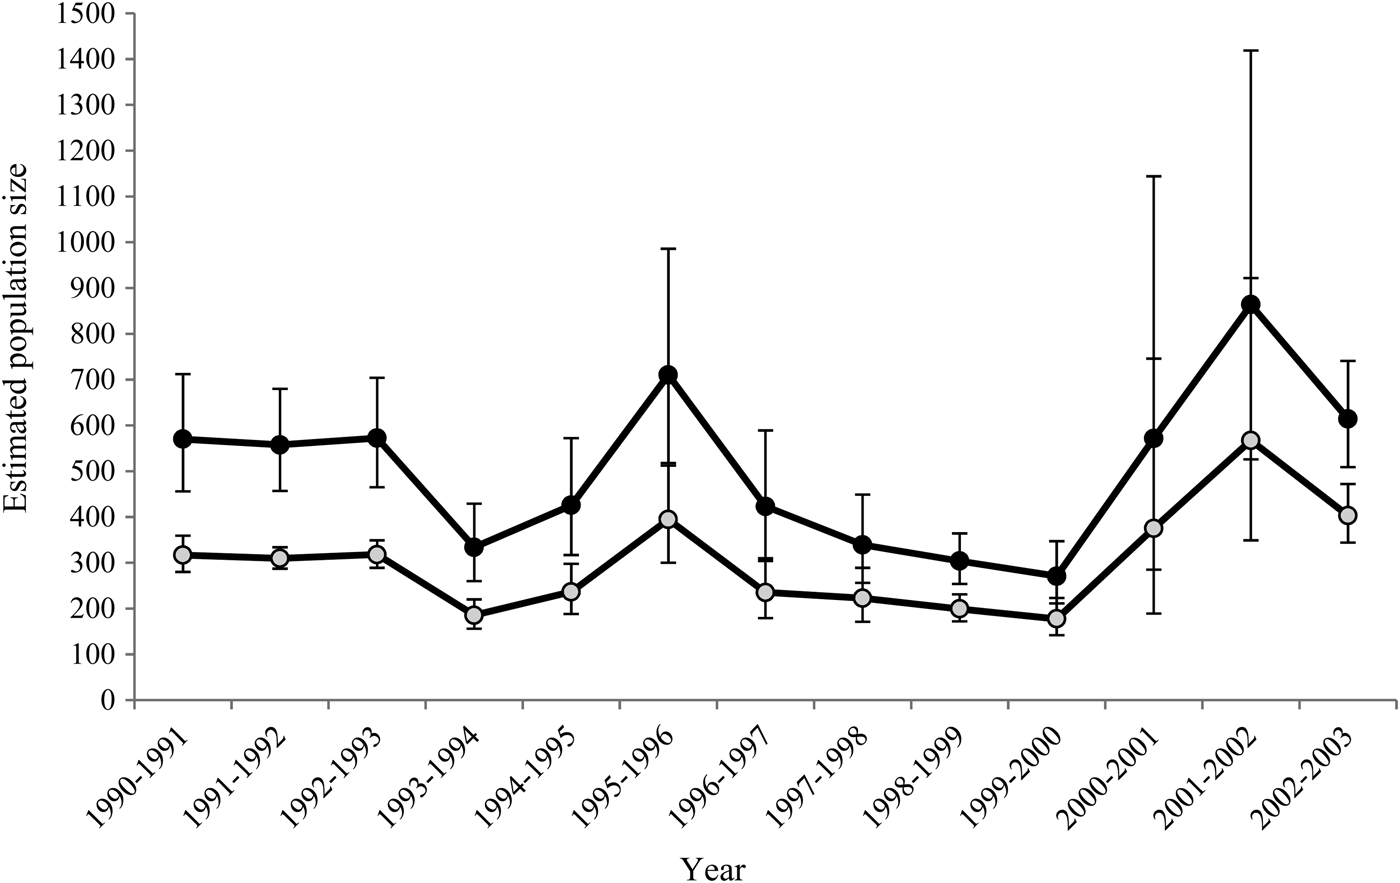
The number of identifiable individuals in the population estimated from the Chapman two-sample model varied between 178 (SE = 21) in 1999–2000 and 567 (SE = 143) in 2001–2002 (Figure 5). The standard errors for the population size estimates in 2000–2001 and 2001–2002 are very high. The number of identified individuals per year was low in 2000 and 2001 (Figure 2) and these low sample sizes resulted in low precision of the estimated abundance. In 2002–2003 the estimated number of identifiable individuals was 403 (SE = 33).
Chapman two-sample estimates of the number of identifiable individuals ( $\widehat{N}$) (grey circles) and total population size (
 $\widehat{N}_{tot}$) (black circles). 95% CI calculated assuming estimates are log-normally distributed.
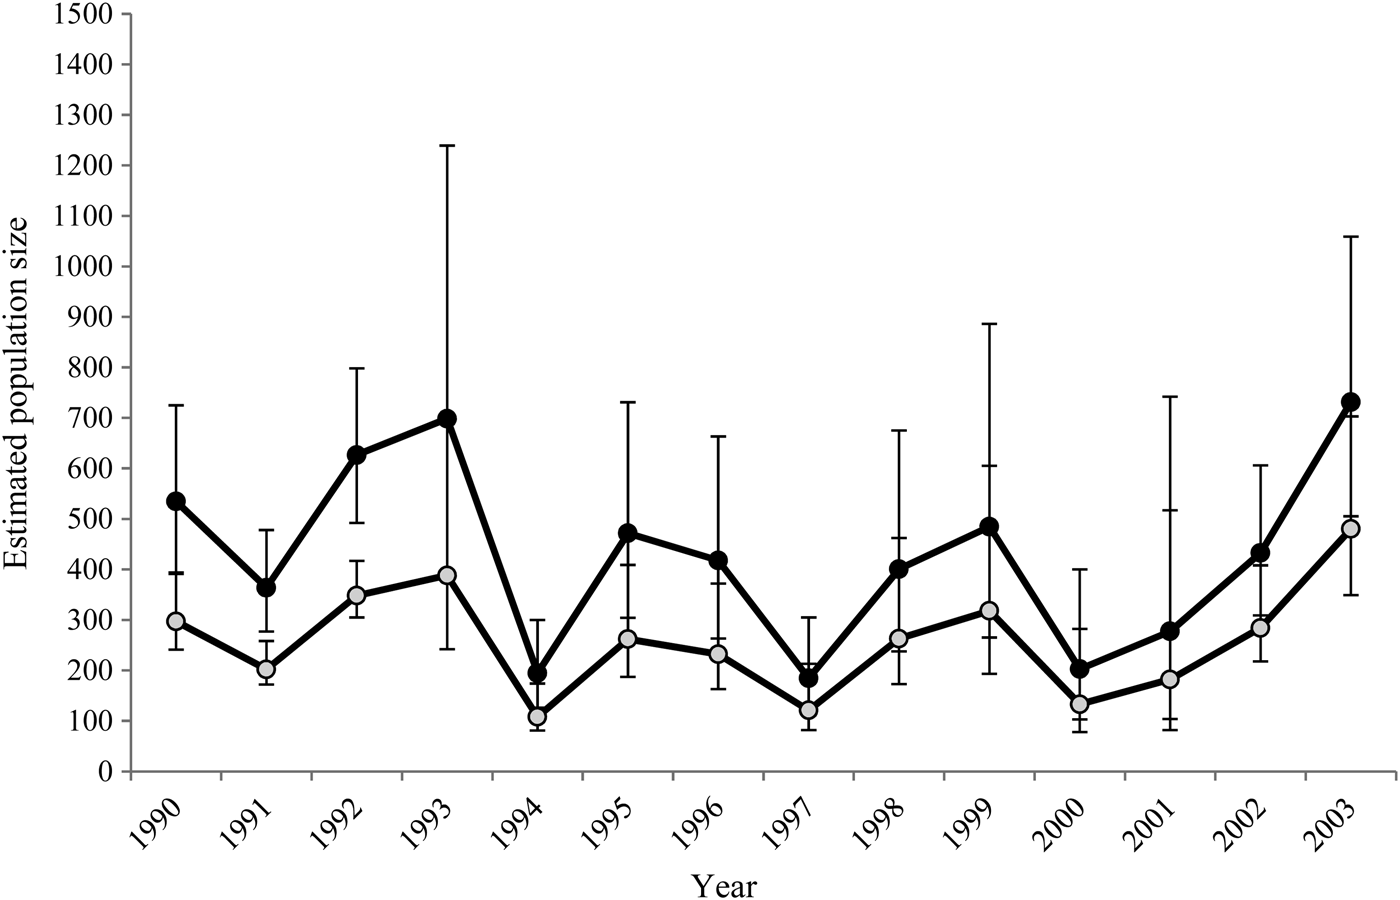
Based on model assumption χ2 tests run within program CAPTURE, taking heterogeneity into account is important. For the multi-sample closed model estimates within years, two models were chosen by MSC to estimate yearly population size of identifiable individuals: (1) model M(th)Chao that allows capture probability to vary by time and individual; and (2) model M(t)Chao allowing capture probabilities to vary by time (Chao et al., Reference Chao, Lee and Jeng1992). Model M(th)Chao was selected as a better model nine times out of fourteen years based on MSC compared to model M(t)Chao. Model M(th)Chao generated higher estimates of population size than model M(t)Chao for all years indicating that not taking heterogeneity into account was likely causing a negative bias. For consistency, estimates of the number of identifiable individuals from model M(th)Chao are considered as best estimates for all years and are presented in Figure 6. The estimated number of identifiable individuals varied between 108 (SE = 22) in 1994 and 480 individuals (SE = 88) in 2003.
Estimates of the number of identifiable individuals ( $\widehat{N}$) (grey circles) and total population size (
 $\widehat{N}_{tot}$) (black circles) within years using the closed model M(th)Chao with 95% CIs.
TOTAL POPULATION SIZE
The proportion of identifiable individuals in the population was estimated to be 0.556 (SE = 0.052) for 1990–1995 and 0.656 (SE = 0.034) for 1997–2003.
Estimates of total population size using the estimates of the number of identifiable individuals for pairs of years are given in Figure 5. These estimates varied between 271 (SE = 34) in 1999–2000 and 864 (SE = 222) in 2001–2002. Again the standard errors are high for the estimates for 2000–2001 and 2001–2002.
The within-year estimates from the M(th)Chao model with the correction of the proportion of identifiable individuals give estimates of total population size between 184 (SE = 48) in 1997 and 731 (SE = 139) in 2003 (Figure 6). These results represent the estimate of the number of animals in the population using the fjord system in any given year.
Survival
GOODNESS OF FIT AND OVER-DISPERSION
The global goodness of fit test in program U-CARE showed significant departures from adequate model fit for dataset MFS, dataset MF and for adult males and adult females separately (P < 0.001). For the directional tests, the subtest within Test 3.SR with adult males showed an indication of transience (P = 0.001) but its influence was not substantial resulting in the overall 3.SR test being supported (P = 0.305).
Test 2.CT showed a highly significant (P < 0.001) result for trap-dependency for adult males. Test 2.CT also gave a significant (P < 0.001) result for trap-dependency for adult females, but this resulted from only two years of the dataset showing significance. Trap-dependency in all cases was ‘trap-happiness’, meaning that recapture probability in subsequent years of initial capture was higher than expected by chance. The tests 3.SM and 2.CL were non-significant for all datasets. None of the results of the directional tests were significant for sub-adults.
Overall,  $\hat{c}$ varied between 1.18 and 1.65 for dataset MFS, between 1.18 and 2.03 for dataset MF, between 1.18 and 2.21 for adult males and between 1.29 and 1.79 for adult females. Over-dispersion in the data was thus not sufficient to cause any unacceptable lack of model fit (
 $\hat{c} \lt 3$) (Lebreton et al., Reference Lebreton, Burnham, Clobert and Anderson1992; Burnham & Anderson, Reference Burnham and Anderson2002).
MODEL SELECTION
Model selection diagnostics for CJS models of dataset MFS, dataset MF and of adult males and adult females are presented in the Supplementary Material. For the MFS dataset, the best support was given to model φ(g) p(t) estimating apparent survival as constant for each sex/stage and with time varying capture probability. The best model for dataset MF estimated constant apparent survival for both sexes together and accounted for variation in group and time and trap-dependency in capture probabilities (model φ(.) p(g + t + m)). Model φ(.) p(t + m) also received good support from the data.
For adult males the best model was the ‘age-class’ model φ(a2) p(t + m). The second best model φ(.) p(t + m) also had high support (ΔQAICc = 0.5). Both of these models accounted for trap-dependency in capture probabilities. The best model for adult females was the model estimating apparent survival as constant accounting for trap-dependency in capture probabilities with the additive model φ(.) p(t + m).
ESTIMATES OF APPARENT SURVIVAL
Sub-adults had a constant apparent survival of 0.768 (SE = 0.04, 95% CI = 0.682–0.837) with the best model φ(g) p(t). For adults only (dataset MF), the two models with similar support from the data both gave a constant apparent survival for adult males and adult females together as 0.981 (SE = 0.006, 95% CI = 0.965–0.990).
For adult males, the best fitting model gave an estimate of apparent survival excluding the transients of 0.980 (SE = 0.009, 95% CI 0.952–0.991) and an estimate of apparent survival of 0.923 (SE = 0.034, 95% CI 0.823–0.969) for the transients. The second best model gave constant apparent survival of 0.971 (SE = 0.008, 95% CI = 0.950–0.983). The model averaged estimate of adult male apparent survival was 0.977 (SE = 0.011, 95% CI = 0.943–0.991). For adult females, the best model gave a survival estimate of 0.977 (SE = 0.009, 95% CI = 0.951–0.989), slightly higher than for adult males with the same model.
Calving rates
Data from ten identifiable females were used to estimate calving rates with individual encounter histories in 1989–2002. In total 25 calves were recorded for these females. Calving intervals ranged from 3 to 14 years (mean = 5.06, SE = 0.722). Females in northern Norway were calculated to have an average fecundity rate of 0.197 calves per year (range 0.07–0.31, SE = 0.065).
DISCUSSION
Model selection and analysis
Goodness of fit tests showed that adult males and adult females were subject to heterogeneity of capture probabilities, more specifically significant trap-dependency which in all cases was ‘trap-happiness’, i.e. increased capture probability after first capture. It is unlikely that actual trap-dependency occurs as killer whales are not physically handled in photographic capture but more likely it is a proxy for something else, e.g. indicating differences in sighting probabilities (Sandland & Kirkwood, Reference Sandland and Kirkwood1981; Pradel, Reference Pradel, Lebreton and North1993; Pradel & Sanz-Aguilar, Reference Pradel and Sanz-Aguilar2012).
Killer whales live in stable family pods and are, therefore, encountered as groups rather than as independent individuals, violating the assumption of equal sighting probability. Additionally, variability in the behaviour of different pods exists, e.g. some pods are less bothered about surrounding boats and are easier to approach for photographing, further compromising the assumption of equal capture probability. Different killer whale pods might also have area preferences within the study area and as some areas were surveyed more often, it is possible that some pods and individuals were captured more often than by chance. The sampling methodology itself might also have caused heterogeneity in sighting probabilities. All these issues might lead to trap-dependency showing in the dataset. Guided by the U-CARE test results, trap-dependency was taken into account in appropriate models within the CJS analysis, as has been done with some other studies on marine mammals, e.g. manatees, blue and humpback whales (Langtimm et al., Reference Langtimm, O'Shea, Pradel and Beck1998; Ramp et al., Reference Ramp, Bérubé, Hagen and Sears2006, Reference Ramp, Bérubé, Palsbøll, Hagen and Sears2010). Results showed that for adult males and adult females, incorporating trap-dependency improved the models. In most cases, incorporating trap-dependency in addition to time gave the best fit. The issue of temporary emigration, a phenomenon that could imitate trap-dependency, will be investigated in future analysis of the data.
Goodness of fit tests also indicated some evidence of transience in the data for adult male killer whales. In analysis, an age-class model improved the model fit. The estimate of apparent survival for adult males was higher when excluding the transients (0.980) than when they were not excluded (0.971). There was no evidence of transience in the data for adult females. It is understandable that transience did not show for females because they need to be encountered for several years before assigning them as adult females compared to adult males which can be assigned as a male on first sighting based on their tall dorsal fin. It has also been suggested that some of the males in northern Norway have a nomadic lifestyle rather than living in stable family pods (Bisther & Vongraven, Reference Bisther, Vongraven, Blix, Walloe and Ulltang1995), which could be perceived as transience in the goodness of fit tests. These nomadic males could have previously been part of a pod, but be separated from the rest of the pod after their mother died. Whether or not these nomadic individuals have a different range from the individuals living in pods and whether or not they are more occasional visitors in the study area is not known.
Apparent survival of juveniles and calves could not be estimated as there were limited data of these sex/stages. Also with the very limited information, there was difficulty specifying their age correctly and assigning them to the correct stage-groups.
Population size
Killer whales are found all along the coast of Norway with concentrations in Lofoten, Møre and Finnmark (Christensen, Reference Christensen1982). Christensen (Reference Christensen, Sigurjónsson and Leatherwood1988) estimated that at least 1500 killer whales were present in coastal waters of Norway when the herring was in this area during January to March. The North Atlantic Sighting Survey (NASS) estimated 7000 killer whales in Norwegian waters (Øien, Reference Øien1993) in summer 1989. However, these whales are likely to belong to a number of different populations. About 490–550 killer whales were previously estimated in the NSS herring wintering areas during October to January based on photo-identification data and mark–recapture analysis during the years 1990–1993 (Similä & Christensen, Reference Similä and Christensen1992; Similä, Reference Similä1997a).
The highest total population size estimate for an individual year presented in this study was, in 2003, about 700 individuals (model M(th)Chao, SE = 139, 95% CI = 505–1059). The analysis for pairs of years gave the highest estimate of total population size in 2001–2002, about 860 individuals, but the standard error for this estimate was very high. In this analysis information of the proportion of identifiable individuals was incorporated, thereby generating higher estimates of population size compared to previous estimates. However, the size of the population that used the fjords may still be underestimated.
A high number of new identifiable individuals were recorded during 2002 and 2003. As killer whales become individually identifiable by natural markings after about the age of three (Ford et al., Reference Ford, Ellis and Balcomb2000), it can be assumed that these new killer whale individuals were born sometime in the late 1990s. This period corresponds to a very high NSS herring spawning stock biomass of about 10 million tonnes inside the fjords (Toresen & Østvedt, Reference Toresen and Østvedt2000; Orellana, Reference Orellana2006). It is possible that the increased food abundance led to an increase in killer whale fecundity at this time. This would be interesting to study further, as also suggested by Ward et al. (Reference Ward, Holmes and Balcomb2009) and Ford et al. (Reference Ford, Ellis, Olesiuk and Balcomb2010) with respect to resident killer whales and the high abundance of Chinook salmon in the north-east Pacific.
Photographic methodology changed from film to digital in 2001 and it is also possible that the change in methodology has had the effect of increased number of new identified individuals in 2002 and 2003. The number of photographs taken is greater with digital cameras, a greater proportion of digital photographs can be suitable for analysis compared to film photographs and the quality of photographs can be better (Markowitz et al., Reference Markowitz, Harlin and Würsig2003). The new identified individuals in 2002 and 2003 represented a range of sex/stage groups from juveniles to adult individuals. This implies that the large number of new identifiable individuals cannot fully be explained by the increased food hypothesis. Changes in data collection methods may therefore at least partly explain the high number of new identified individuals in 2002 and 2003, whereby digital photography might have increased the potential to identify more individuals.
Estimates of annual total population size varied substantially among years. These results represent the number of individuals estimated to have used the study area in a particular year, and do not necessarily indicate the size of the total northern Norwegian killer whale population. This kind of variation from year to year would be expected if the whole population was not present in the fjords every year but was spread out over a larger area during the fieldwork season.
As shown by the satellite tagging experiments in 2000 and 2001 (Stenersen & Similä, Reference Stenersen and Similä2004) some killer whales emigrated temporarily from the fjord area, likely to keep track of the NSS herring distribution. This would lead to a situation where not all individuals were available to be captured in the study area. It was noted during some years that the number of killer whale sightings was low, despite comparable effort to other years. This may be in response to changes in NSS herring abundance and resulting variation in distribution inside the fjord system and/or higher temporary emigration rates in a particular year.
Survival
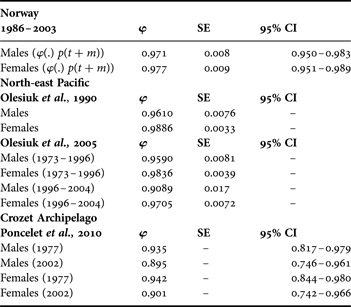
The apparent survival rate estimates presented here are the first ones for northern Norwegian killer whales. Compared to resident killer whales in the north-east Pacific, adult males in northern Norway had higher estimated survival rates (Table 2). The highest apparent survival for north-east Pacific adult male killer whales was estimated with both cropped (previously exploited) and non-cropped pods together to be 0.9610 (SE = 0.0076) (Olesiuk et al., Reference Olesiuk, Bigg and Ellis1990). This analysis had southern and northern residents combined. Including the previously exploited pods in the analysis might result in the estimated survival rate being higher as a result of density dependent effects due to recovery from previous removals from the population. However, no evidence was found in the study by Olesiuk et al. (Reference Olesiuk, Bigg and Ellis1990) that life history parameters would have been affected by previous exploitation.
Estimates of apparent survival for adult male and adult female killer whales from northern Norway, north-east Pacific (Olesiuk et al., Reference Olesiuk, Bigg and Ellis1990, Reference Olesiuk, Ellis and Ford2005) and the Crozet Archipelago (Poncelet et al., Reference Poncelet, Barbraud and Guinet2010).
When comparing results between adult females, the northern Norwegian killer whales had lower apparent survival rates than those in the north-east Pacific (Table 2). Except, in 1996–2004, Olesiuk et al. (Reference Olesiuk, Ellis and Ford2005) estimated apparent adult female survival to be 0.9705 (SE = 0.0072) for all age-classes combined which was closest to the estimate of adult female survival in northern Norwegian killer whales. In the Norwegian data, adult females included both reproductive and post-reproductive females. Mortality has been recorded to increase with the start of reproductive senescence in killer whale females around the age of 40 (Olesiuk et al., Reference Olesiuk, Ellis and Ford2005) and combining both reproductive and post-reproductive aged females does not account for differences in age-specific survival.
Differences in estimated survival rates between Atlantic and Pacific killer whale populations are potentially due to location specific ecological features and/or differences in human induced pressures, e.g. noise (Erbe, Reference Erbe2002; Morton & Symonds, Reference Morton and Symonds2002), traffic (Lusseau et al., Reference Lusseau, Bain, Williams and Smith2009) or contaminants (Ross et al., Reference Ross, Ellis, Ikonomou, Barrett-Lennard and Addison2000; Wolkers et al., Reference Wolkers, Corkeron, Van Parijs, Similä and Van Bavel2007; Cullon et al., Reference Cullon, Yunker, Alleyne, Dangerfield, O'Neill, Whiticar and Ross2009). Killer whales are highly specialized predators (Guinet, Reference Guinet1991; Similä et al., Reference Similä, Holst and Christensen1996; Ford et al., Reference Ford, Ellis, Barrett-Lennard, Morton, Palm and Balcomb1998; Reisinger et al., Reference Reisinger, de Bruyn, Tosh, Oosthuizen, Mufanadzo and Bester2011a) and the difference in diet between these locations could lead to differences seen in population parameters. Killer whales in Pacific have been recorded to respond to changes in their prey abundance with changes in their survival rate (Ford et al., Reference Ford, Ellis, Olesiuk and Balcomb2010; Ward et al., Reference Ward, Semmens, Holmes and Balcolm2011), indicating that prey availability plays an important part on determining survival rates. The datasets also differ between locations, as in northern Norway only a proportion of the individuals in the population are identified compared to resident killer whale populations in the north-east Pacific where all individuals are identified and catalogued. This could cause differences in the results between these two locations.
Comparison of apparent survival rates between northern Norway and the Crozet Archipelago (φ = 0.895–0.942, Poncelet et al., Reference Poncelet, Barbraud and Guinet2010) shows that both adult males and adult-females in Norway had higher estimated apparent survival rates (Table 2). Human impacts on killer whales in the Crozet Archipelago due to lethal interactions with the long-line fisheries are causing concern about the viability of the decreasing population (Poncelet et al., Reference Poncelet, Barbraud and Guinet2010; Tixier et al., Reference Tixier, Gasco, Duhamel, Vivant, Authier and Guinet2010). Killer whales in the Crozet Archipelago have a very different diet, varying from fish to marine mammals (Guinet, Reference Guinet1991), compared to Norwegian fish-eating killer whales. Additionally a decline in the elephant seal population in the Crozet Islands (Guinet et al., Reference Guinet, Jouventin and Weimerskirch1999) may have influenced the low estimated survival rates as this is an important prey species for killer whales in this area. These location specific variables likely explain the difference in estimates of apparent survival rates between Norway and the Crozet Archipelago.
A consistent result among northern Norway, north-east Pacific and the Crozet Archipelago was that adult male killer whales had lower apparent survival compared to adult females. These differences were smaller within the northern Norwegian population than differences between males and females in the north-east Pacific (Olesiuk et al., Reference Olesiuk, Bigg and Ellis1990, Reference Olesiuk, Ellis and Ford2005). Killer whales as a long-living species follow the typical mammalian U-shaped mortality curve, where the very youngest and oldest individuals have the highest mortality rates (Caughley, Reference Caughley1966; Olesiuk et al., Reference Olesiuk, Bigg and Ellis1990). Sex-specific differences are expected in this curve because male killer whales have a shorter expected lifespan compared to females (Ford et al., Reference Ford, Ellis and Balcomb2000; Olesiuk et al., Reference Olesiuk, Ellis and Ford2005) leading to the mortality curve being narrower. Killer whale females go through a period of extremely low mortality during their reproductive phase (Olesiuk et al., Reference Olesiuk, Ellis and Ford2005), differentiating them from male life history.
The increased information on population parameters from locations around the world contributes to current knowledge of killer whales as a species and can help to better understand the influences that different ecological or manmade pressures have on killer whale populations and to guide making more informed management decisions. The new results for the survival rate of northern Norwegian killer whales add to this existing knowledge of population parameters and are a key component on monitoring the status of this particular Norwegian population.
Previous work on satellite tagged killer whales in northern Norway showed that killer whales from this population occasionally left the study area to track and follow their herring prey during winter (Stenersen & Similä, Reference Stenersen and Similä2004). This kind of movement in and out of the study area could cause negative bias in survival rate estimates (Fujiwara & Caswell, Reference Fujiwara and Caswell2002). This issue of temporary emigration and its potential effect on apparent survival estimates is addressed in future analysis of this dataset.
Based on the Norwegian Institute of Marine Research surveys, part of the NSS herring stock started to winter in a new area offshore in the Norwegian Sea from 2002 onwards leading to the abundance of NSS herring inside the fjords declining thereafter (Orellana, Reference Orellana2006; Huse et al., Reference Huse, Fernö and Holst2010). Whether or not this large scale change in distribution of this killer whale population's main prey has negatively affected survival by increasing killer whale travelling time and decreasing time spent foraging and socializing is unknown. The abundance of NSS herring might also play a role in survival rates of killer whales in northern Norway in a similar way that Chinook salmon availability has been found to affect Chinook salmon feeding killer whale survival in the north-east Pacific (Ford et al., Reference Ford, Ellis, Olesiuk and Balcomb2010; Ward et al., Reference Ward, Semmens, Holmes and Balcolm2011). However, the decrease of NSS herring abundance was due to changes in distribution rather than to a decline in the total NSS herring biomass.
Killer whales in northern Norway feed using a method called ‘carousel feeding’ (Similä & Ugarte, Reference Similä and Ugarte1993; Similä, Reference Similä1997b). This behaviour decreased towards the end of the 1990s and at beginning of the 2000s, at the same time as the commercial NSS herring fishery rapidly increased, including in the fjord area (Similä, Reference Similä2005; Pilling et al., Reference Pilling, Nichols, Hoel, Hough and Davies2009). The total NSS herring landings peaked in 1997; up to 1.5 million tonnes were caught annually (Pilling et al., Reference Pilling, Nichols, Hoel, Hough and Davies2009; Det Norske Veritas, Reference Det Norske2011). From the end of the 1990s killer whales were found more often feeding around the fishing boats (e.g. purse seine vessels) catching the fish falling from the nets and vessels. At the same time the number of new nicks on identifiable killer whale individuals increased, potentially partly due to increased contact with the fishing gear. This is supported by the 10% increase in the estimated proportion of identifiable individuals in the population in this study during the same time period (see Results). There have been only a few recorded incidents of killer whales becoming entangled in the fishing gear in this area. However, this increased interaction with fisheries could potentially negatively affect survival. Lethal interactions between killer whales and fisheries are reported from Prince William Sound in Alaska (Matkin et al., Reference Matkin, Saulitis, Ellis, Olesiuk and Rice2008) and from Possession Island (Poncelet et al., Reference Poncelet, Barbraud and Guinet2010) but these interactions have been with long-lines rather than nets.
Killer whales in northern Norway carry extremely high levels of contaminants (Wolkers et al., Reference Wolkers, Corkeron, Van Parijs, Similä and Van Bavel2007), making them the Arctic mammal species with the highest recorded contaminant levels. These high contaminant levels could potentially have a negative effect on the health and survival rates of killer whales (Cullon et al., Reference Cullon, Yunker, Alleyne, Dangerfield, O'Neill, Whiticar and Ross2009; Krahn et al., Reference Krahn, Hanson, Schorr, Emmons, Burrows, Bolton, Baird and Ylitalo2009; Ward et al., Reference Ward, Semmens, Holmes and Balcolm2011). Sex and age of an individual influence the amount of contaminants accumulated, reproductive females usually having lower contaminant levels compared to adult males and juveniles due to transferring part of their contaminant load to their calves through gestation and lactation (Ross et al., Reference Ross, Ellis, Ikonomou, Barrett-Lennard and Addison2000, Hickie et al., Reference Hickie, Ross, Macdonald and Ford2007; Krahn et al., Reference Krahn, Hanson, Schorr, Emmons, Burrows, Bolton, Baird and Ylitalo2009). The estimated survival rates for the northern Norwegian adult male killer whales are the highest reported among killer whale populations globally, indicating that the Norwegian population seems currently to be coping with this pressure. Only long-term future monitoring will be able to determine whether or not the contaminant load on these animals might affect survival in years to come.
Calving rates
The calving rates presented here are the first ones for the northern Norwegian killer whale population. Calving intervals for northern Norwegian killer whales varied between 3 and 14 years, with a mean interval of 5.06 years, which was closest to the calculation for unexploited resident killer whales in the northeast Pacific (Olesiuk et al., Reference Olesiuk, Bigg and Ellis1990). For north-east Pacific resident killer whales, Olesiuk et al. (Reference Olesiuk, Bigg and Ellis1990) calculated calving intervals similar to Norwegian killer whales, ranging between 2 and 12 years (mean = 5.86 years) for previously exploited pods and between 2 and 10 years (mean = 5.02 years) for unexploited pods. Using a much longer dataset including only northern resident killer whales, the calving interval was estimated to be between 2 and 14 years (mean = 4.88 years using a model with unrestrained population growth and mean = 5.53 years using a model with no net population change) (Olesiuk et al., Reference Olesiuk, Ellis and Ford2005). The average fecundity rate was 0.197 calves/year (SE = 0.065) in northern Norway, which is comparable to the estimates for the north-east Pacific resident killer whales (0.18–0.21) (Olesiuk et al., Reference Olesiuk, Bigg and Ellis1990, Reference Olesiuk, Ellis and Ford2005).
There have been relatively recent removals from this Norwegian killer whale population. Catches through the 1930s–1980s in the Lofoten area totalled 662 individuals with the majority of catches taken in 1978–1981. In 1979 alone, 219 individuals were taken in the Lofoten area (Christensen, Reference Christensen1982; Øien, Reference Øien, Sigurjónsson and Leatherwood1988) from the population under study here. These kinds of removals could be expected to change the sex and age composition of the population, as was reported for the southern resident community after live-capture catches (Olesiuk et al., Reference Olesiuk, Bigg and Ellis1990). Catches could therefore affect reproductive potential (Ward et al., Reference Ward, Holmes and Balcomb2009), especially if individuals of reproductive age have been removed. Density dependent responses to a reduction in population size would be expected to lead to a recovery in population size. A study on resident killer whales in the north-east Pacific did not find responses of life history parameters to density dependency, but has shown that killer whales could respond through changes in the reproductive rates (Olesiuk et al., Reference Olesiuk, Bigg and Ellis1990). The data from this study on the Norwegian killer whale population were not detailed enough to investigate age specific fecundity, change in the age at maturity or changes in fecundity rates.
Overall, there were data limitations for calculating calving rates for northern Norwegian killer whales, and these results should therefore be interpreted with caution. A longer dataset and a larger number of females with more complete sighting histories included into the analysis would increase the reliability of the result. Continuation of the long-term photo-identification study is greatly encouraged to be able to analyse calving rates in more detail.
ACKNOWLEDGEMENTS
Over the period 1986–2003, 58 people participated in the fieldwork. We want to thank in particular Fernando Ugarte, George McCallum, Thomas Lyrholm, Bo Johanneson, Hanne Strager and Ana Catarina Alves for their contribution. Christian Ramp is thanked for helpful analysis discussions, and the anonymous referee for comments that helped improve the manuscript.
FINANCIAL SUPPORT
This study was funded by the Norwegian Research Council, WWF Sweden, the Academy of Finland, Tampereen Särkänniemi, Sea World Inc., the Alfred Kordelin Foundation, the Norwegian Institute of Marine Research, Canon and Discovery Initiatives. S.K. was supported by a studentship through the University of St Andrews.
Supplementary materials and methods
The supplementary material refered to in this article can be found online at journals.cambridge.org/mbi.