I. INTRODUCTION
Organic pollutants such as phenolic compounds have caused environmental pollution on a global scale including surface and ground water.Reference Taraba and Bulavova1–Reference Bennani, Perez-Rodriguez, Alani, Smith, Rietveld, Zeman and Smets3 Phenol and phenolic derivatives are released from many industries such as pharmaceutical, petroleum, pesticides, plastic and other manufactures. Because of their toxicity and adverse effects on the environment, phenolic compounds are listed as priority pollutants by the United States Environmental Protection Agency (EPA). So wastewaters containing these pollutants must be appropriately treated before discharging into the environment.
Various methods such as chemical oxidation,Reference Badmus, Tijani, Massima and Petrik4 photochemical catalysis,Reference Nie and Zhang5 biological degradation,Reference Kahoush, Behary, Cayla and Nierstrasz6 and adsorptionReference Jiang, Shang, Heijman and Rietveld7 have been extensively used to remove organic pollutants from aqueous solutions. Among these methods, adsorption is gaining popularity due to its efficiency in dealing with various pollutants compared to other procedures.Reference Ozcan, Tor, Aydin, Beduk and Akin8,Reference Asmaly, Ihsanullah, Abussaud, Saleh, Laoui, Gupta and Atieh9
The removal of organic pollutants by polymeric hydrogels with different functional groups has been widely studied.Reference El-Hamshary, El-Sigeny, Taleb and El-Kelesh10,Reference Feng, Ding, Yang, Wang, Li, Liao, Li and Chen11 Among the numerous polymers that have been used for the preparation of hydrogels, natural polymers such as polysaccharides are often preferred in comparison to synthetic polymers due to their nontoxicity, low cost, free availability, and biodegradability. However, hydrogels inevitably swell under specific conditions, which leads to drastic deterioration of their mechanical properties.Reference Kamata, Akagi, Kayasuga-Kariya, Chung and Sakai12 Recently, the design and formation of novel network structures in gels, such as double networks and nanocomposites, have been proposed to improve the mechanical properties of hydrogels.Reference Pinkas, Haneman, Chemke and Zilberman13,Reference Fan, Liao, Zhang and Liu14
Double-network gels consist of two interpenetrating polymer networks, in which the first network is densely crosslinked, making it stiff while the other network is sparsely crosslinked, making it soft and stretchable.Reference Wang, Wei, Su, Qiu and Wang15 In nanocomposite hydrogels, uniformly dispersed inorganic nanofillers, acting as crosslinking agents, are associated with flexible polymer chains by physical or chemical interactions to form a homogenous network structure with enhanced mechanical properties.Reference Badakhshanian, Hemmati and Ghaemy16 Graphene oxide (GO) is one of the most important derivatives of graphene. There are many oxygen-containing functional groups on the GO sheets such as epoxy, hydroxyl, and carboxyl groups, which allow GO to be further functionalized for hybridization with other materials to form nanocomposite materials.Reference Li, Qi, Tu, Wang, Chen and Wang17 In addition, the hydrophilicity and the large surface area serve GO as an ideal adsorbent in water treatment.Reference Duru, Ege and Kamali18
In view of these facts mentioned above, double network composite hydrogels (DNCHs) were prepared in the present research by combining the unique characteristics of the conventional double network hydrogels and nanocomposite hydrogels. In the composite, crosslinked hydroxypropyl cellulose (HPC) was prepared first to form a single network, and then GO formed another network through chemical crosslinking across the network of HPC. The formation of the second GO network improved the mechanical properties, which made the hydrogel stronger and more stable. The resulting single and DNCHs were used as adsorbents for the removal of phenol from aqueous solutions. Their batch and dynamic adsorption behaviors were systematically investigated.
II. EXPERIMENTAL
A. Materials
Graphite powder was purchased from Qingdao Graphite Co., Ltd. (Qingdao, China). Hydroxypropyl cellulose (HPC, average M w ∼ 80,000) and polyethyleneimine (PEI, M n ∼ 10,000) were purchased from Sigma-Aldrich Chemical Co. (St. Louis, Missouri). Sodium hydroxide, aqueous ammonia solution (25%), and epichlorohydrin were purchased from Sinopharm Chemical Reagent (Shanghai, China).
B. Preparation of composite hydrogels
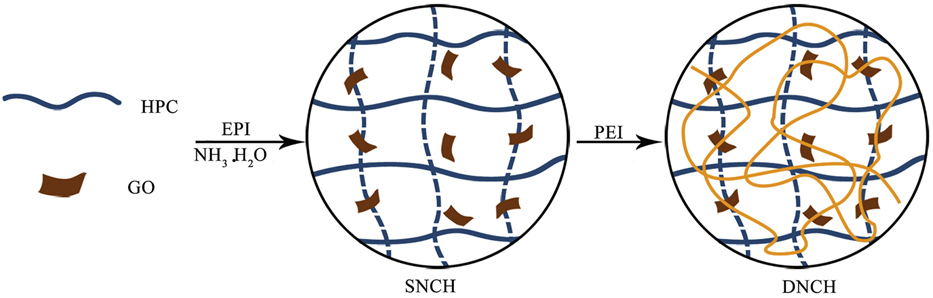
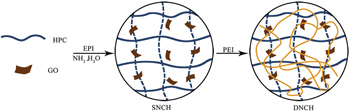
Scheme 1 illustrates the fabrication process of single network composite hydrogel (SNCH) and DNCH. GO was first prepared by the modified Hummers’ method.Reference Hummers and Offeman19 Then, GO was dispersed in deionized water and sonicated in an ultrasonication bath for 12 h to obtain a GO suspension. Subsequently, 0.2 g of HPC was dissolved into 10 mL of GO suspension and 0.6 g of sodium hydroxide was added to the suspension. Next, 9.0 mL of aqueous ammonia solution and 7.0 mL of epichlorohydrin were added sequentially. After stirring for 3 h at 25 °C, the temperature was increased and kept at 50 °C for another 48 h. The SNCH was formed by crosslinking of HPC and GO by epichlorohydrin.Reference Yan, Shuai, Gong, Gu and Yu20–Reference Sun and Wu22 The structure of the crosslinked HPC is shown in Fig. S1. The obtained SNCH was washed several times with deionized water and freeze-dried. Then, the dried SNCH was placed into the aqueous solution of PEI (10 mg/mL) at 80 °C for 2 hReference Liu, Kuila, Kim, Ku and Lee23 to obtain the DNCH, which was washed several times with deionized water.
Representation for the fabrication process of SNCH and DHCH.

For comparison purposes, PEI-GO and crosslinked HPC were prepared. First, 10 mL of the GO dispersion and 5 mL of PEI solution were mixed under vigorous stirring. A further reaction occurred with continuous stirring at 80 °C for 2 h. Then, the dispersion was filtered with a cellulose acetate membrane. The resultant PEI-GO was washed with deionized water and dried at 50 °C in a vacuum oven.
Crosslinked HPC was prepared as follows. First, 0.2 g of HPC was dissolved into 10 mL of deionized water and 0.45 g of sodium hydroxide was added to the solution. Then, 8.0 mL of aqueous ammonia solution and 6.0 mL of epichlorohydrin were added sequentially. After stirring for 3 h at 25 °C, the temperature was increased to 50 °C and maintained for another 48 h to obtain the crosslinked HPC, which was washed several times with deionized water and freeze-dried.
C. Characterization
Fourier transform-infrared (FT-IR) spectra of samples were recorded on a Nicolet FT-IR Nexus 470 spectrophotometer (PerkinElmer Inc., Waltham, Massachusetts). X-ray photoelectron spectra (XPS) were recorded by using a PerkinElmer PHI 550 ESCA/SAM spectrometer (Thermo Fisher Scientific Inc., Vernon Hills, Illinois) using Mg Ka X-ray source. The morphology of samples which were lyophilized was characterized by scanning electron microscopy (SEM, Hitachi S-3400N, Hitachi Ltd., Tokyo, Japan). Measurements of Raman spectra were performed using a Laser Raman spectrometer Horiba Jobin Yvon Inc., Villeneuve d'Ascq, France and the wavelength of the excitation laser beam was 532 nm. The surface area, pore volume, and pore size of samples were analyzed with Micromeritics ASAP 2020 (Micromeritics, Norcross, Georgia) using the N2 adsorption–desorption method after degassing at 300 °C for 3 h. Swelling ratio (SR) was determined by gravimetric method and calculated as follows:
 $${\rm{SR}} = {{{W_{\rm{s}}} - {W_{\rm{d}}}} \over {{W_{\rm{d}}}}}\quad ,$$
where W s and W d were the weights after swelling and at the dry state, respectively.
D. Compressive strength evaluation
Compressive strength was evaluated on a universal materials testing system (Instron model 3345, Instron Corp., Norwood, Massachusetts). Cylinder samples (20 mm in diameter and 20 mm in height) were placed at the center of the lower compression platens. The upper platens compressed the samples at a constant strain force of 10 mm/min until failure. The fracture stress and strain were determined with the failure point of the stress–strain curve, and the compressive strength was calculated. For each measurement, three replicates were done.
E. Batch adsorption study
Adsorption of phenol from aqueous solutions was investigated in a batch system. The effect of pH value was studied in the range of pH 2.0–7.0 adjusted with universal buffer solutions. The effects of initial concentration and temperature on the adsorption capacity were also studied. For this purpose, adsorption amount was determined in magnetically stirred, thermostated cylindrical glass vessels. After desired adsorption periods, the concentration of phenol in the aqueous phase was measured by UV-VIS spectroscopy at 268 nm (Lambda 35, PerkinElmer Inc., Waltham, Massachusetts). The adsorption amount was calculated according to the following equation:
 $$q = {{\left( {{C_{\rm{o}}} - {C_{\rm{e}}}} \right) \times V \times M} \over m}\quad ,$$
where C o (mol/L) and C e (mol/L) are the concentrations of phenol before and after adsorption, respectively; V (mL) is the volume of the solution added; M was molecular weight of phenol; m (g) is the mass of the adsorbent.
F. Thermodynamic study
Thermodynamic parameters were evaluated to study the spontaneity of the adsorption process and probable use of the adsorbents at various temperatures. In the current study, thermodynamic parameters such as changes in Gibbs free energy (ΔG 0), enthalpy (ΔH 0), and entropy (ΔS 0) were calculated by the following equations:
 $$\Delta {G^0} = - RT\ln K\quad ,$$
 $$\ln K = {{ - \Delta {H^0}} \over {RT}} + {{\Delta {S^0}} \over R}\quad ,$$
where R is the universal gas constant [8.314 J/(mol K)] and T is the Kelvin temperature. K is the thermodynamic equilibrium constant for the adsorption process, which was determined by plotting ln (q e/C e) versus q e and extrapolating to zero q e.Reference Wang and Li24,Reference Wang and Li25 The plot of ln K versus 1/T gave a straight line whose slope and intercept were equal to −ΔH 0/R and ΔS 0/R, respectively.
G. Regeneration study
One of important considerations in the development of adsorbents includes simple regeneration and isolation of sorbates. Regeneration allows for the repeated use of adsorbents and cost reduction. The desorption of phenol from the loaded SNCH and DNCH could be realized using 0.01 mol/L NaOH solution.Reference Guan, Liu, He and Yang26 The facile regeneration was due to the high solubility of the sodium salt of phenol in water.
H. Column adsorption evaluation
Column experiments were conducted at room temperature using a glass column (inner diameter: 16 mm). A definite quantity of the adsorbent was packed in the adsorption column. Phenol solutions with different concentrations (100, 200, and 300 mg/L) were pumped upward through the column at different feed flow rates (3, 4, and 5 mL/min) by using a peristaltic pump. Phenol solutions at the outlet of the column were collected at definite time interval and the concentrations were estimated by UV-VIS spectroscopy at 268 nm to determine the concentrations of phenol.
III. RESULTS AND DISCUSSION
A. Preparation and characterization of composite hydrogels
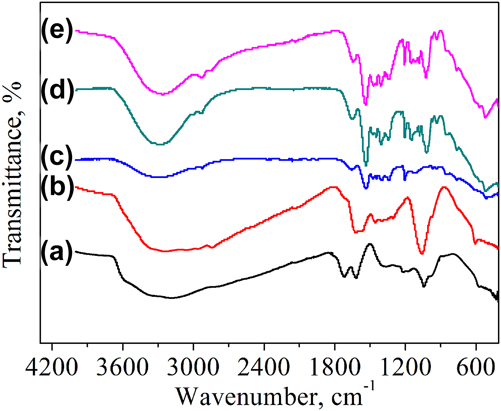
Figure 1 shows the FT-IR spectra of GO, PEI-GO, crosslinked HPC, SNCH, and DNCH. The spectrum of GO [Fig. 1(a)] showed the existence of different oxygen-containing functional groups. The absorption bands of carbonyl groups (C=O, 1720 cm−1), alkoxy groups (C–O, 1040 cm−1), and epoxy groups (C–O–C, 1220 cm−1) were clearly observed. The peaks at 3200 and 1620 cm−1 were ascribed to the O–H and C=C groups, respectively.Reference Piao and Chen27 In the spectrum of PEI-GO [Fig. 1(b)], two new bands at 2840 and 1400 cm−1 appeared, which correspond to the C–H and C–N stretching vibrations. As shown in Fig. 1(c), the characteristic peaks of crosslinked HPC at around 3330 and 1650 cm−1 were attributed to the hydroxyl and carbonyl groups, respectively. In addition, the absorption band at 1200 cm−1 was related to the C–H bending mode. The spectrum of the SNCH [Fig. 1(d)] demonstrated the characteristic peaks of both GO and crosslinked HPC. The stretching vibration of the hydroxyl group (from both GO and crosslinked HPC) was identified at around 3280 cm−1, and the peak at 1020 cm−1 was the characteristic stretching of C–O groups from GO. Similarly, the spectrum of the DNCH [Fig. 1(e)] included the characteristic peaks of both PEI-GO and crosslinked HPC, which confirmed the formation of two crosslinked networks.
FT-IR spectra of (a) GO, (b) PEI-GO, (c) crosslinked HPC, (d) SNCH, and (e) DNCH.

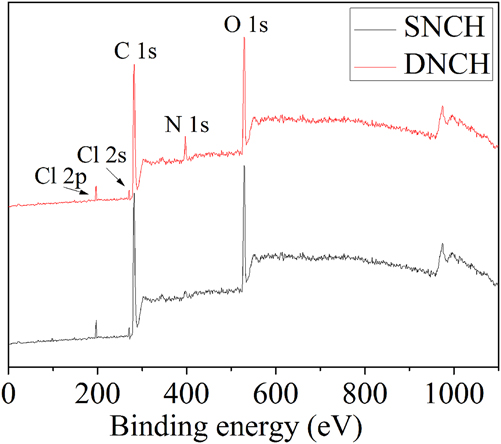
XPS wide-scan spectra of the SNCH and DNCH are shown in Fig. 2. Compared to the spectrum of SNCH, the signal of N 1s peak in the spectrum of DNCH became stronger due to the introduction of PEI. This indicated that GO was successfully crosslinked by PEI in the DNCH.
XPS wide-scan spectra of the SNCH and DNCH.

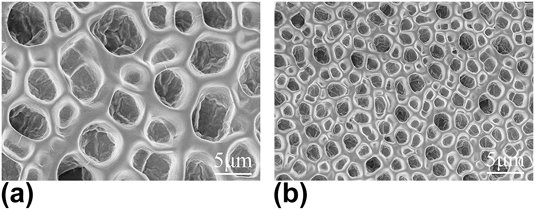
The interior morphology of SNCH and DNCH was investigated by SEM. As shown in Fig. 3, both hydrogels showed three-dimensional network structure with connected channels, which were conducive to the transfer of pollutants in the adsorbents.Reference Spagnol, Rodrigues, Pereira, Fajardo, Rubira and Muniz28 The crosslinking of GO exerted remarkable influence on the internal morphology. Compared to the SNCH, the network structure of the DNCH tended to became more uniform, suggesting good distribution of GO sheets within the composite hydrogel. And the pore size of DNCH became smaller than that of SNCH because PEI played an important role in promoting self-assembly of GO sheets and the formation of the crosslinked network of GO.Reference Wang, Liu, Liu, Chen, Zhang, Li, Li and Wang29
The interior morphology of (a) SNCH and (b) DNCH.

The porous features of SNCH and DNCH were clarified by N2 adsorption–desorption techniques. The detailed structural parameters including the specific surface area, pore diameter, and pore volume were summarized in the Supplementary Material (Table S1). Predominant mesopores were found in the SNCH and DNCH. The pore diameter of DNCH was smaller than that of SNCH, but the specific surface area and pore volume of DNCH were higher than those of SNCH. During the preparation of DNCH, PEI could enlarge interlamellar spacing of GO because of the hyperbranehed structure of PEI. Therefore, the DNCH with higher specific surface area could promote rapid diffusion of phenol, increase the amount of active sites, and then improve the adsorption capacity of phenol.
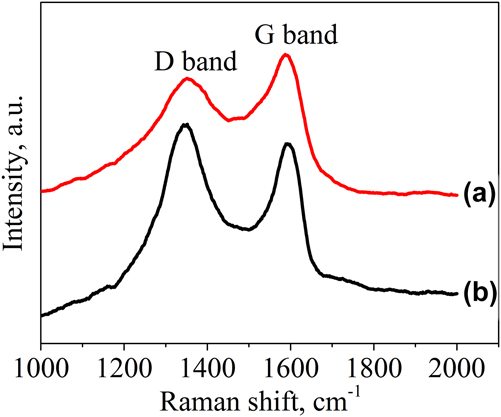
Raman spectroscopy was performed to reveal the structural changes after the crosslinking of GO. The Raman spectrum of SNCH showed two peaks located at 1354 and 1584 cm−1 [Fig. 4(a)], corresponding to D and G bands, respectively. The G band was ascribed to the first order scattering of the E2g phonon of the sp 2 carbon atoms, while the D band could reflect the structural defects associated with vacancies, grain boundaries, and amorphous carbon species.Reference Zhuang, Yu, Chen, Zheng, Ma and Chen30 In the spectrum of DNCH [Fig. 4(b)], the G band shifted to 1589 cm−1, and the D band became more prominent. The I D/I G increased from 0.86 for SNCH to 1.16 for DNCH. This was attributed to the nucleophilic addition of –NH2 functionalities of PEI to the epoxy functionalities of GO and formation of covalent bond during the crosslinking process.
Raman spectra of (a) SNCH and (b) DNCH.

B. Swelling and mechanical properties
SR reflected swelling capability of hydrogels, which was related to hydrophilicity of components and inherent pore structure within networks. Herein, the amount of incorporated GO played an important role in swelling capability of composite hydrogels.Reference Sahraei and Ghaemy31 It was suggested that the competition of interactions among GO sheets, HPC polymer chains and water molecules determined the SR values of composite hydrogels with various compositions.Reference Wang, Song, Jia and Shao32
Figure S2 showed the values of SR for SNCH and DNCH under different pH conditions. As the pH value of the medium increased, the carboxyl groups on GO sheets became ionized and the anion–anion repulsive forces in composite hydrogels resulted in increase of osmotic pressure. Moreover, chemical potential between crosslinked network and external media also increased, which led to the massive flow of water into the composite hydrogels. Therefore, SR increased with pH values. In addition, the SR of DNCH was lower than SNCH. In other words, the formation of double networks obviously suppressed the swelling of hydrogels because the stronger hydrogen bonding interactions in the DNCH could restrict the mobility of crosslinked HPC, thereby improving the swelling resistance.
For practical applications, mechanical properties of hydrogels need to be evaluated. The compressive strengths of the SNCH and DNCH were 9.2 ± 0.2 and 14.7 ± 0.3 MPa, respectively. The DNCH showed a markedly increased compressive strength as compared to SNCH. This significant improvement was attributed to the presence of double crosslinked networks in the hydrogel, which provided effective load transfer between polymer chains and GO nanosheets in addition to the covalent bonds.Reference Xiang, Qian, Li, Wang, Chen, Ma and Dong33
C. Batch adsorption of phenol from aqueous solutions
1. Effect of pH
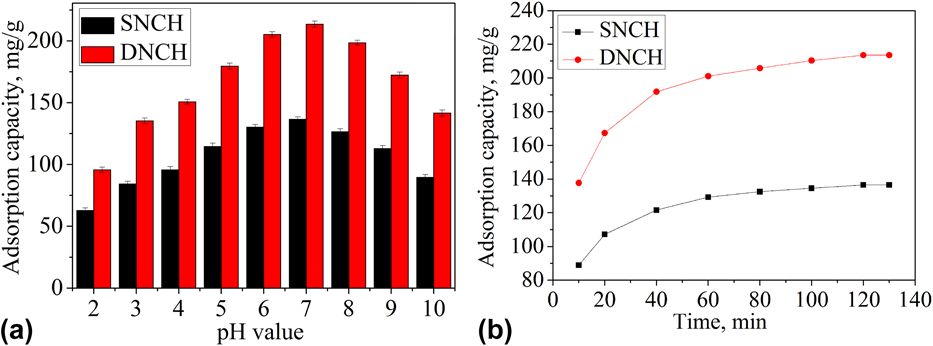
The pH of solutions was an important parameter for adsorption of phenol from aqueous solution because it affected the surface charge of the adsorbent, solubility, and ionization of phenol. As shown in Fig. 5(a), the adsorption amount of phenol increased with pH values. At lower pH values, –OH, –NH2, and –NH– groups on the adsorbents and –OH groups of phenol were protonated synchronously, so phenol was repelled by the positively charged surface. At higher pH values, protonation of –OH, –NH2, and –NH– groups was suppressed. The interactions such as hydrogen bonding between the adsorbent and phenol molecules became stronger, so the adsorption amount of phenol increased. As the pH value was above 7.0, more and more –COOH groups from the adsorbent got dissociated, and the amount of –COO− species increased. Meanwhile, phenol got ionized and existed as phenolate ions. The repulsive forces between the negatively charged adsorbent and phenolate ions was responsible for the low adsorption capacity. DNCH exhibited higher sorption capacity than SNCH due to larger surface area and more abundant functional groups (such as–NH2 and –NH–),Reference Wang, Liu, Liu, Chen, Zhang, Li, Li and Wang29,Reference Wang, Yin and Ji34 which provided abundant potential sorption sites for phenol.
Influence of pH value (a) and contact time (b) on the adsorption amount of phenol.

2. Effect of contact time
Figure 5(b) shows that the removal of phenol increased with contact time and reached an equilibrium within 120 min. At the beginning of the sorption process, high concentration gradient and availability of unoccupied sites in the adsorbent provided necessary driving force to enhance the sorption rate, so the sorption was fast for initial 40 min. As time went on, the concentration gradient and amount of unoccupied sites decreased. So further adsorption of phenol took more time, and the uptake rate became slow. At some point, the adsorption equilibrium occurred. The maximum adsorption capacities of SNCH and DNCH were 136.5 and 213.5 mg/g, respectively.
3. Effect of temperature
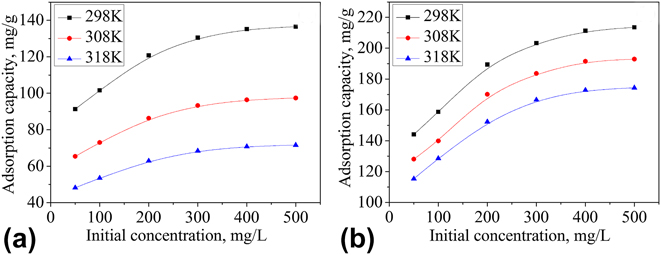
Figure 6 shows the adsorption capacity of phenol with different initial concentrations at different temperatures. There was a gradual decrease of phenol removal by the SNCH and DNCH with the increase of temperature for all the studied concentrations, indicating that the phenol adsorption was an exothermic process. Similar result was also obtained by Zakharov.Reference Zakharov, Voronova, Surov and Batov35
Influence of initial concentration on the adsorption amount of phenol by (a) SNCH and (b) DNCH.

Seen from the above results, it was also found that the adsorption capacity of DNCH was higher than that of SNCH. On the one hand, the introduction of PEI could provide massive active groups (such as –NH2 and –NH– groups), which displayed binding ability for phenol. On the other hand, PEI played an important role in promoting self-assembly of GO sheets and the formation of crosslinking network,Reference Wang, Yin and Ji34 which provided large surface area and was advantageous for phenol adsorption. Therefore, the DNCH showed better adsorption performance than SNCH.
D. Adsorption isotherm
The efficiency and characteristic of the sorption on the adsorbent can be evaluated from the adsorption isotherm. The experimental data were analyzed by the linearized isotherm equations of Langmuir and Freundlich models.
The Langmuir model assumed that the adsorption occurred on a structurally homogeneous adsorbent, all the adsorption sites were energetically identical, and the adsorbed molecules were adsorbed at localized sites. While Freundlich model assumed adsorption from heterogeneous surface, with nonuniform heat distribution on the surface.
The linearized Langmuir and Freundlich models were respectively expressed as
 $${{{C_{\rm{e}}}} \over {{q_{\rm{e}}}}} = {K \over {{q_{\rm{m}}}}} + {{{C_{\rm{e}}}} \over {{q_{\rm{m}}}}}\quad ,$$
 $$\ln {q_{\rm{e}}} = {1 \over n}\ln {C_{\rm{e}}} + \ln {K_{\rm{F}}}\quad ,$$
where q e is the equilibrium adsorption amount (mg/g), C e is the equilibrium concentration in the solution (mg/L), q m represents the maximum amount of phenol that could be adsorbed on the SNCH (DNCH), and K is the constant of Langmuir model (mg/L). K F (mg/g) and n are Freundlich constants depicting the adsorption process.
Figures S3 and S4, respectively, show the linear plots of the Langmuir and Freundlich equations. The constants of the above models and the correlation coefficients are summarized in Table S2. The adsorption was better fitted to the Langmuir isotherm model with higher R 2 value. It was indicated that the adsorption of phenol took place at specific homogeneous sites forming a monolayer coverage of phenol at the surface of the absorbent.
E. Thermodynamic study
The thermodynamic parameters such as changes in Gibbs free energy (ΔG 0), enthalpy (ΔH 0), and entropy (ΔS 0) are presented in Table S3. The negative ΔG 0 at three temperatures confirmed the adsorption of phenol on the SNCH and DNCH was spontaneous and thermodynamically favorable. Moreover, the more negative values of ΔG 0 implied that a greater driving force was required for the adsorption process and the adsorption was more favorable at lower temperatures. The values of ΔH 0 were also negative, indicating that the adsorption was an exothermic process. Entropy was defined as the degree of chaos for a given system. A positive ΔS 0 reflected an increasing randomness at the solid–liquid interface during the adsorption while a negative ΔS 0 implied that the given system was more ordered after adsorption. The negative values of ΔS 0 in the present study indicated the strong affinity between the phenol molecules and composite hydrogels.
F. Regeneration study
To examine the reusability of the adsorbent, the adsorption–desorption cycles were repeatedly conducted using the adsorbent under optimal experimental conditions. As shown in Fig. S5, the SNCH and DNCH could be repeatedly used without significant loss in the initial binding affinity after six adsorption–desorption cycles were performed although the recovery of SNCH was slightly higher than DNCH. Due to the high recycling efficiency, the single and DNCHs were qualified for practical application.
G. Adsorption mechanism
Confirmed from the FT-IR study of the SNCH and DNCH before adsorption, some functional groups were present in the hydrogels such as–OH, –NH2, and –NH– groups. The possible interaction between the composite hydrogels and phenol involved (i) electrostatic interaction between protonated groups (–OH2+, –NH3+, and –NH2+– groups) and phenolate, (ii) hydrogen bonding interactions between –OH, –NH2 and –NH– groups of the adsorbent and phenol, and (iii) interaction between the adsorbed phenol molecules by π–π staking. In addition, the micro/mesopore structure also favored the adsorbent–adsorbate interactions due to the pore filling mechanism.Reference Huang, Jin and Deng36 The higher adsorption capacity of DNCH than that of SNCH was closely related to the more available active sites and larger adsorptive surface area provided by the DNCH.
H. Column adsorption study
For practical operation on full-scale, a continuous flow fixed bed column was often preferred because it was more efficient and easier to operate.
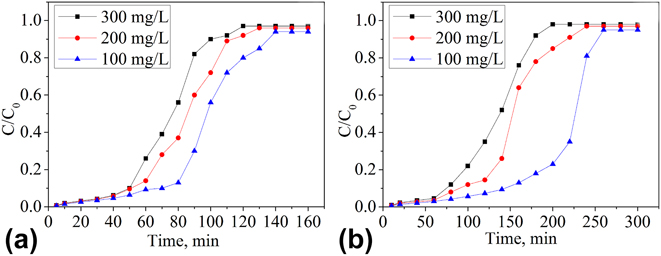
The effect of influent concentration of phenol (C 0) on the adsorption breakthrough behavior was studied, and the results are shown in Fig. 7. At low influent concentration, breakthrough occurred gradually, indicating that a high volume of effluent solution could be treated. This was due to the fact that mass transfer coefficient reduced when the inlet concentration decreased. With the increase of inlet concentration, the concentration gradient between solution phase and solid phase increased, and the active sites on the adsorbent became more rapidly saturated. Therefore, the adsorption rate increased and breakthrough curves became sharper. Similar results were reported in adsorption of phenol and other contaminants.Reference Masomi, Ghoreyshi, Najafpour and Mohamed37
Breakthrough curves at different influent concentrations of phenol for (a) SNCH and (b) DNCH with flow rate 5 mL/min.

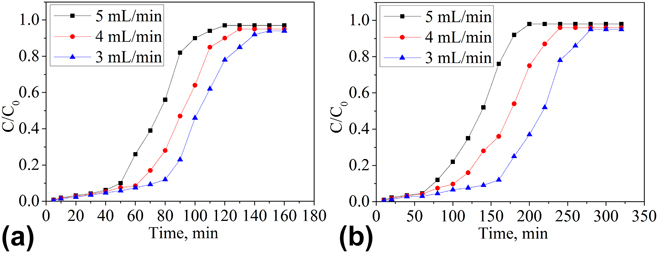
The flow rate was an important parameter for evaluating the efficiency of adsorbents for the continuous treatment of effluents on an industrial scale. To investigate the effect of flow rate on the adsorption of phenol by the SNCH and DNCH, the inlet phenol concentration in the feed was held constant at 300 mg/L, while the flow rate varied from 3 to 5 mL/min. As indicated in Fig. 8, much sharper breakthrough curves for phenol adsorption were found at higher flow rate. This was due to a decrease in the residence time, which restricted the contact of phenol solution with the adsorbents. At higher flow rate, there was not enough time for the adsorbate to diffuse into the pores of the adsorbents and phenol solution passed the column fast before equilibrium occurred. Hence, early breakthrough occurred, resulting in low removal efficiency. When the flow rate decreased, the contact time between phenol and adsorbents in the column became longer, which favored higher adsorption capacity of phenol and relatively high removal efficiency.
Breakthrough curves at different flow rates of phenol for (a) SNCH and (b) DNCH with influent concentration 300 mg/L.

IV. CONCLUSIONS
A new DNCH consisting of the HPC network and the crosslinked GO network was developed. The DNCH showed lower SR and higher mechanical strength than the SNCH. The adsorption amounts of both SNCH and DNCH for phenol were pH-dependent and increased with contact time. The sorption equilibrium data agreed well with the Langmuir isotherm. The study on thermodynamic parameters suggested that the adsorption of phenol on the SNCH and DNCH was spontaneous and thermodynamically favorable. The removal mechanism of the composite hydrogels toward phenol involved electrostatic, hydrogen bonding and π–π interactions. Moreover, dynamic adsorption behavior of phenol showed that the breakthrough time of DNCH was longer than that of SNCH at all operating conditions due to the relatively higher adsorption capacity of DNCH. It was indicated that the DNCH showed great potential application in the removal of phenol from aqueous solutions.
Supplementary Material
To view supplementary material for this article, please visit https://doi.org/10.1557/jmr.2018.385.
ACKNOWLEDGMENTS
Supported by National Natural Science Foundation of China (Project 51672236), Top-notch Academic Programs Project of Jiangsu Higher Education Institutions (PPZY2015A025), “Six Top Talents” program of Jiangsu Province (2015-XCL-034), and science and technology project from Ministry of Housing and Urban-Rural Development of the People’s Republic of China (2014-K7-007).