


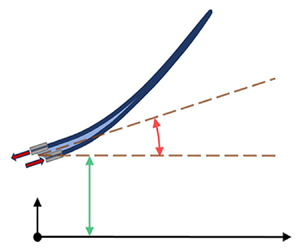

1. Introduction
A fish fin ray features a remarkable bilaminar structure in which two half-rays (hemitrichs) can slide over each other in response to antagonistic muscle actuations at its base. The sliding creates bending and internal stress on the fin ray, leading to a changed shape and effective stiffness. A single fish fin has more than 20 fin rays connected with more than 50 muscular actuators, and each fin ray can be actuated by as many as four distinct muscles (Lauder et al. Reference Lauder, Madden, Mittal, Dong and Bozkurttas2006). Such a fine neuromuscular structure allows fish to precisely control the shape and spatial-temporal stiffness patterns on the fins during swimming, which are essential for generating the desired hydrodynamic forces in flow–structure interactions (FSIs). Through direct measurement of intrinsic caudal fin muscle activities of live fish (Flammang & Lauder Reference Flammang and Lauder2009), previous studies have observed different muscle recruitment patterns in different swimming modes/performance, indicating the importance of the active shape and stiffness control of fins in fish swimming. Inspired by these, efforts have been made to attempt similar shape and stiffness controls in man-made robots. Several robotic mechanisms were attempted in laboratory settings, e.g. agnostically (Tangorra et al. Reference Tangorra, Anquetil, Fofonoff, Chen, Del Zio and Hunter2007; Kancharala & Philen Reference Kancharala and Philen2013; Jusufi et al. Reference Jusufi, Vogt, Wood and Lauder2017), structurally (Nakabayashi et al. Reference Nakabayashi, Kobayashi, Kobayashi and Morikawa2009; Huh, Park & Cho Reference Huh, Park and Cho2012), mechanically (Ziegler et al. Reference Ziegler, Hoffmann, Carbajal and Pfeifer2011; Li et al. Reference Li, Jiang, Wang and Yu2018; Chen & Jiang Reference Chen and Jiang2021; Zhong et al. Reference Zhong, Zhu, Fish, Kerr, Downs, Bart-Smith and Quinn2021), by controlling stiffness and by intrinsic rigidity tuning (Behbahani & Tan Reference Behbahani and Tan2017). Yet none of them yield the same level of performance as real fish.
Efforts have also been directed towards elucidating the function roles of special deforming modes and stiffness patterns in fish fin propulsion. One prominent example is the ‘W’ shape often observed in fish caudal fins during swimming. To investigate this phenomenon, Zhu & Shoele (Reference Zhu and Shoele2008) developed a computational model of a fish caudal fin consisting of spring connected fin rays and simulated the FSIs in propulsion. They found that the ‘W’ shape is easier to form when the fin rays are distributed non-uniformly as in real fish and the shape can significantly improve thrust generation and efficiency. A few recent studies investigated the benefits of temporal stiffness variation in fish fin propulsion by attaching a spring to a rigid fin and varying the spring stiffness or by directly varying the flexibility of a flexible fin (Shi, Xiao & Zhu Reference Shi, Xiao and Zhu2020a,Reference Shi, Xiao and Zhub; Hu et al. Reference Hu, Wang, Wang and Dong2021; Luo & Qi Reference Luo and Qi2021). They found that varying the stiffness with a favourable phase difference with the actuation and plunging motion can considerably enhance the fin's performance.
The role of fin stiffness in propulsion is generally understood through two mechanisms: system resonance and hydrodynamics. The resonance theory proposes that fish adjust the structural stiffness to match the resonance frequency of the system with the beating frequency, thereby reducing energy consumption (Blight Reference Blight1977). The theory is supported by several experimental and computational studies, which found that the local thrust peaks of a plunging plate coincide with its trailing-edge amplitude peaks in the beating frequency spectrum and the efficiency peaks also largely correspond to the thrust peaks (Quinn, Lauder & Smits Reference Quinn, Lauder and Smits2014; Floryan & Rowley Reference Floryan and Rowley2018; Hoover et al. Reference Hoover, Cortez, Tytell and Fauci2018; Peng et al. Reference Peng, Sun, Yang, Xiong, Wang and Wang2022). Some other studies which support the hydrodynamics mechanism, however, did not observe the match of the frequencies. They instead observed that adjusting fin flexibility can generate beneficial kinematics that suppress vortex-induced drag, especially that from the leading-edge vortices, and therefore improve efficiency (Ramananarivo, Godoy-Diana & Thiria Reference Ramananarivo, Godoy-Diana and Thiria2011; Shoele & Zhu Reference Shoele and Zhu2012; Zhu, He & Zhang Reference Zhu, He and Zhang2014). There are also other studies suggesting that it is probably the combination of the two mechanisms that governs the efficiency of fin propulsion, and their relative importance depends on physical parameters such as mass ratio or Reynolds number (Floryan & Rowley Reference Floryan and Rowley2018; Quinn & Lauder Reference Quinn and Lauder2021).
Despite previous studies, our understanding of the role of fin-ray actuation in fish fin propulsion has been limited to adjusting either shape or stiffness directly. Little is understood about the direct effect of antagonistic muscle actuation on the bilaminar structure of the fin ray in propulsion. Several key questions remain unanswered, such as: How do muscle actuations interact with the pitching and plunging to affect the shape, stiffness and performance during propulsion? What are the underlying mechanisms of these effects? What are the optimal actuations? Answering these questions is critical for understanding how fish achieve their superb swimming capabilities through active control of fin-ray shape and stiffness. It is also important for elucidating the underlying mechanisms causing the performance gap between man-made robots and natural fish.
The current study aims to use computer modelling to study the effects of antagonistic muscle actuation on the propulsion of a pitching–plunging bilaminar-structure fin ray. The knowledge will shed light on the fundamental mechanisms of active control of fin-ray shape and stiffness in fish swimming. Specifically, a realistic bilaminar-structure fin-ray model was built by using the geometric data of the pectoral fin ray of the sunfish. The antagonistic muscle actuation at the fin-ray root was modelled as a displacement offset between the two half-rays. The model can replicate the real fin-ray control process under which the effective stiffness and curvature are modulated simultaneously. The material properties of the model were reversely determined by matching the experimental curvature-offset relationships of a real sunfish pectoral fin ray. Parametric FSI simulations were conducted by assuming a sinusoidal function of the offset and varying the amplitude and phase difference between the actuations and pitching/plunging motions. The relationships among the actuations, the resulting fin-ray kinematics, vortex dynamics and hydrodynamic performance were studied.
The rest of the paper is organized as follows. The fin-ray model, computational scheme and simulation set-up are introduced in § 2. The results of the parametric study are presented in § 3. The effects of root actuation on fin-ray kinematics, vortex dynamics and hydrodynamic performance are also discussed in § 3. The conclusion and limitations of the study are summarized in § 4.
2. Method
2.1. Fin-ray model
The anatomy and material properties of pectoral fin rays of the Bluegill sunfish were studied in detail in Alben, Madden & Lauder (Reference Alben, Madden and Lauder2007). To the best of our knowledge, similar measurement of fish caudal fin rays has not been available in the literature. Therefore, we used the data of pectoral fin rays to construct a two-dimensional fin-ray model. Figure 1(a) shows the structure model, which consists of a layer of soft tissue (named intraray), sandwiched between a pair of bony hemitrichs. The length of the fin ray, L, is 4 cm and the thickness of each hemitrich is  $0.0019L$. The intraray was found to gradually taper from the base to the tip in the measurement (Alben et al. Reference Alben, Madden and Lauder2007), and this feature was incorporated into the model by assuming
 ${t_{Int}} = [ - 0.206\,\textrm{ln}(x/L) + 0.9745]{t_{Int,Base}}$, where
 ${t_{Int,Base}} = 0.03L$ is the thickness at the base and x is the distance from the base.
Fin-ray schematics: (a) layers, (b) fin-ray deformation under actuation offset.

The cross-sectional shape of the hemitrich gradually changes along its length, from an approximate half-circle at the base to a flat rectangle at the tip (Alben et al. Reference Alben, Madden and Lauder2007). This shape change would result in decreasing bending rigidity along its length due to a decreasing moment of inertia. As our model is two-dimensional, the shape change cannot be included. Instead, we applied a decreasing Young's modulus along the length of the hemitrich to preserve the bending rigidity change. For simplicity, a linear relationship is assumed,  ${E_{Hem.}} = ({E_{Tip}} - \; {E_{Base}})x + {E_{Base}}$, where
 ${E_{Hem}}$ is the Young's modulus at location x, and
 ${E_{Tip}}$ and
 ${E_{Base}}$ are the Young's moduli at the tip and base, respectively. Here,
 ${E_{Base}}$ is estimated to be
 $40\;{E_{Tip}}$ based on the moment of inertia change. The shear modulus of the intraray layer was found to increase polynomially from the base to the tip (Alben et al. Reference Alben, Madden and Lauder2007). Therefore, the relationship
 ${E_{Int}} = {E_1}{x^q} + {E_2}$ is assumed in the model, where
 ${E_2}$ is the Young's modulus at the base of the intraray and ‘
 ${E_1} + {E_2}$’ is the Young's modulus of the intraray at the tip. Overall, there are four independent material parameters in the model, including
 ${E_{Base}}$,
 ${E_1}$,
 ${E_2}$ and q.
In real-life physiology, the bending of the entire fin ray is caused by antagonistic muscle actuation generating a displacement offset at the roots of two hemitrichs, as illustrated by figure 1(b). The relationship between the root offset and fin-ray bending is determined by the material properties of the hemitrich and intraray. Alben et al. (Reference Alben, Madden and Lauder2007) have measured the fin-ray shapes at different root offsets. These data are reproduced in figure 2, in which the fin-ray shape at a given offset is represented by several measurement points shown in the same colour. The parameter  $\varepsilon = \Delta x/L$ is the non-dimensional root offset, where
 $\Delta x$ is the dimensional root offset. The three fin-ray shapes correspond to
 $\varepsilon = 0.00451$,
 $0.00585$ and
 $0.00764$, respectively. In our model, numerical simulations of static deformations of the fin ray with the same three root offsets were carried out. A genetic algorithm was integrated in the simulations to search the optimal combination of the four material parameters (
 ${E_{Base}}$,
 ${E_1}$,
 ${E_2}$ and
 $q$) that generate the best match between the numerical results and experimental data. Figure 2 shows the results of the simulated deformations of the fin ray with the optimized material parameters (solid lines). The overall fin-ray deformation pattern is well represented. The simulated fin ray shows larger bending than that in the experiments. The mean error of the fin-ray deformations between the numerical simulations and experiments is 16.8 %. The obtained material parameters are
 ${E_{Base}} = 8.809 \times {10^{11}}\;\textrm{Pa}$,
 ${E_1} = 9.801 \times {10^6}\;\textrm{Pa}$,
 ${E_2} = 5.695 \times {10^6}\;\textrm{Pa}$ and
 $q = 3.718$.
Comparison of the fin-ray deformations at different root offsets between the numerical simulations with the optimized material parameters and the experimental measurement in Alben et al. (Reference Alben, Madden and Lauder2007).

2.2. Dynamic fin-ray model
The fish caudal fin in steady swimming was observed to flap in combined plunging and pitching motions with a 90° phase difference (Liu et al. Reference Liu, Geng, Zheng, Xue, Dong and Lauder2019). In our model, the pitching and plunging motions are modelled using the sinusoidal functions as follows:
 \begin{gather}\theta (t) = \; {\theta _0}\,\textrm{sin}(2{\rm \pi} ft),\end{gather}
 \begin{gather}h(t) = \; {h_0}\,\textrm{sin}(2{\rm \pi} ft + {\varphi _h}),\end{gather}
where  $\theta (t)$ and
 $h(t)$, respectively, are the pitching angle and plunging displacement at the root of the fin ray (figure 3),
 ${\theta _0}$ and
 ${h_0}$, respectively, are the half-amplitudes of the pitching and plunging motions and f is the beating frequency. Based on the observation in high-speed video,
 ${\theta _0} = 0.392$ radians is used (Liu et al. Reference Liu, Geng, Zheng, Xue, Dong and Lauder2019). This high-speed video analysis revealed a plunging–pitching phase offset of
 ${\varphi _h} = {\rm \pi}/2$, which corresponds well with the findings of Buren, Floryan & Smits (Reference Buren, Floryan and Smits2019). In their study, they demonstrated that this specific phase offset leads to the maximum efficiency for pitching–plunging rigid foils. Here,
 ${h_0} = 0.25$ is used for generating a Strouhal number of 0.4 (Liu et al. Reference Liu, Geng, Zheng, Xue, Dong and Lauder2019).
Schematics of the root fin-ray motions of pitching, plunging and muscle activation.

An empirical relationship was reported for fish swimming as follows (Bainbridge Reference Bainbridge1958):
 \begin{equation}{U_\infty } \propto L(3f - 4),\end{equation}
where  ${U_\infty }$ is the upstream flow velocity. By using the reconstructed kinematics data in Liu et al. (Reference Liu, Geng, Zheng, Xue, Dong and Lauder2019) and assuming their fish swimming speed of
 ${U_\infty } = 10\;\textrm{cm}\;{\textrm{s}^{ - 1}}$, a beating frequency of
 $f = 2\;\textrm{Hz}$ results.
The muscle actuations are modelled as a root displacement offset which varies in time in a sinusoidal function during a cycle
 \begin{equation}\varepsilon (t) = {\varepsilon _0}\,\textrm{sin}(2{\rm \pi} ft + \varphi ),\end{equation}
where  ${\varepsilon _0}$ is the amplitude of the offset and
 $\varphi $ is the phase difference between the pitching and offset. The offset is applied by splitting it into two halves and applying each half to each hemitrich with opposite directions (
 $0.5\varepsilon $ and
 $- 0.5\varepsilon $). Note that the muscle actuation frequency is the same as the flapping frequency. The positive and negative signs of
 $\varepsilon $ indicate bendings in opposite directions.
The motion of the fin ray is driven by the combination of the pitching, plunging and root offset, as illustrated in figure 3.
2.3. Governing equations and numerical schemes
The flow field is governed by the two-dimensional, unsteady, incompressible Navier–Stokes equations as follows:
 \begin{gather}\frac{{\partial {u_i}}}{{\partial {x_i}}} = 0,\end{gather}
 \begin{gather}\frac{{\partial {u_i}}}{{\partial t}} + \frac{{\partial {u_i}{u_j}}}{{\partial {x_j}}} ={-} \frac{{\partial p}}{{\partial {x_i}}} + \frac{1}{{Re}}\frac{{{\partial ^2}{u_i}}}{{\partial {x_j}\partial {x_j}}},\end{gather}
where u and p are the flow velocity and pressure, and  $Re$ is the Reynolds number. These equations are discretized using a cell-centred collocated arrangement of
 ${u_i}$ and p. A fractional step method is employed to integrate the equations in time, which consists of three sub-steps. In the first sub-step, a modified momentum equation is solved by employing a second-order Adams–Bashforth scheme for the convective terms and an implicit Crank–Nicolson scheme for the diffusion terms. A Poisson equation is solved in the second sub-step to obtain a pressure correction term. In the third sub-step, the obtained pressure correction term is used to determine the pressure and velocity terms. This equation is solved using an in-house sharp-interface immersed-boundary-method flow solver based on a multi-dimensional ghost-cell methodology to treat complex and moving boundaries so that they have a second-order accuracy at the boundaries. Following a second-order accuracy in the discretization of the flow field, this computation has a local and global second-order accuracy. This method has been successfully applied to different biological applications (Geng et al. Reference Geng, Xue, Zheng, Liu, Ren and Dong2017; Bodaghi et al. Reference Bodaghi, Jiang, Xue and Zheng2021a,Reference Bodaghi, Xue, Zheng and Thomsonb; Liu et al. Reference Liu, Jiang, Zheng and Xue2021). More details of this method can be found in Mittal et al. (Reference Mittal, Dong, Bozkurttas, Najjar, Vargas and Von Loebbecke2008).
The dynamics of the solid is governed by the Navier equation
 \begin{equation}{\rho _s}\frac{{{\partial ^2}{d_i}}}{{\partial {t^2}}} = \frac{{\partial {\sigma _{ij}}}}{{\partial {x_j}}} + {\rho _s}{f_i},\end{equation}
where  ${\rho _s}$, d,
 $\sigma $ and f represent tissue density, displacement, stress and body force, respectively. An in-house finite element analysis code with a linear elasticity formulation is used to solve this equation. Geometric nonlinearity is included to model large deformations (Liu et al. Reference Liu, Geng, Zheng, Xue, Dong and Lauder2019).
The flow solver and solid solver are implicitly coupled through the inter-surface. At each time step, the flow solver communicates the surface hydrodynamic loadings to the solid solver, while the solid solver communicates the surface kinematics (locations and velocities) to the flow solver. An Aitken adaptive under-relaxation scheme is adopted to iterate between the two solvers until convergence on the surface locations is achieved. The detailed FSI algorithm can be found in Liu et al. (Reference Liu, Geng, Zheng, Xue, Dong and Lauder2019). The FSI solver was validated on two benchmark cases including flow-induced vibration of an elastic beam behind a cylinder and flow past flexible pitching plates (Liu et al. Reference Liu, Geng, Zheng, Xue, Dong and Lauder2019).
2.4. Non-dimensional parameters
The non-dimensional parameters in the discussion are introduced below. The Strouhal number is defined as
 \begin{equation}St = fA/{U_\infty },\end{equation}
where  $A = 2{h_0}$ is the leading-edge vertical displacement amplitude. Here,
 $St$ is 0.4 for all of the cases that lie within the predominant Strouhal range,
 $0.2 < St < 0.4$, in nature (Anderson et al. Reference Anderson, Streitlien, Barrett and Triantafyllou1998).
The Reynolds number is defined as
 \begin{equation}Re = {U_\infty }L/\upsilon ,\end{equation}
where  $\upsilon = 1.084 \times {10^{ - 6}}\;{\textrm{m}^2}\;{\textrm{s}^{ - 1}}$ is the kinematic viscosity of water, resulting in
 ${Re = 3690}$ in all of the cases which lie in a moderate range for fish swimming applications with a high viscous effect (Bone & Moore Reference Bone and Moore2008).
The instantaneous power coefficient is defined as
 \begin{equation}{C_P}(t) = \frac{{P(t)}}{{0.5\rho U_\infty ^3{L^2}}},\end{equation}
where  $\rho = 999\;{\rm kg}\;{\rm m}^{ - 3}$ is the density of water and
 $P(t)$ is the instantaneous hydrodynamic power, calculated based on
 \begin{equation}P(t) = \int_0^L { - \boldsymbol{F}(s,t) \boldsymbol{\cdot} {\boldsymbol{V}_{ray}}(s,t)\,\textrm{d}s} ,\end{equation}
where  $\boldsymbol{F}(s,t)$ is the point hydrodynamic force at time t, s is the chordwise Lagrangian location on the fin ray and
 ${\boldsymbol{V}_{ray}}(s,t)$ is the corresponding surface velocity at the same location.
The instantaneous thrust and lift (side-force) coefficients are defined as follows:
 \begin{gather}{C_T}(t) = \frac{{ - {F_x}(t)}}{{0.5\rho U_\infty ^2{L^2}}},\end{gather}
 \begin{gather}{C_L}(t) = \frac{{ - {F_y}(t)}}{{0.5\rho U_\infty ^2{L^2}}},\end{gather}
where  ${F_x}(t)$ and
 ${F_y}(t)$ are the instantaneous hydrodynamic force components along the streamwise and lateral directions, respectively.
The propulsive efficiency is defined as
 \begin{equation}\eta = \frac{{\; {{\bar{C}}_T}\; }}{{\; {{\bar{C}}_P}\; }},\end{equation}
where  ${\bar{C}_T}$ and
 ${\bar{C}_P}$ are the time-averaged thrust and power coefficients, respectively, computed by averaging through time over the last cycle of the motion. The negative values of
 ${C_P}$ are excluded from the averaging to avoid over-estimation of the efficiency (Yin & Luo Reference Yin and Luo2010; Shoele & Zhu Reference Shoele and Zhu2013).
2.5. Computational domain and boundary conditions
The fin ray is discretized using eight-node brick elements. A grid independence test on the fin-ray model was carried out by simulating the static deformation of the fin ray under a root offset and an external vertical force at the fin-ray tip which generates large deformations. The displacements at both the tip and 0.3 chord lengths from the base were measured to check the convergence. Both displacements converged at 500 elements with errors below 0.1 %. Therefore, 500 elements were used in the fin-ray model for all the simulations.
The computational domain, grids of the near body and boundary conditions for the flow simulation are depicted in figure 4. The flow domain is a  $29L \times 29L$ rectangle. The fin ray is placed at the centre. The domain is discretized by
 $256 \times 256$ Cartesian grids with the smallest grid size of
 $0.019L \times 0.019L$ surrounding the fin ray so that near-field vortex structures can be well resolved. A uniform velocity of 10 cm s−1 is applied as far-field conditions on the left, top and bottom boundaries. The outflow boundary condition is applied on the right boundary with zero velocity and zero pressure gradient. A grid independence study was also conducted by simulating flow past a rigid fin ray with the same pitching and plunging motions described by (2.1) and (2.2). Four different Cartesian grids, 64 × 64, 128 × 128, 256 × 256 and 512 × 512, were tested. We found that
 ${\bar{C}_P}$ and
 ${\bar{C}_T}$ asymptotically converged to the finest grid (512 × 512). We adopted the 256 × 256 grid which generates a 2 % difference in
 ${\bar{C}_P}$ and a 5 % difference in
 ${\bar{C}_T}$ from the finest grid. A time step of 0.002 was adopted to satisfy the computational stability, which ensures a Courant–Friedrichs–Lewy number below 1.
Flow solver boundary conditions and computational grids of the near body.

In the parametric simulations, the root displacement offset amplitude,  ${\varepsilon _0}$, was varied from 0.0002 to 0.007 with an interval of 0.0004, and the offset phase,
 $\varphi $, was varied from 0 to 315° with an interval of 45°. This results in a total of 144 cases. An additional baseline case with zero offset was also simulated. Each simulation was performed using eight processors on the XSEDE Expanse cluster utilizing an AMD EPYC 7742 type CPU with clock speed and flop speed of 2.25 GHz and 4608 GFlop s−1, respectively. In each case 8000 time steps, which equal eight beating cycles, were simulated to pass the initial transient stage. The average computational cost per case is approximately 277 CPU hours.
3. Results and discussion
3.1. Propulsion performance
Figure 5 shows the contours of propulsion efficiency,  $\eta $, time-averaged power coefficient,
 ${\bar{C}_P}$, and time-averaged thrust coefficient,
 ${\bar{C}_T}$, in the parametric space of
 ${\varepsilon _0}$ and
 $\varphi $ which are arranged in a polar coordinate system with the radius representing
 ${\varepsilon _0}$ and angle representing
 $\; \varphi $. The baseline case with zero offset is at the centre. It is observed that the phase angle is the critical parameter determining the effects of root actuation. The root actuation increases
 ${\bar{C}_T}$ and
 ${\bar{C}_P}$ only when
 $\varphi $ is approximately between −45° (315°) and 135°. In this region, increasing the offset amplitude increases
 ${\bar{C}_T}$ and
 ${\bar{C}_P}$, while outside the region, increasing the offset amplitude decreases
 ${\bar{C}_T}$ and
 ${\bar{C}_P}$. For the efficiency, the root actuation is only beneficial in a small phase angle range approximately between 225° and 315°. In this range, increasing the offset amplitude increases the efficiency, while outside the range, increasing the offset amplitude decreases the efficiency. The highest efficiency occurs at
 $\varphi = 275^\circ $. Interestingly, there is no overlap between the high
 ${\bar{C}_T}$ region and high
 $\eta $ region, indicating that the root actuation cannot simultaneously increase the thrust and efficiency.
(a) The parametric space shown in the polar coordinate system with the radius representing the actuation magnitude,  ${\varepsilon _0}$, and angle representing the phase,
 $\varphi $. Contours of (b) propulsion efficiency,
 $\eta $, (c) mean power coefficient,
 ${\bar{C}_P}$, and (d) mean thrust coefficient,
 ${\bar{C}_T}$, in the parametric space. ZA represents the baseline case with zero activation. Here,
 ${H_T}{L_\eta }$,
 ${L_T}{L_\eta }$ and
 ${L_T}{H_\eta }$ are three selected cases, respectively, with high thrust–low efficiency, low thrust–low efficiency and low thrust–high efficiency.

Figure 6(a–c) compares the instantaneous power coefficient,  ${C_P}$, thrust coefficient,
 ${C_T}$, and lift coefficient,
 ${C_L}$, in one steady cycle among four representative cases, including a ‘zero-activation’ case denoted by ZA, a ‘high-thrust–low efficiency’ case denoted by
 ${H_T}{L_\eta }$, a ‘low-thrust–low efficiency’ case denoted by
 ${L_T}{L_\eta }$ and a ‘low-thrust–high efficiency’ case denoted by
 ${L_T}{H_\eta }$. These four cases are also marked in the parametric space in figure 5(a). Overall, the coefficients show similar development patterns among all the cases: a double-peak pattern for
 ${C_P}$ and
 ${C_T}$, and a single-peak pattern for
 ${C_L}$. These patterns are dominated by the pitching and plunging motions which generate two positive thrust peaks by shedding a trailing-edge vortex in each stroke and two side-force (lift) peaks in opposite directions (positive and negative
 ${C_L}$ peaks) in one cycle. Yet, the amplitudes and phases of the coefficients’ peaks show large differences among the cases. For the amplitude, the
 ${H_T}{L_\eta }$ case generates not only the highest-thrust peak, but also the highest power and lift peaks, suggesting that the kinematics in this case generates considerable energy waste in the lateral direction, which may explain its low efficiency. The
 ${L_T}{L_\eta }$ and
 ${L_T}{H_\eta }$ cases both generate lower thrust, power and lift peaks than the baseline case. A closer comparison discloses that the
 ${L_T}{H_\eta }$ case generates a higher-thrust peak than the
 ${L_T}{L_\eta }$ case while their power and lift peaks are very close, suggesting that the kinematics in the
 ${L_T}{H_\eta }$ case converts a larger portion of the energy consumption to thrust, explaining its higher efficiency. For the phase of the peaks, the four cases are all different from each other. As the time development of the forces are closely related to near-field vortex dynamics, especially the leading-edge vortex (LEV) formation and trailing-edge vortex (TEV) shedding, it suggests that the four cases have generated a very different vortex dynamics due to the root actuations.
Comparison of time history of phase-averaged (a) power coefficient, (b) thrust coefficient and (c) lift coefficient for the ZA,  ${H_T}{L_\eta }$,
 ${L_T}{L_\eta }$ and
 ${L_T}{H_\eta }$ cases.

3.2. Near-body flow field
In this section, we present the near-field vortex dynamics in the four representative cases to further understand the fundamental mechanisms causing the performance differences. Figure 7 shows the contour of the vorticity in the near-fin-ray field at four evenly spaced time instants in one cycle for each case. The red colour represents a counterclockwise vortex (positive vorticity) and the blue represents a clockwise vortex (negative vorticity). In this figure, we have labelled the wake patterns using the nomenclature  $mS + nP$, as introduced by Williamson & Roshko (Reference Williamson and Roshko1988). This labelling system denotes the shedding of m single vortices and n vortex pairs in one cycle.
Comparison of instantaneous flow vorticity fields at four time instances during the cycle for ZA,  ${H_T}{L_\eta }$,
 ${L_T}{H_\eta }$ and
 ${L_T}{L_\eta }$ cases. Motion of the fin ray swimming from right to left is incorporated to the left side of the figure. Dashed lines show the corresponding trajectory of the centre of mass of the fin ray.

In the ZA case, both LEV and TEV are observed. At the trailing edge, a clockwise vortex (T2) is formed and shed from the top surface when the edge is moving upwards (from t = 1/2T to t = 0, where T is the period of the flapping cycle,  $T = 1/f$) and a counterclockwise vortex (T1) is formed and shed from the bottom surface when the edge is moving downwards (from t = 0 to t = 1/2T). The shed TEVs are uniformly spaced in the wake, forming a reversed von Kármán vortex street. This type of wake pattern is named ‘2S’, standing for two single vortices per cycle. At the leading edge, a counterclockwise vortex (L1) is formed at t = 0. Later, L1 detaches from the edge and convects along the fin ray (t = 1/4T) until it dissipates (t = 1/2T). Similarly, a clockwise vortex (L2) is formed at t = 1/2T, and it later detaches from the edge and convects along the fin ray (t = 3/4T) until it dissipates (t = 0). Both LEVs have dissipated before entering the wake.
The  ${H_T}{L_\eta }$ case shares a similar vortex dynamics pattern with the ZA case: a pair of TEVs (T1 and T2) successively form and are shed into the wake, and another pair of LEVs (L1 and L2) successively form and dissipate before entering the wake. Differences between the
 ${H_T}{L_\eta }$ case and ZA case are also observed. First, both LEVs and TEVs are much stronger in the
 ${H_T}{L_\eta }$ case, generating the much higher force coefficients observed in figure 6. Second, the space between the TEVs from the same cycle is smaller than that from different cycles, forming a vortex-pair pattern in the wake. This type of wake pattern is named the ‘P’ pattern. It is different from the ‘2S’ wake pattern in the ZA case where the TEVs are uniformly spaced.
The  ${L_T}{H_\eta }$ case shows a similar TEV dynamics and wake pattern as the ZA case in that a pair of TEVs (T1 and T2) successively form and are shed into the wake. The vortices are evenly spaced, forming a ‘2S’ wake pattern. Yet, the vortices are much weaker in this case, leading to the much smaller hydrodynamic forces seen in figure 6. Interestingly, no LEV is observed in this case. This may be why it has the highest efficiency.
The  ${L_T}{L_\eta }$ case appears to have a very different vortex dynamics compared with the other three cases, although the successive formation of a pair of TEVs and LEVs within a cycle is still seen. A major difference is that the LEVs become relatively stronger than the TEVs in this case. The LEVs can convect to the trailing edge and eventually enter the wake together with the TEVs without being dissipated. It is seen in figure 7 that at t = 0 and 1/4T when T2 is shed, L1 has also arrived at the trailing edge, and it enters the wake together with T2, forming a vortex pair. Similarly, at t = 1/2T and 3/4T, L2 and T1 form another pair. The two vortex pairs convect downstream in separate paths. This type of wake is thus named ‘2P’, indicating a two-vortex-pair wake pattern. It is also noticed that the overall strength level of the vortices is much lower in this case, and the LEVs stand for a much longer time before pinching off.
In summary, three types of wake patterns are observed, including the 2S pattern characterized by a sequence of even-spaced single TEVs with alternate opposite signs, the P pattern characterized by a sequence of TEV pairs of which the inner-pair space is smaller than the outer-pair space, and the 2P pattern characterized by two vortex pairs formed by both TEVs and LEVs. After a thorough examination, we found that the three wake patterns represent the wakes of all the simulation cases. Figure 8 depicts the distribution of the wake patterns in the parametric space. The 2S pattern occurs in the cases with  $\varphi = 270^\circ $ and
 $\varepsilon > 0.0022$, which corresponds to the highest efficiency in figure 5. In these cases, the LEVs are either not formed or are very weak so that they fully dissipate before entering the wake. The P pattern is mainly located between
 $\varphi ={-} 45^\circ \;(315^\circ )\; $ and
 $\varphi = 135^\circ $, which corresponds to the high-thrust region in figure 5. The TEVs in this pattern are the strongest among the three wake patterns and increasing the offset amplitude would further increase the strength of the TEVs and thrust. The LEVs in these cases are stronger than those in the 2S pattern, yet much weaker than the TEVs, and they only have a weak presence in near wakes. The 2P pattern occurs from
 $\varphi = 135^\circ $ to
 $\varphi = 225^\circ $, which corresponds to the low-thrust region in figure 5. Most of these cases have lower efficiency than the ZA case, except a few when
 $\varphi = 225^\circ $ and
 $\varepsilon < 0.0034$. The low efficiency and low thrust in these cases are due to the fact that the overall strength of the vortices is the lowest, and the LEVs are relatively stronger than the TEVs.
(a) Map of vortex patterns; (b) typical wake region vortical structures of 2S, P and 2P, respectively.

Overall, two correlations are observed from figures 7 and 8, i.e. a positive correlation between the strength of the TEV and thrust and a negative correlation between the strength of the LEV and efficiency. For example, the P wake pattern features the strongest TEVs and highest thrust, and the 2P pattern features the weakest TEVs and lowest thrust. The 2S pattern has no or very weak LEVs, and it corresponds with the highest efficiency. These correlations were also reported in previous studies (Ramananarivo et al. Reference Ramananarivo, Godoy-Diana and Thiria2011).
3.3. Fin-ray deformation
Figure 9 depicts the deformations of the fin ray during one cycle in the ZA,  ${H_T}{L_\eta }$,
 ${L_T}{L_\eta }$ and
 ${L_T}{H_\eta }$ cases with each line corresponding to one time instant. The blue and red colours distinguish the downstroke and upstroke motions. Several common features can be observed among the cases including that the kinematics is symmetric about
 $y/L = 0$, the trailing edge undergoes a ‘figure-eight’ trajectory and the leading part up to 1/10th of the chord length has almost identical deformations because of the identical plunging and pitching motions applied at the leading edge.
Deformations of the fin ray in the upstroke (red) and downstroke (blue) motions during one cycle in the ZA,  ${H_T}{L_\eta }$,
 ${L_T}{L_\eta }$ and
 ${L_T}{H_\eta }$ cases.

On the other hand, differences are observed for most parts of the fin ray among the cases, suggesting that the root offset can effectively change the fin-ray kinematics. A significant effect is on the trailing-edge amplitude. In the  ${H_T}{L_\eta }$ case, the trailing-edge amplitude is increased compared with the ZA case because the root offset generates a kinematics in phase with the original kinematics. In the
 ${L_T}{H_\eta }$ and
 ${L_T}{L_\eta }$ cases, the trailing-edge amplitude is decreased because the root offset generates a kinematics out of phase with the original kinematics. In the
 ${L_T}{L_\eta }$ case, the trailing-edge amplitude is even smaller than the leading-edge amplitude. The resulting trailing-edge amplitudes correlate well with the thrust coefficients in the four cases, suggesting that the phase of the root offset is the key factor determining its effect on the thrust.
To further demonstrate the effect of the root offset phase on the trailing-edge amplitude as well as the correlations among the trailing-edge amplitude, TEVs and thrust coefficient, figure 10 plots the contour of the trailing-to-leading-edge amplitude ratio (T-L amplitude ratio, T-L Amp.) in the parametric space. Compared with the ZA case, the T-L amplitude ratio is increased when  $\varphi $ is between −45° (315°) and 135°. This is also the region of the P wake pattern, strongest TEVs (figure 8) and highest thrust (figure 5c). The T-L amplitude ratio is decreased between
 $\varphi = 135^\circ $ and 315°. This is the region where the 2S and 2P wake patterns occur which have weaker TEVs (figure 8) and lower thrust (figure 5c). Moreover, the lowest T-L amplitude ratio and thrust both occur at
 $\varphi = 225^\circ $. In this region, the wake pattern is 2P, which has the weakest vortices. The results confirm that the thrust, strength of TEVs and T-L amplitude ratio are positively correlated. They also confirm that the phase relationship between the root offset and leading-edge plunging and pitching motions is the dominant factor determining the T-L amplitude ratio. To increase the thrust, a favourable phase relationship needs to be applied to increase the T-L amplitude ratio.
Trailing-edge amplitude to leading-edge amplitude ratio for the parametric domain.

Andersen et al. (Reference Andersen, Bohr, Schnipper and Walther2017) have reported that for a pitching foil and plunging foil there is a threshold trailing-edge amplitude which represents the drag–thrust transition. Additionally, they reported that a reversed von Kármán vortex street is present for high trailing-edge amplitudes. For our study, comparison of figures 5(d) and 10 shows that the drag–thrust transition occurs approximately at a T-L amplitude of 0.7. Moreover, since both 2S and P wake patterns are characterized by a reversed von Kármán vortex street, comparison of figures 8(a) and 10 shows a reversed von Kármán vortex street for T-L amplitudes greater than 1.9.
3.4. Effective angle of attack
The effective angle of attack ( ${\alpha _{eff}}$) is an essential parameter affecting the LEV dynamics and efficiency. A small
 ${\alpha _{eff}}$ would increase efficiency by avoiding flow separation near the leading edge (Anderson et al. Reference Anderson, Streitlien, Barrett and Triantafyllou1998; Shoele & Zhu Reference Shoele and Zhu2012; Zhu et al. Reference Zhu, He and Zhang2014). Conventionally,
 ${\alpha _{eff}}$ is often calculated as the angle between the relative velocity and tangential slope at the leading edge (Shoele & Zhu Reference Shoele and Zhu2012) or the angle between the relative velocity at the leading edge and the chord line of the fin ray (Zhu et al. Reference Zhu, He and Zhang2014; Zhang et al. Reference Zhang, Lagor, Yeo, Washington and Paley2015). Correlations among
 ${\alpha _{eff}}$, LEV strength and efficiency are often observed. However, when the above methods were applied to calculate
 ${\alpha _{eff}}$ in our cases, no similar correlations were observed. It is worth pointing out that the leading part of the fin ray up to 1/10th of the chord length has almost identical kinematics in all the cases due to the same pitching and plunging motions in our model. Therefore,
 ${\alpha _{eff}}$ calculated based on the leading-edge kinematics has small differences among the cases. However, distinct LEV dynamics is observed among the cases, suggesting that the LEV dynamics is affected not only by the leading-edge kinematics.
Ramananarivo et al. (Reference Ramananarivo, Godoy-Diana and Thiria2011) and Demirer et al. (Reference Demirer, Oshinowo, Erturk and Alexeev2022) have conducted studies highlighting the relationship between efficiency and trailing-edge characteristics. Ramananarivo et al. (Reference Ramananarivo, Godoy-Diana and Thiria2011) found that efficiency is correlated with the trailing-edge angle, while Demirer et al. (Reference Demirer, Oshinowo, Erturk and Alexeev2022) demonstrated a relationship between efficiency and the trailing-edge displacement envelope. In both studies, the trailing-edge motion is passive, following the motion of the leading edge, and it aims to minimize the flow pressure difference on the fin. Peng et al. (Reference Peng, Sun, Yang, Xiong, Wang and Wang2022) have shown that, for a passive pitching foil, while the trailing-edge kinematics is a valid representative for the propulsion performance (e.g. power coefficient), using the entire motion of the foil slightly better represents the propulsion performance.
In our study, similar to the aforementioned studies, the effect of the pitching and plunging motions of the leading edge is passive on the trailing-edge motion. However, the muscle actuation introduces an active displacement in the entire fin ray, with a more pronounced effect on the trailing edge (as shown in figure 2). Consequently, the motion of the trailing edge is a combination of both passive and active components, and as a result, the efficiency is not directly related to the motion of the trailing edge. This observation is further supported by comparing figures 5(b) and 10, which highlights the complex relationship between trailing-edge motion and efficiency.
Taken together, our results suggest that the LEV dynamics is affected not by only the leading-edge or trailing-edge kinematics, but by the kinematics of the entire fin ray. To capture this overall effect, we defined a new  ${\alpha _{eff}}$ based on the relative velocity at the centre of mass of the fin ray,
 ${V_{CM}}$, and the chord line orientation. Figure 11 illustrates the definition. The centre of mass of the fin ray at each time instant is located using
 ${x_{CM}} = \sum\nolimits_{i = 1}^n {{m_i}{x_i}/M} $ and
 ${y_{CM}} = \sum\nolimits_{i = 1}^n {{m_i}{y_i}/M} $, where
 ${m_i}$ is the mass of element i,
 ${x_i}$ and
 ${y_i}$ are the locations of the centre of the corresponding element and M is the total mass of the fin ray. Here,
 ${V_{CM}}$ is then calculated as the difference between the upstream flow velocity and local fin-ray velocity at the centre of mass. The orientation of the chord line is determined by connecting the leading and trailing edges. The new
 ${\alpha _{eff}}$ is calculated as the angle between
 ${V_{CM}}$ and the chord line orientation.
Angle of attack definition based on the relative velocity of the centre of mass and the chord line orientation.

Figure 12(a) plots the contour of the maximum  ${\alpha _{eff}}$ (
 ${\alpha _{eff,max}}$) during one cycle of each case in the parametric space. It shows a strong correlation with the efficiency in figure 5(b). The minimum value of
 ${\alpha _{eff,max}}$ occurs at
 $\varphi = 270^\circ $, corresponding to the 2S wake pattern which has no or very weak LEVs and the highest efficiency. The correlation confirms that the leading-edge flow dynamics is dictated by the kinematics of the entire fin ray, which can be quantified by the relative velocity at the centre of mass. The importance of the kinematics at the centre of mass of a flexible fin ray or plate in propulsion efficiency was also reported in a few other studies. For example, another computational study (Demirer, Oshinowo & Alexeev Reference Demirer, Oshinowo and Alexeev2021) found that the efficiency of an elastic plunging plate near resonance can be further enhanced by actively generating a specific bending pattern that reduces the displacement at the centre of mass while maintaining a large displacement at the tip. Yeh & Alexeev (Reference Yeh and Alexeev2014) found that minimizing the displacement at the centre of mass of a plunging and pitching foil can increase the efficiency by reducing the amount of the transported flow. It is also noticed that the
 ${\alpha _{eff,max}}$ contours in figure 12(a) and the efficiency contours in figure 5(b) are not entirely correlated. A very low efficiency region (
 $\varphi = 180$ to 225 with
 $\varepsilon > \; 0.0046$) in figure 5(b) is not captured by the contour of
 ${\alpha _{eff,max}}$ in figure 12. A close examination found that the trailing-edge amplitude in these cases becomes very small (figure 10), leading to very weak TEVs and thrust. This has led to a very low efficiency.
(a) The contours of the maximum angle of attack ( ${\alpha _{eff,max}}$) in the parametric space. (b) Motion of the fin ray swimming from right to left via plunging, pitching and actuation during one cycle for the ZA,
 ${H_T}{L_\eta }$,
 ${L_T}{L_\eta }$ and
 ${L_T}{H_\eta }$ cases. Dashed lines show the corresponding trajectory of the centre of mass of the fin ray.

Several studies (Buren et al. Reference Buren, Floryan and Smits2019; Zhu et al. Reference Zhu, Wang, Dong, Quinn, Bart-Smith, Di Santo, Wainwright and Lauder2019) observed that the maximum efficiency occurs when a foil has a clean ‘slicing motion’ in the flow in which the foil always orients along the slope of its trajectory. This type of motion minimizes the projection area of the fin ray to the incoming flow, therefore suppressing the LEVs and increasing the efficiency. The motion is also the most ‘biology-like’ motion in swimming and flight. Figure 12(b) shows the orientation and position of the fin ray at five different times during a cycle in the four representative cases. The fin rays are arranged by assuming they move from the right to the left with the inflow velocity. The corresponding trajectory of the centre of mass is also superimposed using the dashed line. It shows that the motion of the fin ray in the  ${L_T}{H_\eta }$ case is closest to the ‘slicing’ motion, i.e. the fin-ray orientation is closest to the slope of to the trajectory of the centre of mass. This better shows that fish could use the muscle actuation to achieve a slicing motion and maximize the propulsion efficiency.
3.5. Additional cases
Recognizing that the above results are limited to specific values of  ${\theta _0} = 0.392$ (2.1) and
 ${\varphi _h} = {\rm \pi}/2$ (2.2), we have expanded our investigation by generating two additional sets of parametric simulations to explore the impacts of the two parameters. In the first set, the pitching motion is suppressed by reducing
 ${\theta _0}$ to 0.196 while keeping the other conditions the same as in the original cases. In the second set,
 ${\varphi _h}$ is increased to
 $3{\rm \pi} /2$. We adopted the same approach to construct the parametric space. Given that
 $\varphi $ is observed to have a more pronounced impact on propulsion performance than
 ${\varepsilon _0}$, we apply the same incremental steps for
 $\varphi $, while
 ${\varepsilon _0}$ ranges from 0.001 to 0.007 with increments of 0.0012. Furthermore, we include an additional baseline case in each set-up to simulate cases without muscle actuation (
 ${\varepsilon _0} = 0$). Note that
 $St$ is kept at 0.4 in all the cases.
Figure 13 shows the contours of  $\eta $,
 ${\bar{C}_T}$,
 ${\alpha _{eff,max}}$ and T-L amplitude in the two sets of simulations in the parametric space of
 ${\varepsilon _0}$ and
 $\varphi $. The results from the original set-up are also included in the first column for the purpose of comparison. Similar to the previous findings, the phase angle of the root actuation is the critical parameter affecting the propulsion performance. In the
 ${\theta _0} = 0.196$ cases, the contour patterns of
 ${\bar{C}_T}$ and T-L amplitude remain similar to the original set-up, where root actuation increases
 ${\bar{C}_T}$ and the T-L amplitude when
 $\varphi $ is approximately between −45° (315°) and 135°. The positive correlation between
 ${\bar{C}_T}$ and T-L amplitude is also observed in most of the cases. The flow pattern in the thrust-favour region is mostly P. For the efficiency, however, the favourable phase angle range has shifted counterclockwise by 45° compared with the original set-up, leading to the maximum
 $\eta $ of 0.30 at
 $\varphi ={-} 45^\circ \;\textrm{(}315^\circ )$. The contour pattern of
 ${\alpha _{eff,max}}$ similarly displays an approximate 45° counterclockwise shift compared with the original set-up. The negative correlation between
 ${\alpha _{eff,max}}$ and
 $\eta $ is maintained, in which decreasing
 ${\alpha _{eff,max}}$ increases
 $\eta $, mirroring the behaviour of the original set-up. In the efficiency-favour region, the flow pattern is mostly 2S. Notably, within the region where
 ${\varepsilon _0}$ is high and
 $180^\circ < \varphi < 270^\circ $, the efficiency drops to negative values. In the original set-up, it is in this same region that the efficiency drops to the minimum – almost reaching zero. In both set-ups, this region corresponds to very low T-L amplitude. The flow pattern is 2P.
Contours of propulsion efficiency,  $\eta $, mean thrust coefficient,
 ${\bar{C}_T}$, maximum angle of attack,
 ${\alpha _{eff,max}}$, and trailing-edge amplitude to leading-edge amplitude ratio,
 $T\text{-}{L_{Amp.}}$, in the parametric space for the original,
 ${\theta _0} = 0.196$ and
 ${\varphi _h} = 3{\rm \pi} /2$ cases.

In the  ${\varphi _h} = 3{\rm \pi} /2$ cases, however, significant reductions are observed in both
 $\eta $ and
 ${\bar{C}_T}$. The majority of cases exhibit values of zero or negative values of
 $\eta $ and
 ${\bar{C}_T}$, suggesting that the underlying kinematics predominantly generates drag. The contours of T-L amplitude show an approximate clockwise 45° shift compared with the original set-up. The value of
 ${\alpha _{eff,max}}$ is significantly higher than those in the original set-up. The correlations between
 ${\bar{C}_T}$ and T-L amplitude as well as between
 $\eta $ and
 ${\alpha _{eff,max}}$ are absent. A comprehensive flow analysis reveals highly distinct flow patterns in these cases.
Taken together, the results from the additional cases support that, in the scenarios of propulsion characterized by relatively large  ${\bar{C}_T}$,
 ${\bar{C}_T}$ and T-L amplitude are generally positively correlated, and
 ${\alpha _{eff,max}}$ and
 $\eta $ are generally negatively correlated. In the thrust-favour region, the flow is dominated by the P wake pattern, while in the efficiency-favour region, the flow is dominated by the 2S wake pattern. The results also support that the phase relationship between the root offset and leading-edge pitching and plunging motions is the dominant factor in determining the T-L amplitude ratio, while the leading-edge flow dynamics is influenced by the kinematics of the entire fin ray, which can be quantified by the relative velocity at the centre of mass. In the scenarios of very small/negative
 ${\bar{C}_T}$, the aforementioned correlations are absent. Flow dynamics shows distinct wake patterns.
4. Conclusion
In this study, the effects of antagonistic muscle actuation on the propulsion of a bilaminar-structure fin ray were investigated using a two-dimensional computational FSI model. The structure and material properties of the model were adopted from experimental measurement. The effect of muscle actuation was modelled by introducing a root displacement offset between the two hemitrichs. Parametric FSI simulations were conducted by assuming a sinusoidal function of the root offset over a cycle and varying the amplitude and phase difference between the actuations and pitching/plunging motions. The relationships among the actuations, the resulting static shapes, kinematics, vortex dynamics and hydrodynamic performance as well as the underlying mechanisms were studied.
The results reveal that the root offset, particularly the phase difference between the offset and leading-edge pitching/plunging motion, can significantly change the fin ray's kinematics and affect the vortex dynamics and propulsion performance. In the scenarios of propulsion characterized by relatively large thrust, three performance regions can be identified, including a thrust-favour region, where the root actuations increase thrust but decrease efficiency, an efficiency-favour region, where the root actuations increase efficiency but slightly decrease thrust, and an efficiency-thrust-unfavour region where the root actuations decrease both the thrust and efficiency. There are no regions in which both thrust and efficiency can be simultaneously increased. The phase angles where the three regions are located appear to depend on kinematic parameters. In our parameter set-ups, the efficiency-favour region occurs between phase angles 225° and 315° when the pitching amplitude ( ${\theta _0}$) is 0.392. When the pitching amplitude is reduced to 0.196, this region is shifted to phase angles between 270° and 0° (315°). The thrust-favour region maintains the phase angles between −45° and 135° for both pitching amplitudes. Note that in one of the parameter set-ups, where
 ${\varphi _h} = 3{\rm \pi} /2$, the cases are predominantly marked by drag force and low efficiency. The three performance regions are absent in this scenario.
Focusing on the propulsion cases, in the thrust-favour region, the wake shows a ‘P’ pattern characterized by a sequence of TEV pairs, each shed from one cycle. Although LEVs also form, they quickly dissipate and only have a weak presence in the wake. Increasing the offset amplitude in this region enhances the thrust by generating larger trailing-edge amplitude and stronger TEVs. In contrast, the wake in the efficiency-favour region shows a ‘2S’ pattern characterized by a sequence of even-spaced TEVs with alternate opposite signs. The strength of the TEVs is smaller than those in the ‘P’ pattern. No or very weak LEVs are generated. In this region, the efficiency does not significantly change with the amplitude of the root offset. In the efficiency-thrust-unfavour region, the wake takes on a ‘2P’ pattern characterized by two vortex pairs shed in one cycle, formed by both TEVs and LEVs. The strength of the TEV is the lowest among the cases, and the root actuations significantly decrease the trailing-edge amplitude, leading to small trailing-edge amplitude and thus small thrust and efficiency.
Two strong correlations are found. First, the thrust coefficient positively correlates with the T-L amplitude ratio, suggesting that the T-L amplitude ratio is the dominant factor for thrust production. It is also found that the T-L amplitude ratio is primarily affected by the phase difference between the root actuation and pitching/plunging motion. In the thrust-favour region, the actuation generates the kinematics in phase with the original kinematics, resulting in a large T-L amplitude ratio and higher thrust. Second, the efficiency negatively correlates with the effective angle of attack at the centre of mass of the fin ray. Different from rigid and passively flexible plate/foils, in which the LEV dynamics is dominated by the leading-edge kinematic and often correlates with the angle of attack at the leading edge, we found that the LEV dynamics in our model is affected by the kinematics of the entire fin ray and is closely linked to the angle of attack at the centre of mass of the fin ray. In the efficiency-favour region, the angle of attack at the centre of mass of the fin ray is the smallest among the cases. It leads to a ‘slicing’ type of motion, which minimizes the projection area of the fin ray to the incoming flow, and thus suppresses the LEVs and increases the efficiency.
Our results suggest that the antagonistic muscle actuations on the bilaminar structure can effectively control the propulsive performance of a fin ray by actively adjusting the kinematics of the fin ray. The results also suggest that the phase relationship between the actuation and pitching/plunging motion is critical in the control. By adjusting the phase relationship, the actuations can amplify the trailing-edge amplitude for generating stronger TEVs and higher thrust or reduce the angle of attack at the centre of mass for suppressing LEVs and generating higher efficiency. These findings provide valuable insights into the design and control of bio-inspired underwater vehicles, which can lead to more efficient and agile underwater vehicles with improved manoeuvrability and energy efficiency.
Recent findings from a direct measurement of intrinsic caudal fin muscle recruitment in steady-swimming bluegill sunfish shed light on the dynamic interplay between muscle activity and hydrodynamic demands (Zhong et al. Reference Zhong, Zhu, Fish, Kerr, Downs, Bart-Smith and Quinn2021). Notably, an increase in muscle activity was observed at higher swimming speeds, indicating active involvement of muscle actuation to improve performance. Electromyographic techniques were also employed to record muscle group activities within the intrinsic tail musculature of bluegill sunfish across various swimming modes (Flammang & Lauder Reference Flammang and Lauder2008, Reference Flammang and Lauder2009). The measurement shows both magnitude and phase disparities among distinct muscle groups during individual beating cycles and diverse swimming modes, emphasizing the fish's continuous modulation of the fin ray's deformation and stiffness in both spatial and temporal dimensions to cater to its swimming requirements. Building upon these insights, our results suggest another novel mechanism that fish can actively manipulate the phase difference between hemistich actuation and caudal root kinematics to optimize performance tailored to specific needs. For instance, this control mechanism could facilitate the attainment of optimal thrust during rapid manoeuvres, while alternatively enhancing overall swimming efficiency during cruising scenarios. Collectively, these results offer valuable insights into the fundamental mechanisms underlying fish's locomotion strategies to achieve efficient and agile swimming performance.
It also worth pointing out the limitations of the current study. First, the model is only for a single fin ray. While the results have implications for active control of the swimming of a single plate or foil, they have limited implications for full fish fin swimming which involves 20–30 fin rays and the membrane between the fin rays which is expected to increase the hydrodynamic loading on the fin rays. Second, the current study uses a two-dimensional computational model, which has limitations in capturing three-dimensional effects, such as body undulation, lateral movement and the side-edge vortices whose presence can lead to decreased thrust and efficiency. Also, our model generates larger deformations compared with the experimental results (16.8 %) while conserving the overall deformation pattern along the ray, as shown in figure 2. The findings from FSI simulations indicate that the phase of muscle actuation, which directly corresponds to the overall ray deformation pattern, has a significantly greater influence on performance than the magnitude of actuation. Consequently, although the deformation error appears substantial, it would not affect the hydrodynamic relationships that are the primary focus of this study. Third, this caudal fin-ray model is constructed based on the data of pectoral fin rays because, to the best of our knowledge, no data about the caudal fin ray's material and structure is available in the literature. Fourth, a systematic exploration of the parameters, including the Strouhal number, maximum pitching and plunging amplitudes and pitching–plunging phase angle, is needed for a more comprehensive understanding. Lastly, a sinusoidal function is used to simplify the muscle actuations while real fish use much more complex actuations. Future studies are needed to incorporate more complex and realistic actuation patterns to help reveal the full mechanisms of fish fin swimming control. Future studies can also benefit from machine learning techniques for finding the optimal actuations patterns towards different swimming needs.
Acknowledgement
The numerical simulations were performed on the Extreme Science and Engineering Discovery Environment (XSEDE) using the award number TG-CTS180004.
Declaration of interests
The authors report no conflict of interest.



