Why are voters in some electoral constituencies able to successfully co-ordinate their balloting decisions on viable party offerings, while those in other constituencies are not? Prior work on voter co-ordination failures has tended to focus on two sets of challenges voters face in assessing the electoral viability of political parties: institutional factors – especially experience with democracy and translating votes into seats – and elite-level, supply-side factors such as the number of new party offerings.Footnote 1 Much less attention has been paid to the internal characteristics of the voting constituencies themselves, however.Footnote 2 This is somewhat surprising, given the vast literatures in political science and other disciplines concerned with how groups of people collectively internalize information, debate its implications, and work together (or at cross purposes) to form a consensus.Footnote 3
In the study of electoral politics, this potential shortcoming is best encapsulated by Cox’s warning that ‘a belief that socially defined groups will always be able to organize in the political arena seems to ignore the problem of collective action’.Footnote 4 Due to the fact that a party’s objective political viability is conditional on several individual voters’ subjective assessments – and given that these individual assessments are shaped by the collective group contextFootnote 5 – this study poses the question: What effect do constituency characteristics have on voters’ assessments of viability as a collective decision-making enterprise? Specifically, I examine the extent to which the level of socio-demographic diversity within the constituency interacts with district magnitude to either ease or inhibit voters’ ability to collectively co-ordinate around viable party offerings.
The field of organizational psychology has repeatedly demonstrated that socio-demographic diversity is, under certain conditions, one of the more salient inhibitors of collective decision-making processes,Footnote 6 and political scientists have long argued that diversity has the potential to tamp down co-operation and induce disagreement within groups.Footnote 7 This article begins with the supposition that voters would rather have a party representing their interests in the legislature than not.Footnote 8 I argue that socio-demographic diversity among voters complicates this task because diverse types of voters respond to political information differently, thus complicating the task of forming a consensus. This is especially true when larger numbers of votes are required for a party to win a seat in the constituency.
Because district magnitude is the primary determinant of proportionality when translating votes into seats,Footnote 9 it is also the institutional variable that most plausibly mediates the relationship between constituency diversity and voter co-ordination failures. Where district magnitude is low, the threat of disproportionality is high, and larger shares of voters in the district are required to support a party before it clears the seat-winning threshold. In this scenario, diversity is problematic in that it creates large groups of different types of voters who must struggle collectively toward a consensus. By contrast, where district magnitude is high, disproportionality is low and increasingly smaller subsets of voters are sufficient for a party to clear the seat-winning threshold. Constituency diversity is less problematic for voter co-ordination in this scenario.
The contributions of this study are twofold. First and foremost, the findings shed light on the role social diversity plays in determining the nature of electoral democracy. Social diversity has a problematic history in the study of democratic representation, where it has been associated with difficulty in creating nationalized policy bundles,Footnote 10 allocation of budgets toward targetable and particularistic policies,Footnote 11 fractionalization of the legislatureFootnote 12 and overall decreased economic development.Footnote 13 To a large extent, these results hinge on the assumption that differently comprised groups of voters successfully elect differently comprised groups of legislators to represent them. My contribution to these literatures is to specify under which circumstances this assumption is most plausible. If, in certain settings, social diversity leads to co-ordination failures among voters, then the composition of the national legislature will reflect a biased rather than a fractionalized representation of the voting public.
Secondly, the findings advanced here offer an alternative causal mechanism driving the positive empirical correlation we observe between socio-demographic diversity and party system size (the effective number of parties, or ENP) around the world. The standard theoretical story has been that socio-demographic diversity results in a diversity of preferences within the electorate, which in turn allows for the expression of increasingly more party platforms; that is, a diversity of preferences is reflected by a diversity of party offerings, and we thus observe larger party systems where diversity is high.Footnote 14 However, in this manuscript, I walk back the argument to an earlier link in the causal story. Namely, I argue that the positive correlation between increased diversity and ENP might also be due, in part, to collective action problems that give rise to co-ordination failures. Because co-ordination failures increase ENP, this alternative mechanism could be operating side by side with (or instead of) the preference mechanism under the right conditions. However, the normative implications of these two mechanisms are quite distinct.
In what follows, I summarize the organizational psychology literature on group decision making, especially the development of consensus in diverse settings. I tie these intuitions to specific findings in political science about the nature of campaign messages and voters’ ability to internalize political information. I next develop a theory whereby district magnitude mediates the relationship between diversity and co-ordination failure. My empirical test draws on data from over 46,000 survey respondents across 324 electoral districts in national lower house elections from twelve countries that use multi-member electoral systems. In the conclusion, I dwell on the differences between the ‘collective action’ mechanism advanced here versus the ‘diversity of preferences’ mechanism as posited by prior research, and discuss the implications of these differences in light of recent work on socio-demographic diversity and elections.
DIVERSITY AND CO-ORDINATION
I begin with the somewhat well-established finding in the field of organizational psychology that more diverse groups of people have difficulty developing a collectively held consensus across all or most individuals in the group. Put somewhat differently, a diverse group experiences difficulty in arriving at a common understanding of possible outcomes as well as the means by which they might evaluate (and, ultimately, realize) those outcomes. As Bell et al., in a review of the literature, concluded,Footnote 15 diversity arising from differences in demographic traits in particular – which are the types of traits under consideration here – can inhibit a group’s ability to achieve efficient outcomes.Footnote 16 This is the case for a number of reasons, two of which I will highlight here. To begin, more diverse groups of individuals have been found to possess differing viewpoints, ideas and opinions.Footnote 17 Because different ‘types’ of people want and value different things, increasing the number of types in a group should result in a more complicated preference space. Ultimately, increasing diversity thus increases disagreement among group members about what the outcome should look like.Footnote 18
Even if diverse individuals were to agree on outcomes, however, there is a second well-documented problem: different ‘types’ of people respond to the same informational stimulus in different ways.Footnote 19 This can be due to cognitive differences arising from personal experiences,Footnote 20 issues of framing,Footnote 21 or a preference for biased or reinforcing information.Footnote 22 A long line of empirical work in the field of political science has tended to reinforce this intuition. In both the American and comparative contexts, for example, we know that voters of different partisan persuasions,Footnote 23 political interest levels,Footnote 24 ages, military and parenting statuses,Footnote 25 education levels,Footnote 26 levels of political independence,Footnote 27 incomeFootnote 28 and political sophisticationFootnote 29 are all likely to experience and internalize political messages in differing capacities.
To the extent, then, that the group of voters is comprised of varying numbers of independents, veterans, parents, young people, better-educated people and so on, this group will face substantial difficulties in arriving at a collectively held understanding of the dynamics of the electoral contest in their district. Individuals in more diverse groups have been found to be less likely to pool information in order to arrive at common understandingsFootnote 30 and, furthermore, members of these diverse groups are also less likely to co-operate with other members when put to solving a task.Footnote 31 All of this amounts to collective problems in arriving at a consensus on both the preferred outcome as well as the necessary steps needed to bring about that outcome.Footnote 32 In the absence of consensus and co-operation, groups of people are unable to collectively deliberate their way through intricate tasks. They are, simply put, more prone to error.
Therefore the implication of this logic for the specifically political task of voter co-ordination around party offerings is straightforward: where information is imperfect, diversity can get in the way of voters’ co-ordination efforts, at least in certain institutional settings. But the question remains as to whether voting – and strategic voting, particularly – is a collective action problem and, therefore, whether the received wisdom of organizational psychology is applicable. Is strategic voting purely atomistic in nature, or is there reason to suspect that voters cast ballots with an eye toward how their likeminded brethren are voting?
Some landmark works on strategic voting note the inter-relatedness of individuals’ assessments of the ‘horse race’ as well as the collectively held goals they might share regarding which parties win the race. Aldrich, for example, argues that ‘elections are collective actions in which the outcome depends on actions taken by others’.Footnote 33 Later, Aldrich is even more specific in his characterization of voting as a collective action problem: ‘the problem of collective action is, in large part, that people who share the same values for collective choices may find it difficult to attain and maintain the ability to act on those shared interests’.Footnote 34 Similarly, Sen and Buchanan and Yoon discuss voting in elections in terms of large-n collective action, in which many individuals with incomplete information, imperfect communication and little in the way of enforcement mechanisms may nonetheless benefit from working together to realize shared interests (that is, they share similar preferences over party offerings).Footnote 35 As I have argued above, socio-demographic diversity enters the equation at the point at which a constituency of voters is carved up into larger or smaller groups exhibiting shared interests.
I am not advocating a wholesale move away from conceiving of voters as atomistic updaters who vote with an eye toward opinion polls, but essentially derive utility from the private benefits of voting. Rather, I am arguing along the lines of a somewhat similar approach taken by recent work on strategic voting and turnout that indicates there is more to atomistic updating than simply gauging public opinion in a vague sense; that is, even the atomistic voter is embedded in a social contextFootnote 36 and the level of diversity in this context will come to bear on how she seeks, receives and interprets information. Abrams, Iversen and Soskice, for example, discuss individual voters’ membership in ‘informal social networks’ and how these memberships shape their political discourse, choice of media consumption and vote decisions.Footnote 37 Feddersen also embeds voters in ‘groups of like-minded people’ who can be mobilized in support of commonly preferred party offerings.Footnote 38 Finally, Clough differentiates ‘global’ information about an electoral contest (public polling data) from ‘local’ information (derived from within social circles) and demonstrates that local information emerging from social group memberships can sometimes result in successful strategic voting even in the absence of reliable global information.Footnote 39
The extent of diversity in a district will structure the number, relative sizes and compositions of these social groupings within which individual voters reside. These studies indicate that, once situated, voters prioritize their own social group’s information and understanding of the horse race over other groups’. But in the determination of co-ordination failures among voters, diversity is only part of the story. The above effects should be amplified as larger groups of voters are required to push a party across the seat-winning threshold – that is, as electoral institutions become less permissive in translating votes into seats. I now turn to this mediating role of institutions.
THE MEDIATING ROLE OF ELECTORAL PERMISSIVENESS
District magnitude is the primary determinant of the level of permissiveness in the translation of votes into seats,Footnote 40 and this permissiveness might be thought of as a threshold of representation: as magnitude increases, the threshold of representation decreases, meaning that the percentage of voters required to support a party in order for it to win a seat decreases as well.Footnote 41 Regardless of district magnitude, and given the ‘first-order’ salience of national-level elections, voters possess incentives to not waste their votes on nonviable parties.Footnote 42 Voters’ ability to vote strategically, however, hinges critically on their ability to make correct prospective assessments of individual parties’ electoral viability. Variation in district magnitude thus induces variation in the number of voters that must see eye to eye in assessing any individual party’s viability.
Larger groups are not in all cases more diverse than smaller groups, but even among fairly homogeneous groups, increasing membership size results in a host of co-ordination problems.Footnote 43 Allowing for the fact that – holding constituency-level diversity constant – increasing the size of any subgroup in a district will at least not decrease the group’s diversity, we would expect that when larger groups of voters are required to ensure a party wins a seat, co-ordination efforts become increasingly problematic for all of the reasons discussed above. When the threshold of representation is high, subgroups of voters who may be quite distinct from one another socio-demographically will have to co-ordinate their efforts to elect their most-preferred (or, at least, sufficiently preferred) parties. Overcoming demographic differences to realize mutually held preferences, however, is a daunting task.
Putting the pieces of the argument together, then, we should expect diversity to influence voter co-ordination differently at different district magnitudes. The threshold of representation can either be comparatively large or comparatively small, depending on magnitude. Similarly, the numbers and sizes of subgroups of voters – as structured by their natural socio-demographic differences – can either be large or small. When district magnitude and diversity are both low, then we have coherence between the number of voters needed to mechanically support a party and the number of voters who likely understand the electoral competition and the nature of choices in a similar manner. By contrast, where diversity is high in low-magnitude situations, groups of different-looking voters – who are not predisposed to prefer and understand the same party choices in the same way – must struggle to co-ordinate their efforts around viable parties. The expectation is that co-ordination failures would be higher in low-magnitude districts with high diversity levels than in low-magnitude districts with comparatively more homogeneous voters.
As district magnitude increases, the strength of this relationship should decline and eventually become indistinguishable from zero. Here, the threshold of representation is comparatively smaller. When higher diversity levels carve the voting constituency into smaller subsets of like-minded individuals, then these voters can safely work within their distinct subgroups to co-ordinate around viable parties. Gone are the agglomerative mechanical pressures induced by low-magnitude districts; rather, comparatively smaller groups might potentially contain enough voters, by themselves, to push parties over the threshold of representation. The foregoing discussion leads to my main hypothesis: Increasing constituency diversity will make voter co-ordination more difficult when district magnitude is low; as district magnitude increases, the effect of increasing diversity on voter co-ordination will dissipate and, eventually, disappear altogether.Footnote 44 Following from the prior literature on strategic voting and district magnitude, which argues that the incentive for voters to vote strategically tapers to 0 around M=5,Footnote 45 I more specifically expect that increasing diversity induces co-ordination failure where M≤5, but has no discernible effect where M>5.
MEASUREMENT AND DATA
The two primary sources of constituency-level data in this study are the most recent release of the Global Election Database by Brancati and the first three waves of the Comparative Study of Electoral Systems (CSES) survey database.Footnote 46 The Global Elections Database is the most dependable source for constituency-level electoral data, because it possesses remarkably complete data on seats, votes and district magnitudes at this level. It also disaggregates vote shares for smaller parties – no matter how small – at the party level (whereas many databases lump these into an ‘other parties’ category) and pays meticulous attention to changes in party labels.Footnote 47 Both of these characteristics of the database are important for the purposes of constructing several variables in the analysis below. The CSES, my second major data source, is the most appropriate survey repository for the research question at hand because it includes district-level identifiers for the respondents, which allows the researcher to construct snapshots of each electoral district in the country. All told, I have data for more than 46,000 survey respondents across 324 electoral districts in thirty-two national lower house elections in twelve multi-member proportional representation countries.Footnote 48
As will be described in greater detail below (and in even further detail in Appendix A1), this selection of countries and elections was largely driven by data availability. Single-member district (SMD) countries were dropped from the analysis because the CSES had too few respondents in each district (on average, less than 10 per district) to allow for even approximate representativeness in the sample. Luckily, however, among the multi-member countries included in the analysis, there are several individual single-member constituencies,Footnote 49 and thus the findings on SMD constituencies presented below are grounded in empirical cases (rather than extrapolated).Footnote 50 The CSES coverage, which typically begins in the mid-1990s, also prevents constructing longer series of election data because including elections earlier than the 1990s requires extrapolating the CSES data values backward in time. Rather than commit this unjustifiable extension of the database, I have opted to focus on elections actually covered by the CSES. This results in a fairly sizable set of observations (871 country-election-district data points). I now discuss how each variable was measured in turn.
Measuring Co-ordination Failure
Empirically measuring co-ordination failure among voters has been a subject of much debate within the subfield of electoral politics. In the context of single-member constituencies, Laakso and Taagepera have advanced ENP as one potential measure;Footnote 51 in broader, multi-member contexts, various authors have proposed wasted or hopeless votesFootnote 52 or the second-to-first loser, or ‘SF ratio’.Footnote 53 Although they provide different snapshots of co-ordination failures, none of these measures is able to represent both (1) the extent of votes cast in favor of parties that are ultimately far off of winning a seat and (2) the level of diffusion or concentration in votes across these parties. All of these measures, then, have been criticized for their inability to accurately reflect both the incidence and magnitude of co-ordination failure at the constituency level.Footnote 54 An alternative measure – the co-ordination product – has recently been advanced as a potentially viable alternative to these previous measures.Footnote 55
Measuring the co-ordination product involves two steps: calculating the number of wasted votes cast in the constituency and then multiplying this number by the Effective Number of Losing Parties (ENLP) – parties that did not win at least one seat in the constituency.Footnote 56 Examining wasted votes – or ballots that were cast in favor of parties that ultimately did not win any seats in the districtFootnote 57 – provides a measure of the overall share of voters in the district that was unable to correctly assess the viability of party offerings on election day. Straightforwardly, higher vote wastage values indicate more co-ordination failure. However, it is also important to consider the distribution of this wastage across losing parties, especially in multiparty systems. The same number of wasted votes in a district can either be spread uniformly across all losing parties or clustered around one ‘major’ losing party that fell just shy of winning a seat. The former scenario would indicate a large ENLP, while the latter indicates a comparatively smaller ENLP. As ENLP increases, voters are becoming increasingly confused about which losing alternative was the closest to being viable.
Following Crisp, Olivella and Potter, I define ENLP in line with the standard formulation advanced by Laakso and Taagepera, but rescaled to focus only on those parties (p
i
) in the district that did not win a seat, such that
 $$\mathop{\sum}\nolimits_{i=1}^n {p_{i} } =1$$
.Footnote
58
Higher values, therefore, indicate a more diffuse set of vote shares across losing parties. This value is then multiplied by the total number of wasted votes, thereby incorporating in one measure both the extent and the distribution of co-ordination problems among voters in the district:
 $${\rm coordination}\,{\rm product}={\rm wasted}\,{\rm votes}{\times}\left( {\mathop \sum\limits_{i=1}^n {\rm \ztbnd }p_{i} } \right)^{2} {1 \over {\sum_{i=1}^n {\rm \ztbnd }p_{i}^{2} }}.$$
Given the formulation of co-ordination product, then, wasted votes are magnified when they are diffused across several (clearly non-viable) parties, and dampened when they are concentrated on just a few (very nearly viable) parties. Values near 0 indicate little co-ordination failure among voters, while values around 2, 3 or higher indicate more substantial confusion among voters about which party offerings are (or are not) viable.Footnote 59 Values of co-ordination product are assigned to each district in each election.Footnote 60
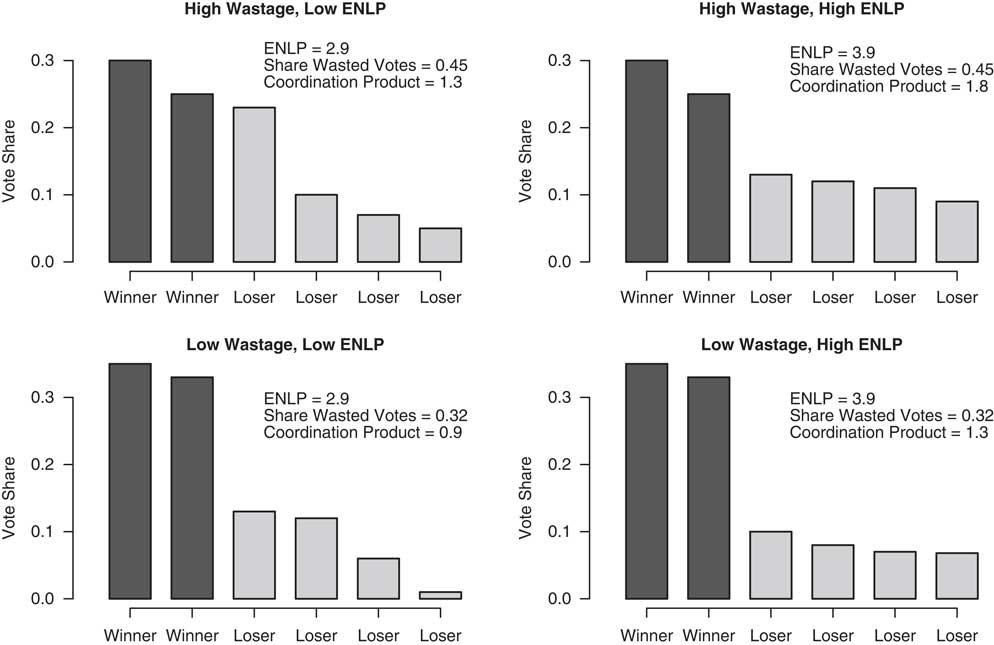
The four panels of Figure 1 illustrate values of ENLP, wasted votes and co-ordination product for various distributions of vote shares in a multimember electoral district with multiple parties. In all cases, six parties are competing and the top two finishing parties won seats. The percentage of votes each party received is graphed along the y-axis and each bar indicates the vote share of an individual party, with seat-winning parties darkly shaded and losing parties lightly shaded. Consider the two top panels, where 45 per cent of the votes have gone to losing parties. In the top-left panel, however, the distribution of this 45 per cent is considerably narrower than at the top right. That is, there appeared to be far more consensus about which losing party was nearly a winner in the left scenario than in the right. Accordingly, the ENLP value is 2.9 in the left and 3.9 in the right, resulting in a larger co-ordination product in the latter (1.8 versus 1.3). The co-ordination product metric thus effectively differentiates between these two scenarios and assigns the more diffuse vote distribution a higher level of voter co-ordination failure.
Examples of co-ordination product

In the bottom panels, each has only 32 per cent of votes for losing parties; relative to the top row, the winning parties won here by much larger margins. The bottom left and bottom right panels’ ENLP values remain identical to their corresponding top row panels, indicating similar distributions of votes across losing parties. Moving from the top left to the bottom left, we straightforwardly decrease the co-ordination product from 1.3 to 0.9 because we have decreased the overall amount of wasted votes (but left intact the relative distribution of these votes). Moving from the top left to the bottom right, we register the same value for the co-ordination product, but for different reasons: namely, that the extent of wastage is larger in the upper left, but the distribution of this waste is more problematic in the lower right. The virtue of the co-ordination product is that it treats these two scenarios analogously.
Measuring Constituency Diversity
Scholars of legislative elections have advanced a number of measures of social diversity, although none has been both cast at the level of the individual electoral constituency and has incorporated data across multiple social cleavages.Footnote 61 An ideal measure of constituency diversity would take as its unit of comparison an individual voter’s socio-demographic traits. By comparing several voters’ socio-demographic traits against one another, the measure would return an estimate of similarity or dissimilarity across all voters in the constituency. Additionally, we would want the calculation to be able to handle multiple types of traits (that is, ethnicity, religion, income, etc.) simultaneously, while at the same time remaining a priori agnostic about how these traits overlap or reinforce one another. That is, to the extent possible, we want the data to be able to speak for itself unhindered by the researcher’s assumptions about which traits are the most important.Footnote 62 I argue that calculating a statistic called Krippendorff’s alpha across voters’ values on several socio-demographic variables is the best way of satisfying these criteria.
Krippendorff’s alpha is a standard measure of inter-coder reliability employed in the field of psychometric testing. Relative to other indices of reliability, Krippendorff’s alpha is sufficiently flexible to incorporate myriad types of data (including individual responses on survey instruments)Footnote 63 and it has previously been employed in the study of social diversity in the field of political science.Footnote 64 Additionally, the measure corrects for small sample sizes and the presence of missing data.Footnote 65 For the purposes of measuring constituency diversity, let voters conceptually stand in for coders; each voter’s values along each of six attributes represent six items across which each voter is coded (the six items are ethnicity, language, religion, urbanness, income and regime support).Footnote 66 As more voters’ demographic traits are ‘coded’ in similar ways, then Krippendorff’s alpha takes on values closer to 1 with 1 representing perfect similarity – or uniformity – across all voters’ traits. To reflect the idea of constituency diversity, I rescale this value by subtracting it from 1, such that values close to 0 indicate low levels of diversity whereas values closer to 1 indicate higher levels of diversity.
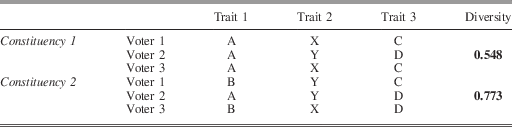
A stylized representation of constituency diversity is depicted in Table 1. Each scenario is comprised of three voters, and each column indicates these voters’ values across three generic traits. The level of constituency diversity is lower in the first constituency than the second for multiple reasons: first, because all voters are uniform along the first trait in Constituency 1, but not Constituency 2; and secondly, because the values for Traits 2 and 3 are correlated with one another in Constituency 1, but not Constituency 2. Put differently, the traits are reinforcing in Constituency 1, but are cross-cutting in Constituency 2. As traits become increasingly orthogonal to one another, they cross-cut the population into multiple groups and thus increase the level of diversity.
Constituency Diversity: Examples of Krippendorff’s α

Note: different letters indicate different values for each of several attributes.
In order to calculate these diversity values, I utilized individual-level survey response data from the CSES. Admittedly, since the CSES does not randomly sample at the district level, the district-level socio-demographic distributions depicted in the data might be slightly biased. As cross-national survey data that randomly samples at the district level are virtually non-existent, however, Stoll has called the CSES the ‘best case’ repository for comparative work.Footnote 67 In order to use this data in as principled a fashion as possible, I attempt to account for the potential non-representativeness of the district-level samples in a number of critical ways. First, I pooled multiple waves of the CSES within the same country in order to provide a more accurate portrait of a district’s voting population, calculating diversity levels based on voters’ values across each of the six socio-demographic attributes, and thus assigned each district one time-invariant value of diversity. This dramatically increases the number of respondents located within each district – on average 128 individuals and frequently in excess of 300 individuals – and provides a more complete snapshot of the district’s voters. Here, I appeal to the idea that more sizable samples are inherently more representative.Footnote 68
Secondly, I drop from the regression analysis any ‘low-response’ districts; that is, I divide the total number of survey respondents in a district by that district’s voting population and cull from the dataset those districts that fall at or below the first percentile of the distribution of this variable’s values. This approach ensures that the results are not predicated on the inclusion of those districts most likely – but not necessarily – to be unrepresentative of the district-level aggregate. Admittedly, this first-percentile cut-point is somewhat arbitrary. In Appendix A8, however, I demonstrate that the results are robust to dropping districts at or below the fifth percentile as well as dropping them at or below the tenth percentile. Employing these far more stringent drop points does not affect the statistical or substantive importance of the results presented below. In Appendix A8, I also include a model with no cut-point at all. The results are unaffected.
Measuring Other Variables
I have two metrics of district magnitude, a concept that is defined as the number of elected representatives in a constituency. Values for this variable are taken directly from the Global Elections Database. The first metric accounts for the diminishing returns to proportionality at higher magnitudes, and is simply the logged function of district magnitude in its continuous form.Footnote 69 The second metric taps into a conceptually motivated distinction between ‘low’ and ‘high’ magnitude districts developed by previous scholarship: I construct a dummy indicator of low-magnitude districts that have magnitude of 5 or less. In separate models, I include either the logged (continuous) version of magnitude or the low-magnitude dummy variable. In the presentation of the results that follow, this allows for both fine-grained (continuous-logged) and theoretically motivated (dichotomous) interpretations of the mediating impact of magnitude on diversity’s effect on voter co-ordination.Footnote 70
I control for the number of new parties entering the constituency, as this has been hypothesized to present voters with an unfamiliar choice set, therefore making it more difficult for them to assess parties’ viability.Footnote 71 Following Crisp, Olivella and Potter, I operationalize the number of new parties as a percentage of district magnitude (since higher district magnitudes should be mechanically related to higher rates of new party entry).Footnote 72 Whenever a party label appeared in a given constituency in one election – but not the previous election – that party label was coded as ‘new’ and these data were also taken from the Global Elections Database.Footnote 73
I also control for two additional, national-level variables: whether the country is federal in its political organization and whether a compensatory tier is used during elections to allow for a more proportional translation of votes into seats. The impact of federal systems on constituency-level tactical voting is a matter of debate, with little empirical evidence pointing one way or the other.Footnote 74 While decentralized political power might prompt voters to be non-strategic in national, lower house elections because they are casting ballots with an eye toward local races, it might also – by virtue of increasing the salience of these subnational contests – simply increase the number of important, first-order elections voters participate in. Especially where there is no variation across electoral rules, then, we might expect federalism to decrease voter co-ordination failure by virtue of providing them with more election iterations. I control for federalism with a dummy variable provided by Treisman.Footnote 75 In the presence of compensatory electoral tiers, voters may be hesitant to strategically defect if their votes will help the party in a second (non-constituency-based) level of seat allocation.Footnote 76 I control for the existence of compensatory tiers with a dummy variable taken from Golder.Footnote 77
Finally, I control for the level of cross-district diversity. It is important to note that by cross-district diversity, I mean something different than ethnolinguistic fractionalization at the national level (the empirical efficacy of which has been highly unreliable across district-level cross-national studies of voter co-ordination). Rather, I consider the modal values of each of the six socio-demographic characteristics in each electoral district and repeat the Krippendorff’s alpha calculation across all districts in a country. This provides an omnibus assessment of the extent to which districts in a country are, on average, socio-demographically similar to one another. The measure returns plausible values, with fairly homogenous countries such as Sweden, Finland and Poland all receiving very low cross-constituency diversity scores (around 0.2 to 0.3) and more heterogeneous countries such as Switzerland receiving comparatively high scores (around 0.7 and 0.8).Footnote 78 The theoretical expectation is that, as districts become less socio-demographically similar to one another, voters will be less able to rely on the state of electoral races in other districts to shed light on the state of their own race. That is, as cross-constituency diversity increases, each electoral constituency becomes more unique and the relationship between voters and parties in this constituency will look less similar to the relationship in some other constituency.Footnote 79
TESTING THE THEORY
The structure of the data is such that country-election-district-specific outcomes are nested within districts, which are, in turn, nested within countries. Because of this multilevel structure of the data, I employ a hierarchical linear modelFootnote 80 with random intercepts at the district and country levels. These intercepts allow me to account for various unobserved and idiosyncratic dynamics in each electoral context as well as time dependencies at the district level.Footnote 81 The coefficients, then, are interpretable as general statements of the substantive impact of the explanatory variables systematically across cases. The random intercepts additionally allow for the fact that there might be something unique to all observations within a certain district or country that predisposes these observations to having a higher or lower underlying co-ordination product before even considering the more systemic influences of the explanatory variables. The model is defined as:
 $$\eqalignno{ & {\rm Co{\hbox -}ordination}_{{cde}} :N\left( {\gamma _{d} {\plus}X_{{cde}} \beta ,\sigma _{{cde}}^{2} } \right) \cr & \gamma _{{cd}} :N\left( {\gamma _{c} {\plus}X_{{cd}} \xi ,\sigma _{d}^{2} } \right) \cr & \gamma _{c} :N\left( {X_{c} \delta ,\sigma _{c}^{2} } \right), $$
where Co-ordination cde is the level of voter co-ordination in district d during election e in country c; X cde is a matrix of election-district-level variables, such as new parties; γ d is a random intercept at the district level; X cd is a matrix of district-specific variables, such as diversity and district magnitude; γ c is a random intercept at the country level; X c is a matrix of country-level variables, such as federalism and the existence of a compensatory tier; and β, ξ and δ are vectors of estimated coefficients. The modeling framework also returns measures of variance at both the level of the individual outcome as well as across the district-level and country-level random intercepts.
I estimate two models in series and include one of two separate measures of district magnitude in each – a (logged) continuous measure and a low- versus high-magnitude discretization – and their interaction with diversity. The same set of control variables is included in each model. The regression output includes measures of goodness of fit and the distribution of observations across different hierarchies in the data. I also graph the marginal effect of diversity conditional on the continuous and dichotomous versions of magnitude.Footnote 82
Results
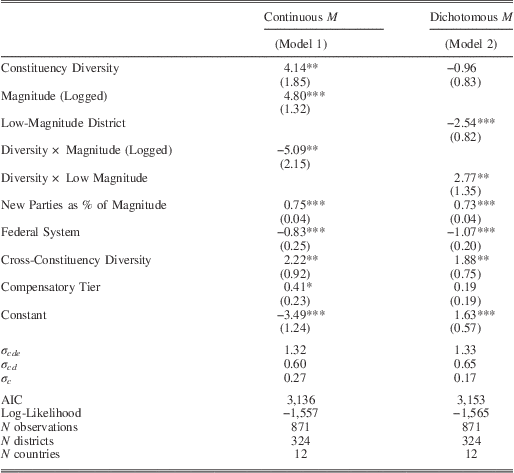
The results from both models appear in Table 2. In a general sense, the models wield substantial power in explaining variation in co-ordination product across districts in these twelve countries: virtually all of the coefficients – even those of the control variables – return statistically significant coefficients in the theoretically anticipated direction,Footnote 83 and the goodness-of-fit statistics indicate that the models are able to account for a great deal of variation in the outcome variable.Footnote 84 As was hypothesized, the interaction effect in Model 1 between diversity and (logged) district magnitude assumes a negative sign, indicating that increasing diversity at low magnitudes increases co-ordination failure, but this effect tapers to 0 at higher district magnitudes. Similarly, working with the ‘low-magnitude’ indicator in Model 2, we predictably observe an interaction coefficient of the opposite sign: increasing diversity drives up co-ordination problems in a low-magnitude district (that is, the dummy equals 1), but this effect does not exist in larger-magnitude districts (specifically, in districts above M=5).
Hierarchical Models of the Effects of Diversity and Magnitude on Co-ordination

Note: the co-ordination product is the dependent variable, where more positive values indicate more co-ordination failure. Standard errors appear below coefficient estimates in parentheses. *Indicates significance at the 10 per cent level; **at 5 per cent level; and ***at 1 per cent level
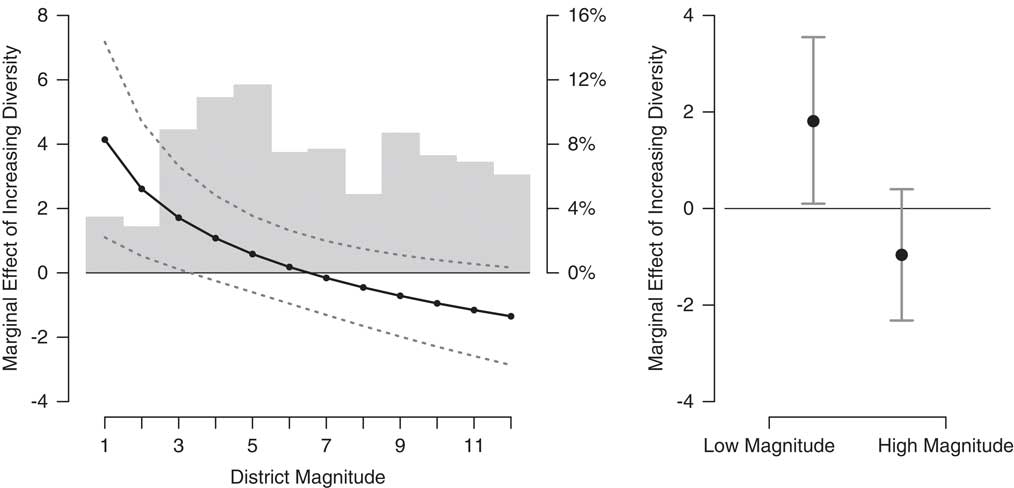
Figure 2 illustrates these marginal effects. The left panel corresponds to Model 1 and includes a histogram of observed values for district magnitude.Footnote 85 Darker point estimates of the predicted marginal effect of increasing diversity conditional on magnitude are surrounded by 90 per cent confidence intervals. For districts of M=3 or less (which is about 15 per cent of the districts in the dataset), increasing diversity contributes to co-ordination failures among voters. As hypothesized, this effect disappears at higher magnitude values. A similar story is told in the right-hand panel of Figure 2, where districts have been lumped into small and large categories. Diversity exerts a positive and statistically significant effect on voter co-ordination failures in low-magnitude districts (which constitute about 37 per cent of the data), but this effect clearly disappears in higher-magnitude districts.
Marginal effect of increasing constituency diversity on co-ordination failure in different district magnitudes Note: the left pane is based on a continuous measure of magnitude from Model 1, while the right pane is based on a dichotomous measure from Model 2. In both panes, 90 per cent confidence bands around estimated effects are represented either by dashed lines (left) or brackets (right). The left pane includes a histogram of the distribution of magnitude values (percentage of distribution tracked on the right-hand y-axis).

Some substantive examples of these effects are telling – especially if they can be drawn from within the bounds of the same country-election, thereby holding constant potentially confounding factors. Consider the case of Austria in 2008. In two lower-magnitude districts, Villach and Klagenfurt (both M=1), the higher-diversity case resulted in increased voter failure relative to the lower-diversity case. Klagenfurt’s diversity level of 0.7 resulted in a co-ordination product of 2.3, while Villach’s diversity (0.4) resulted in a considerably lower level of co-ordination failure (1.2, nearly one standard deviation lower). To illustrate the mediating effect of district magnitude, however, consider two other, larger-magnitude districts in Austria in the same year. Weinviertel and Hausruckviertel both had district magnitudes of 5, yet the former was less diverse (0.5) than the latter (0.6). There was, however, very little difference in their co-ordination products (2.6 versus 2.8), indicating that more diversity matters much less for voter co-ordination failures in larger-magnitude situations.
Similar illustrative relationships can be found in the other countries included in the analysis, among them Spain in 2008. In the low-magnitude Spanish districts of Cuenca and Segovia (both M=3), the more diverse constituency (Segovia, at 0.6) had considerably more co-ordination failure than the less diverse constituency (2.3 as opposed to 0.8). This effect essentially disappears at higher district magnitudes: the constituencies of Las Palmas, Baleares and A Coruna (all M=8) had diversity levels of 0.6, 0.7 and 0.8, respectively, but co-ordination products of 2.4, 1.6 and 1.3, respectively. Clearly, the linearly positive relationship between diversity and co-ordination failure we found at lower magnitudes is not present at higher magnitudes even within the same year and within the same country.
In Ireland in 2002, we can also explore the substantive import of the marginal effect of increasing diversity on co-ordination failure, conditional on district magnitude. The low-magnitude districts of South Kildare and Southwest Cork (both M=3) had marginally different diversity levels (0.6 and 0.7, respectively), but this implied substantially different co-ordination products (0.8 and 3.5, respectively). By contrast, the higher-magnitude districts of South Central Cork and Mayo (both M=5 or a point at which the marginal effect is no longer statistically discernible from 0), assumed identical levels of diversity as South Kildare and Southwest Cork (0.6 and 0.7), but had essentially no meaningful difference in co-ordination products (2.3 and 2.9, respectively). Here again, the lower-magnitude effect evaporates in higher-magnitude constituencies.
Aside from these main findings, the control variables in each of the models tend to confirm our understanding of what causes complications for voters in assessing party viability. This is encouraging, because it indicates that the model possesses a level of predictive power far in excess of what an examination of constituency diversity, district magnitude and their interaction is able to achieve. All of the covariates are statistically significant, and most operate in the expected direction: increasing the number of new parties, cross-district diversity and introducing a compensatory tier of seat allocation will all complicate voters’ ability to correctly co-ordinate around viable parties. The co-ordination product is systematically lower in federal countries by 0.83 (in Model 1), which is a substantial value along the co-ordination product metric. This finding is slightly at odds with prior theorizing, but makes sense in light of the burgeoning literature on ‘second-order’ elections: when actual decision-making power exists at the subnational level, voters are more likely to vote strategically rather than expressively.Footnote 86 Rather than decentralized political power distracting voters, then, it seems to present voters with additional electoral iterations with which to become acquainted with patterns of party competition.
The particularly strong performance of cross-district diversity bears additional discussion, as this is a novel – and substantial – supplementary finding. Moving from a situation in which all electoral districts resemble one another uniformly (a cross-district value of 0) to one in which all electoral districts are nothing alike socio-demographically (a value of 1), would systematically increase the co-ordination product within each district by 2.22 (in Model 1), which is an increase of 1.3 standard deviations. This is sufficient, simply put, to throw the electoral landscape into near-total chaos, thereby undermining the predictability of electoral politics. In line with recent work,Footnote 87 this relationship productively demonstrates that no district is an island, perfectly isolated from national trends and cross-district campaign dynamics. Although additional research would be needed in order to substantiate the link definitively, it appears that voters are paying attention to the ‘horse race’ in other districts in an effort to shed light on the dynamics in their own district.
Assessing Robustness
I conducted a number of robustness checks to assess the strength of the findings. Despite the fact that diversity’s adverse effect on voter co-ordination is discernible in only a subset of magnitudes, this effect is nonetheless remarkably robust across a number of alternative model specifications and measurement strategies. Space constraints prevent me from developing more than a cursory discussion of these additional tests, but interested readers are referred to more extensive materials presented in a series of appendices.
To rule out the possibility that districts where M=1 might be artificially biasing the results, I drop these observations and repeat Models 1 and 2 above in Appendix A5. Interestingly, the marginal effects derived from both models are actually strengthened in the absence of these observations, with increasing diversity resulting in more co-ordination failure in districts where M≤5. To rule out the possibility that countries with the most observations are driving the results (namely Spain, Romania and Poland), in Appendix A6 I jackknife the results, dropping one country at a time and repeating the specification of Model 1 above. The coefficients of interest never switch signs, and in all but one case – Sweden – remain highly statistically significant. In Appendix A7, I include an expanded set of over-time controls, such as lagged vote volatility and democratic experience; while these inclusions shrink the dataset, they do nothing to undermine the main results.
To address concerns of district-level sampling, in Appendix A8 I drop districts that fall below the fifth and tenth percentiles of district-level response rates in the dataset and repeat the analysis. Though an imperfect fix, these more stringent cut-points of inclusion at least exclude districts where responses were probabilistically least representative of the actual voting population. These exclusions – and the restricted subset of observations they create – do not affect the results. Finally, Appendices A9 and A10 take up the question of alternative measurement strategies for voter co-ordination failures and district-level diversity, respectively. The results I present above are not affected by the measurement decisions surrounding the dependent variable and main independent variable.
DISCUSSION
The novel contribution of the present manuscript is to posit a new causal mechanism that links diversity and institutions, on the one hand, to party system size, on the other. The standard theoretical story has been that socio-demographic diversity results in a diversity of preferences within the electorate, which, in turn, allows for increasingly more party platforms. Rather than offering another study of the determinants of ENP, however, in this manuscript I walk back the argument to an earlier link in the causal story. Namely, I argue that the positive correlation between increased diversity and ENP might not only be due to the (traditionally assumed) preference mechanism, but also, at least in part, to collective action problems that give rise to co-ordination failures. Because co-ordination failures increase ENP, this alternative mechanism could be operating side by side with (or instead of) the preference mechanism in certain combinations of district magnitude and diversity.
The existence of this competing mechanism in low-magnitude (but high-diversity) districts offers some interesting insights into recent empirical findings in comparative electoral studies. For instance, recent work by Moser and Scheiner convincingly argues that increasing diversity even in low-magnitude districts can increase party system size.Footnote 88 They argue that, in a sense, increasing diversity will always additively increase ENP, regardless of magnitude. Why is this the case? Although Moser and Scheiner call for additional work investigating the causal mechanisms underlying this relationship, they offer one intuition, which is supported by Alvarez, Boehmke and Nagler: that voters are simply myopic and, regardless of institutional incentives, support their sincerely most-preferred party.Footnote 89 One interpretation of the results I present here poses a counterargument: voters may well understand the institutional incentives of low-magnitude districts and attempt to act strategically, but nonetheless their efforts may be foiled when diversity is high. In this situation, with poor co-ordination comes increased party system size, derived not from myopia, but rather from roadblocks to the successful navigation of the institutional incentives.
This is an important point for constitution designers and other election practitioners. To the extent that we normatively prioritize predictability in the translation of votes into seats – as has been one of the major evaluative criteria of electoral institutions for many yearsFootnote 90 – then smaller district magnitudes might well be the ‘incorrect’ institutional rule for the most heterogeneous areas of a country. When magnitude and diversity are at odds with one another, co-ordination failures run rampant. We would expect disillusioned voters, biased electoral outcomes and, perhaps, lower levels of voter turnout and less support at the individual level for democratic institutions. These are all plausible and potentially fascinating avenues for future research.
The agenda could be pushed further, specifically as it relates to policy production. It is typically argued that high levels of diversity fracture the legislative body across many parties. Diversity also potentially inhibits the production of normatively desirable policy by pushing legislators away from public goods. But these relationships should only hold true when diversity among voters leads to diversity among representatives. When electoral rules prevent diverse groups from obtaining the requisite level of consensus building required to make correct viability calculations, however, this should not be the case. If rules get in the way, we might instead observe a systematically biased selection of parties rather than a meaningful (in terms of strategic vote choice) proliferation of parties when diversity is high.
I close with a caveat: this study is somewhat limited in its cross-national coverage due to data availability. Although SMDs do appear in the analysis, they are embedded in broader, multimember district systems, which, as scholars such as Singer have noted, tends to result in voters in SMDs thinking differently about politics than they do in pure SMD systems, like Canada and the United States.Footnote 91 Thus an adequate test of the theory in the context of these countries remains a task for future study. Still, the results presented here are noteworthy. Diversity clearly inhibits co-ordination in some contexts but not others, and this important finding should inform future efforts that assess how diversity is most effectively dealt with in electoral democracies.