

INTRODUCTION
Considering the outlying nature of the province, the tradition of building in stone that Rome introduced to Britain in a.d. 43 is expressed in a surprising number and variety of surviving edifices — some military, others public or religious and some domestic — exploiting a wide range of by no means always local geomaterials.Footnote 1 The typical masonry facing-style of these structures is known under the modern name of petit appareil, which Adam,Footnote 2 drawing chiefly on Gallic examples, defined visually rather than verbally, and with little reference to quantitative aspects. As illustrated, petit appareil would appear to be extremely variable, but may be said to comprise fairly regular horizontal courses of more or less roughly dressed, small- to medium-sized blocks of general-purpose stone with moderately wide to wide mortar joints. But exactly how big are these blocks and what proportions do they take, and why does proportion and scale seem to vary so considerably between buildings and over time? To what extent was the choice of scale and proportion influenced by geological considerations or by the status, traditions and resources of the builders? Did aesthetic or other issues ever dominate over those of availability, suitability and cost?
This paper attempts to explore aspects of these questions in the context of a substantial sample of sufficiently well-preserved, Roman masonry structures surviving in Britain. It does so using a metrical approach that, in a less-developed form, has had some success in the characterization and comparison of masonry styles in post-Roman buildings.Footnote 3
LITHOMETRIC ANALYSIS
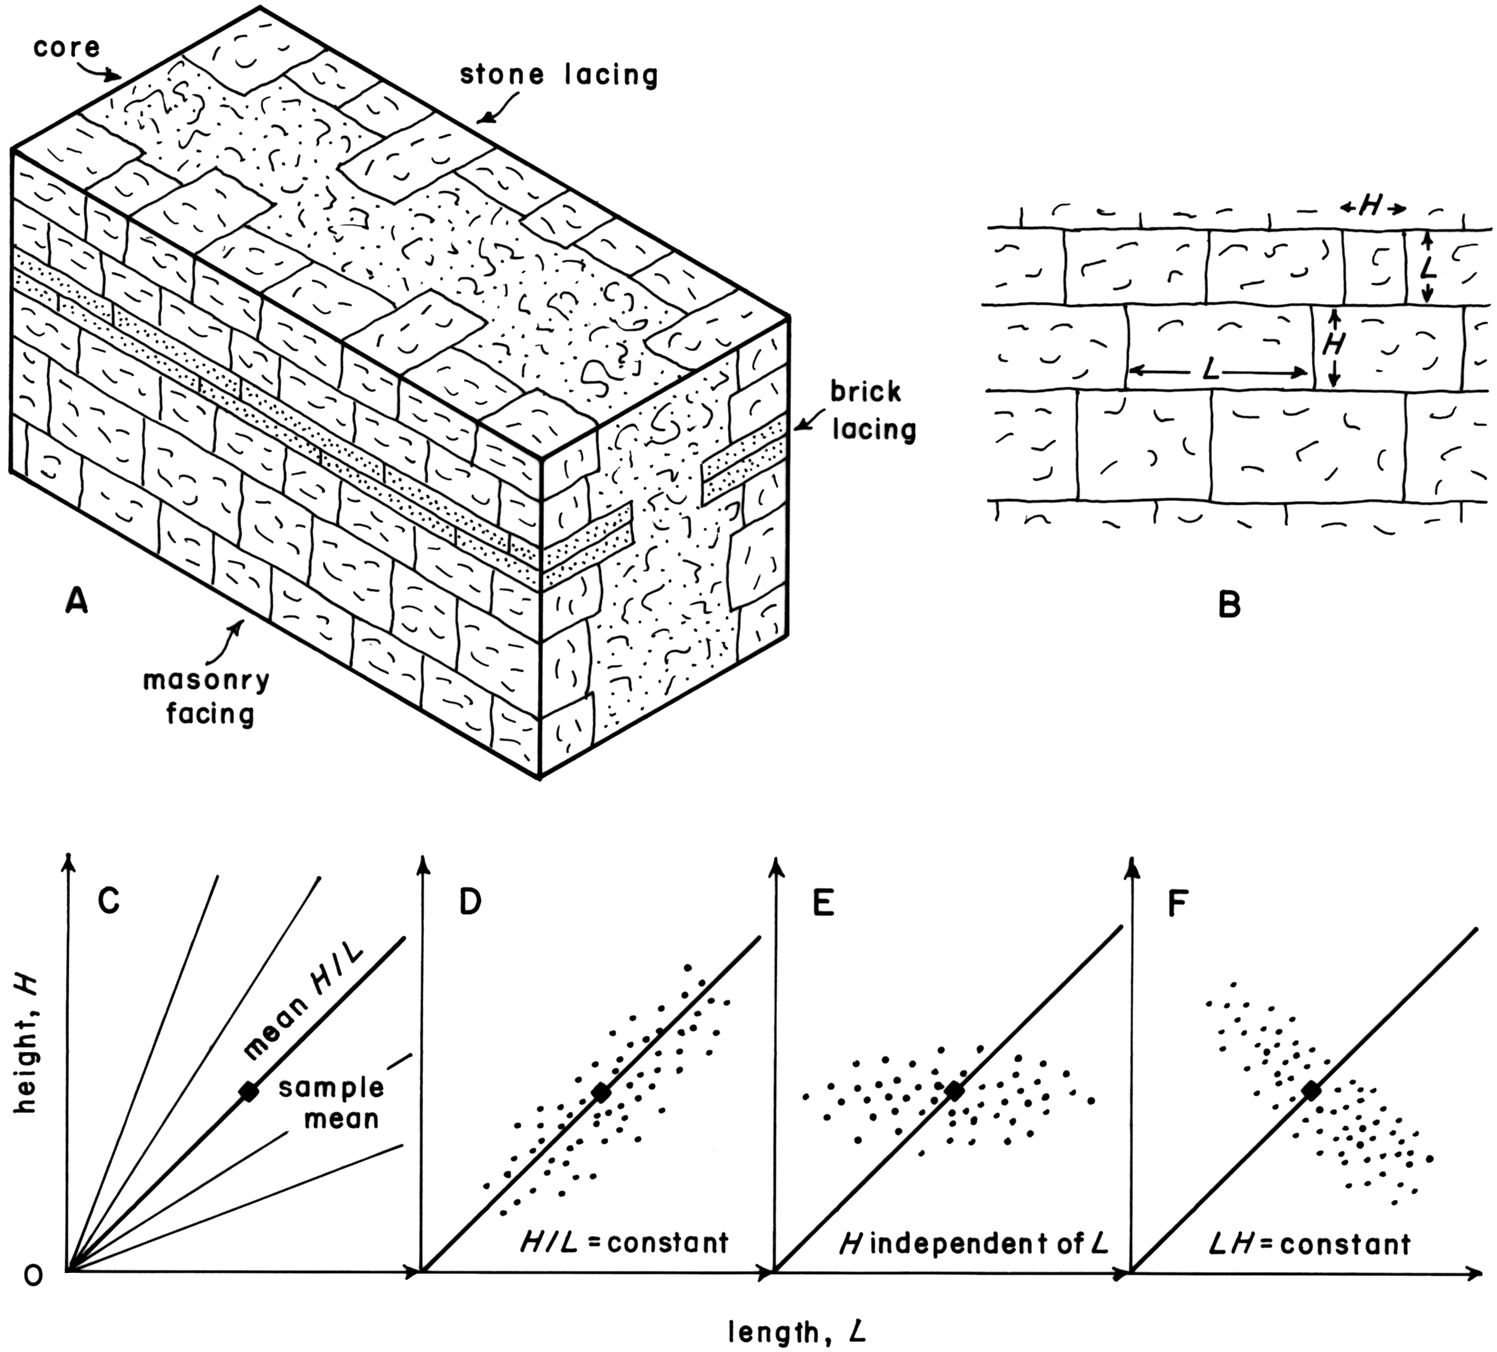
Where conservation measures are absent or have been only lightly applied, Roman masonry walls in Britain are seen to be mainly of the type in which facing-stones are laid in horizontal courses and laced into a rubble and mortar core by means of either long blocks arranged perpendicularly or string courses of thin stone slabs/brick/tileFootnote 4 (fig. 1A). As well as serving a structural purpose, the lacing material could be chosen to provide colour and/or textural contrast.
Roman facing masonry and its quantitative analysis. A: structure of a typical wall; B: exposed dimensions of building blocks; C: schematic variogram; D: schematic variogram for a sample of blocks compliant with the sample mean; E: schematic variogram for a sample of blocks in which H is independent of L; F: schematic variogram for a sample of blocks of LH≈constant.

What can be measured on such a facing, irrespective of whether there may have originally been a coating of paint, cement render or plaster intended for decoration or protection against weathering (fig. 1B)? Except at the broken edge of a wall, assessment is limited to two of the dimensions of blocks that in reality are three-dimensional, namely, the longest visible dimension (L) and the shortest visible dimension (H), normally the horizontal and vertical dimensions respectively (occasional blocks were set on edge). The depth (D) of blocks can be measured only at the broken edges of walls, which are by no means always accessible; data of this kind are generally too few to be useful in a metrical survey. The practical measurements, therefore, allow only statements to be made about the ‘apparent’ size and proportions of blocks. Such statements may nevertheless reveal trends in building practices in Roman Britain.
The lengths and heights of a random sample (n) of blocks exposed on the two-dimensional surface of a vertical wall constitute the basic data of a lithometric analysis. Two derived quantities follow, their averages describing the sample as a whole. The area (A=LH) of a block is a measure of (two-dimensional) size independent of proportion, while the form-ratio (F = L/H) is an index of (two-dimensional) proportion independent of size. Linking the four quantities are H = √(A/F ) and L = √AF.
Normally in a lithometric analysis the quantities introduced above are averaged. A mean value gains most significance when linked to a measure of the spread of the data, such as the range (sample small) or, better, the standard deviation from the mean (s, sample large). It is important to appreciate that the standard deviation as well as the range takes the same units as the mean. A powerful measure of the relative spread of a set of data that is independent of absolute values is given by the fractional ratio (CV, non-dimensional) of the standard deviation to the mean, known as the coefficient of variation.Footnote 5 The standard deviation is useful in another way. Its ratio with the sample size, ± σ/√n, is called the standard error of the mean (SEM) and has the same units as the mean. It is a statement at effectively 95% confidence of the range of values within which the true population mean estimated by the sample is expected to lie.Footnote 6 Knowledge of the standard error, together with that of other errors (see below), invites a necessary caution in the use of quantitative data and helps to avoid fanciful over-interpretation of a numerological sort.
It is helpful to visualize the overall character of a sample of blocks by constructing a simple variogram,Footnote 7 a graph of measured H values against L values (fig. 2). If desired, histograms can be plotted on these limbs of the graph, affording a useful visual test of the normal distribution of the dataset. By drawing rays that intersect the origin 0,0 of the plot (fig. 1C) constant values of H/L (i.e. 1/F) can be defined against which to compare the cloud of points. Individual blocks which plot on or near the same ray consequently all take similar values of the form-ratio, irrespective of their absolute dimensions. On one particular ray falls the sample mean. A sample clustering about this particular ray (fig. 1D) follows the rule L/H = constant and consists of blocks that have proportions close to the mean across the full range of absolute sizes. Consequently the coefficients of variation of H and L are both relatively high. In the second case (fig. 1E) the form-ratio varies widely, H is independent of L, and only the coefficient of variation for length is comparatively large; the blocks are all of a similar height, but vary widely in length. In the third case (fig. 1F), in which the form-ratio varies even more widely, both coefficients of variation are relatively large. The cloud of points now clusters about an arc of the rectangular hyperbola LH = constant, that is, the blocks are of roughly the same size irrespective of proportions. The plot is likely to appear curvilinear, however, only when block lengths and heights are sub-equal.
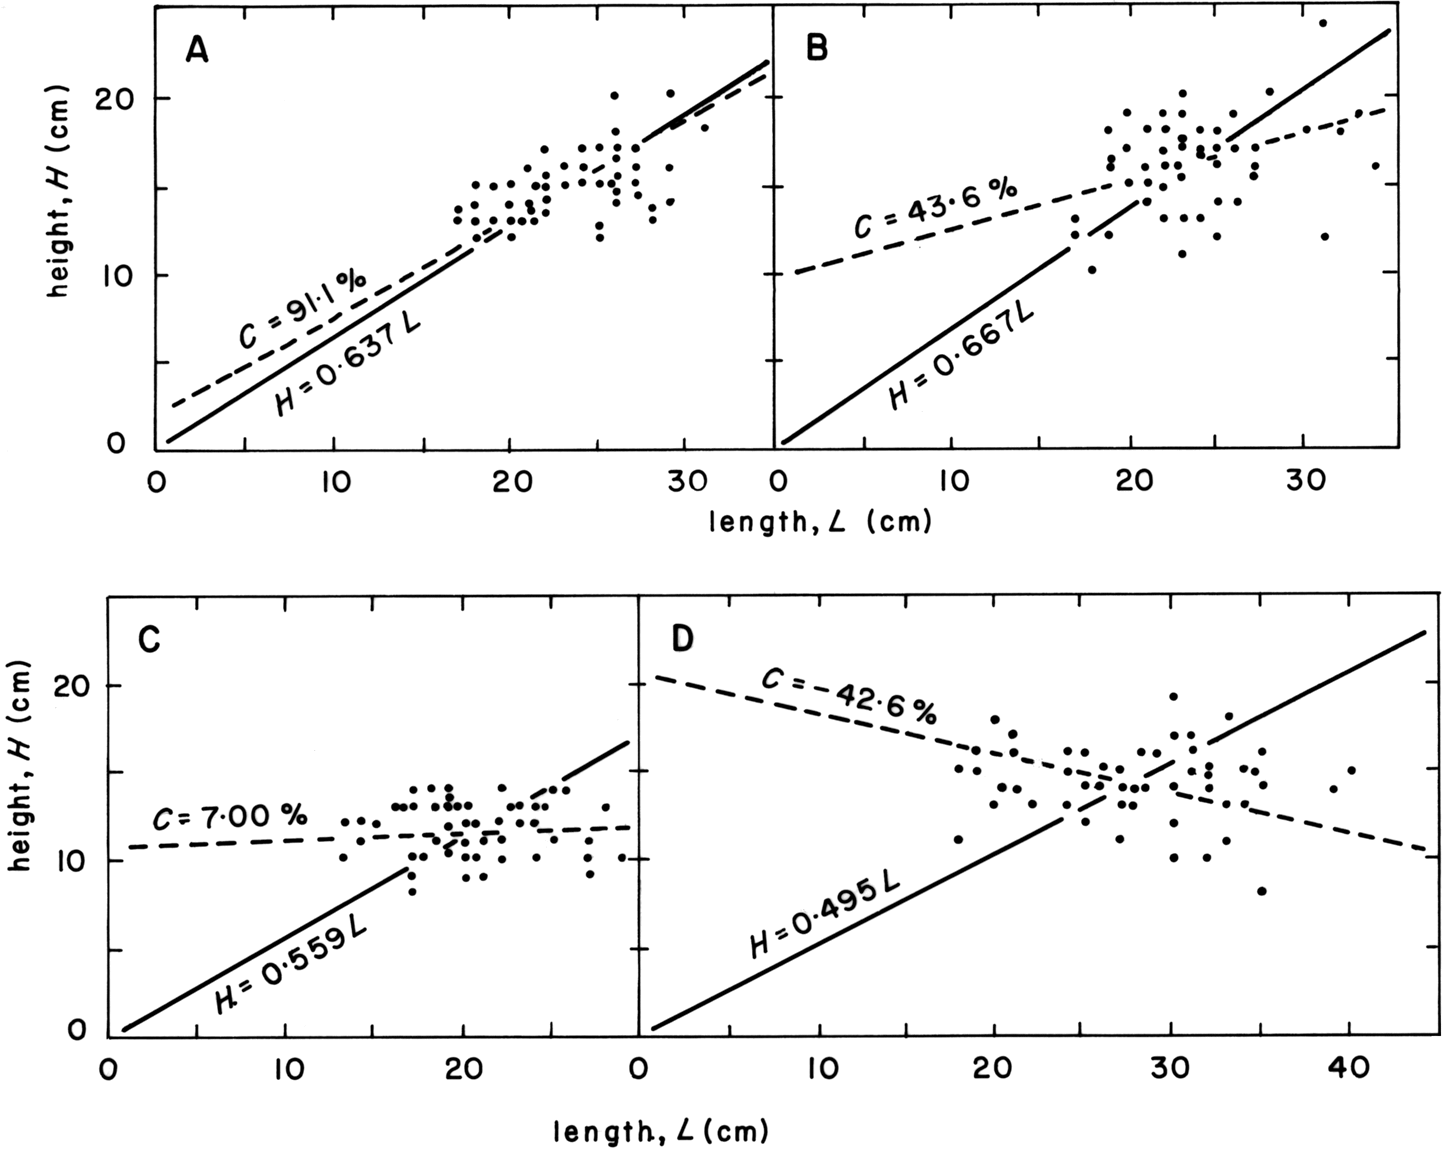
Representative variograms, illustrating especially the range in compliance. A: Rochester town wall; B: Housesteads fort; C: Roman baths, Bath (supplementary sample); D: Caerwent forum-basilica.

Variograms differing in these ways can be analysed quantitatively by comparing the slope of the best-fit line of the cloud of points to the mean value of H/L, that is, to the slope of the particular ray that contains this sample mean. This non-dimensional quantity, conveniently expressed as a percentage, may be described as the compliance (C) of the individual components of the sample to the sample mean in respect of the form-ratio. Theoretically, it ranges in value from -100% (fig. 1F) to +100% (fig. 1D) and is zero when H is independent of L (fig. 1E). A wide range of values for the compliance is covered in fig. 2 and the quantity has a definite physical meaning. Values approaching -100% imply that the quarry workers/builders sought blocks of constant weight. Near-zero values of the compliance, combined with small values of the coefficient of variation of height, typify facings composed of courses approximating to a single height. Values of the compliance close to 100% suggest a deliberate or subconscious intention to produce blocks of a constant proportion.
In summary, lithometric analysis is a means of arriving at a quantitative characterization of the sizes and proportions of the stone blocks that compose the facing of a wall, in contrast to the subjective, qualitative statement that would otherwise be available (e.g. small, large, squarish, elongated). The analysis examines the heights and lengths of blocks (L, H), the relative variability of these dimensions (coefficient of variation, e.g. σH/mean H), block size (area, LH) and proportion (form-ratio, L/H) and their relative variability, the precision of the sample with respect to the population of blocks (standard error of the mean, SEM) and the form of the overall trend of H on L (compliance, C). A knowledge of these quantities and of the stone used could reveal trends in building practices over the three-and-half centuries of the Roman occupation of Britain.
SITES AND SAMPLING
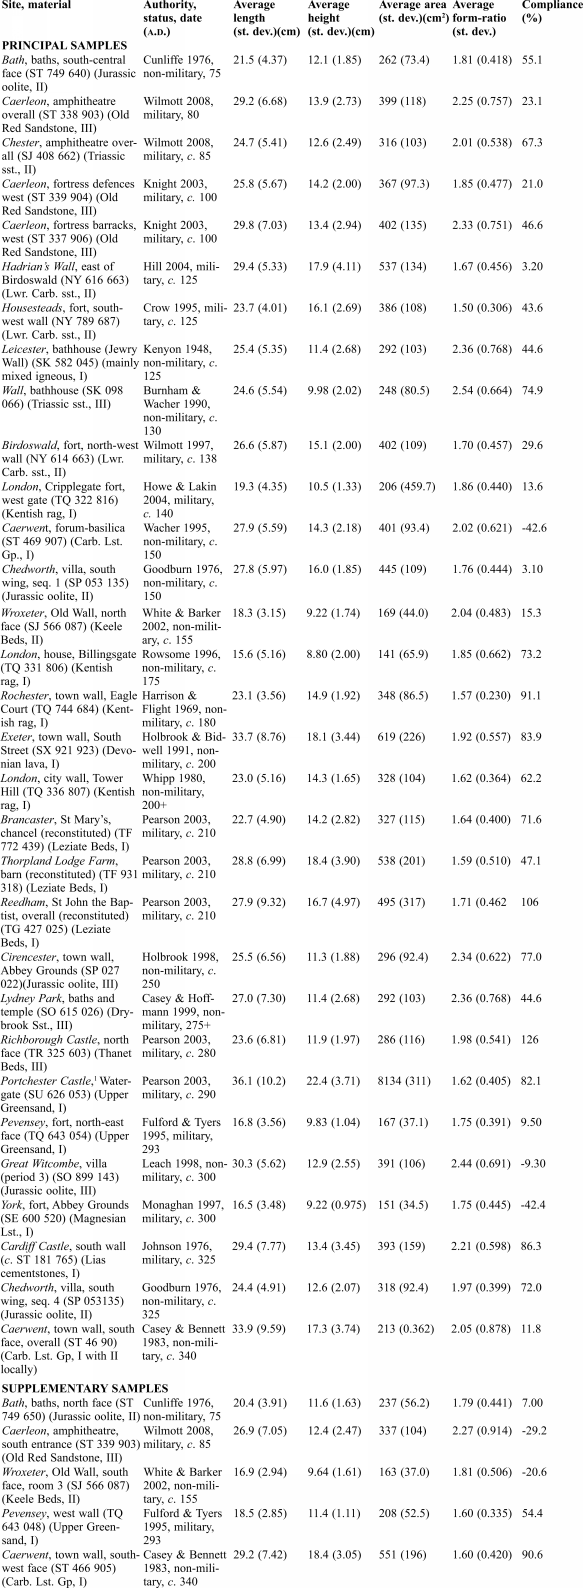
Samples were drawn from Roman monuments and buildings at 31 sites (Table 1), ranging geographically from Exeter and Caerleon in the west to Richborough in the east and Hadrian's Wall in the north. Bias toward any particular part of the period was avoided as far as possible.
SUMMARY OF SAMPLING SITES AND LITHOMETRICRESULTS

1 restricted sample (n=26)
Sixteen of the sites — fortifications, barracks and amphitheatres — are classed as military, including three reconstituted instances where stone robbed from a Roman known or arguably military building was incorporated to a substantial extent into a medieval or modern structure.Footnote 8 The stone in these three cases had a common geological source, since it is identical in all significant petrological and mineralogical respects. That found at St Mary’s, Brancaster, and Thorpland Lodge Farm, Fakenham, was robbed from the fort at Brancaster. The stone re-used at St John the Baptist, Reedham, and in seven other nearby parish churches in east Norfolk, came from a so-far-unknown but clearly substantial local Roman structure, considered, on the basis of the provenance of the stone used, to be of the same date as Brancaster. The evidence for a Roman building as the source for the material re-used at Brancaster, Fakenham and Reedham includes the survival on occasional blocks of opus signinum and the presence on others of simple mouldings. The use of the term ‘military’ to encompass this group of 16 buildings does not exclude the possibility that civilian labour was in some instances used to supplement legionary efforts.
The remaining 15 sites — town walls, public buildings, houses — are classed as ‘non-military’. This terminology again does not preclude the possibility that military technical guidance and expertise may have been called upon in the construction of some of the larger civic projects.
A precise date is known for only one Roman building, Pevensey Castle,Footnote 9 the remainder being placed by their investigators within a date-range, generally of a few decades, on the basis of epigraphic, coin or pottery evidence or by comparison with similar structures. It is only because of the requirements of quantitative analysis that these buildings and monuments have assigned to them in the table a single, nominal construction date.
The selected structures vary hugely in the extent to which they have survived. After assessing a structure, the masonry was randomly sampled by measuring exposed blocks to a standard total of n = 50 on a predetermined series of vertical transects spaced at roughly equal intervals along the selected portion of the wall. A laterally restricted part of the wall was selected at most sites (‘local’ sample), but in a few cases sampling was conducted over the extent of the whole or a major part of the exposed structure (‘overall’ sample). Given that in most cases the blocks are to some degree irregular, and that conservation work had been carried out, it was not considered possible in the field to measure their dimensions to any closer than the nearest centimetre. As a block is typically c. 25 cm long and c. 14 cm high, measurement errors of c. ±2% in length and c. ±4% in height are implied.
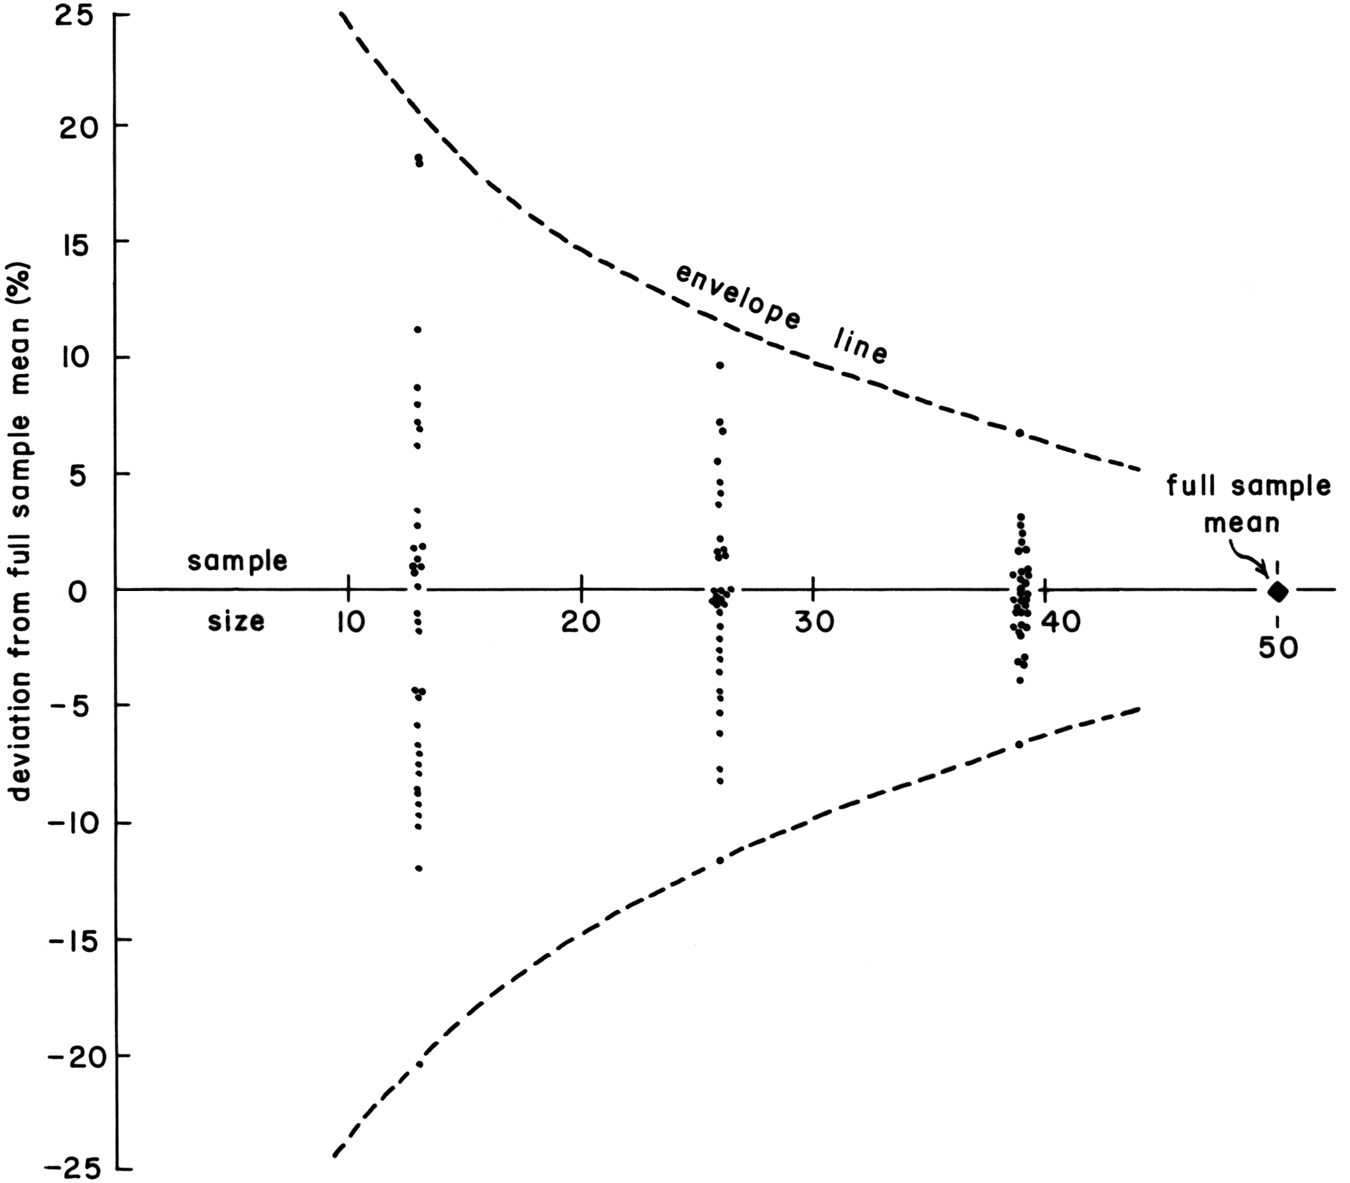
The choice of n = 50 blocks for the standard sample is a compromise between practicality and the desire for high precision, and is associated with another source of error. Take, for example, the form-ratio. Excepting the restricted sample from Portchester Watergate, fig. 3 shows for all the tabled sites the percentage deviation from the sample mean at n = 50 of the form-ratio averaged over the first 13, the first 26, and the first 39 measured blocks. One would expect the percentage deviation in general to decline as these subsamples increased in size. As can be seen, the plot and its envelope lines converge rapidly on a deviation of c. ±4% at n = 50, of the same order as the basic measurement errors. The other quantities discussed yield similar results.
Graph showing the decline in the deviation of the form-ratio (L/H) from the mean at n = 50 with increasing sub-sample size (n = 13, 26, 39). All samples except Portchester Watergate.

These considerations put the total error in the calculation of the means of the two basic measurements and the two derived quantities at c. ±5–10%. As the standard error of the mean is c. ±5% for each parameter, it is suggested that their population means cannot be estimated at any closer than c. ±10%.
Given the widespread indications that at least the larger Roman structures were erected by a number of work-gangs operating over a period of time and with a changeable supply of raw material,Footnote 10 to what extent would similar quantitative results have been obtained if multiple samples had been drawn from a building? How uniform is the masonry in a substantial Roman structure? The supplementary samples listed in Table 1 represent sites that were sampled twice, allowing a comparison to be made with the principal samples. At three sites — Roman Bath, Wroxeter, and Pevensey Castle — the samples are all local and from differently located but otherwise similar extents of wall. The paired samples differ by no more than c. ±5% at Bath and Wroxeter, well within the range of error just estimated. Agreement is less satisfactory at Pevensey Castle, however, where the Upper Greensand masonry clearly differs between the two sampled stretches of wall,Footnote 11 probably because they were built by different work-gangs or at different times. The difference in the mean length and form-ratio is similar to that at Bath and Wroxeter, but the mean height and mean area diverge by ±7.4% and ±10.9% respectively, and the values for the compliance are substantially different. A local and an overall sample are paired at the Caerleon amphitheatre and the town wall at Caerwent. The differences are c. ±5% at Caerleon, except for block area, which diverges by ±8.4%. At Caerwent, the differences are c. ±3% for height and area, but much greater for length and form-ratio, at ±7.4% and ±12.3% respectively. The values for the compliance are markedly different. This town wall is another monument built in sections, to judge from the frequent changes in the direction of shingling of limestone slabs exposed in the wall-core at many places.
To summarize, the sites selected for analysis cover without bias almost the whole of the Roman period and can be grouped into military and non-military. At each site a standardized number of randomly selected blocks was measured, the estimates of population length, height, area and proportion being subject to both measurement and sampling errors. It is unlikely that population values have been estimated to closer than c. ±10%.
GEOLOGICAL CONSIDERATIONS
Writing from Italian experience in the first century b.c., long before the buildings under present consideration were erected, the Roman architect and engineer Marcus Vitruvius Pollio in Book 2 of his De architectura Footnote 12 was in no doubt as to the qualities desirable in a building stone: availability and proximity to the building site; fitness for purpose, including ease of working; and, mainly required of a decorative stone, of a pleasing appearance. Whether or not they had Vitruvius’ advice in mind, or were steeped in a Vitruvian tradition, the earliest Roman occupiers of Britain had limited opportunity to assess the potential of the country with regard to natural building materials (there was no native tradition of building in stone). They are, therefore, likely to have made choices out of necessity rather than local experience or on the advice of specialist prospectors. With time, however, more considered decisions are likely to have been made, although unexpected circumstances could again have brought necessity to the fore. In Roman Britain sedimentary rocks were chiefly exploited. Fitness for purpose, ready availability and proximity are likely to have been the main criteria of choice, but a pleasing appearance cannot altogether be ruled out for walling that was not intended to have been whitewashed, plastered or rendered.
Sedimentary rocks represent debris, of organic origin in the case of many limestones, laid down by currents of water or wind as layers of particles with pore spaces between, typically about 30 per cent of the whole in the case of sands. Following burial in the Earth’s crust, and in some cases very shortly after deposition, mineral cements become introduced to varying degrees into the pores, converting the loose, unconsolidated sediment into rock, a much stronger material. The commonest of these post-depositional cements are quartz, calcite and coatings of coloured iron compounds.
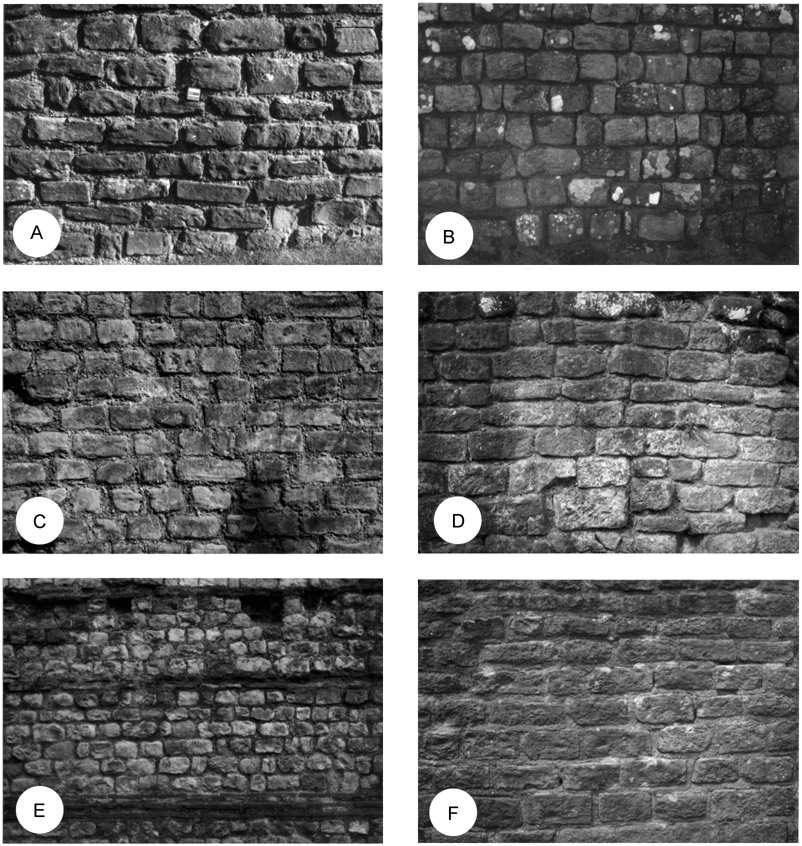
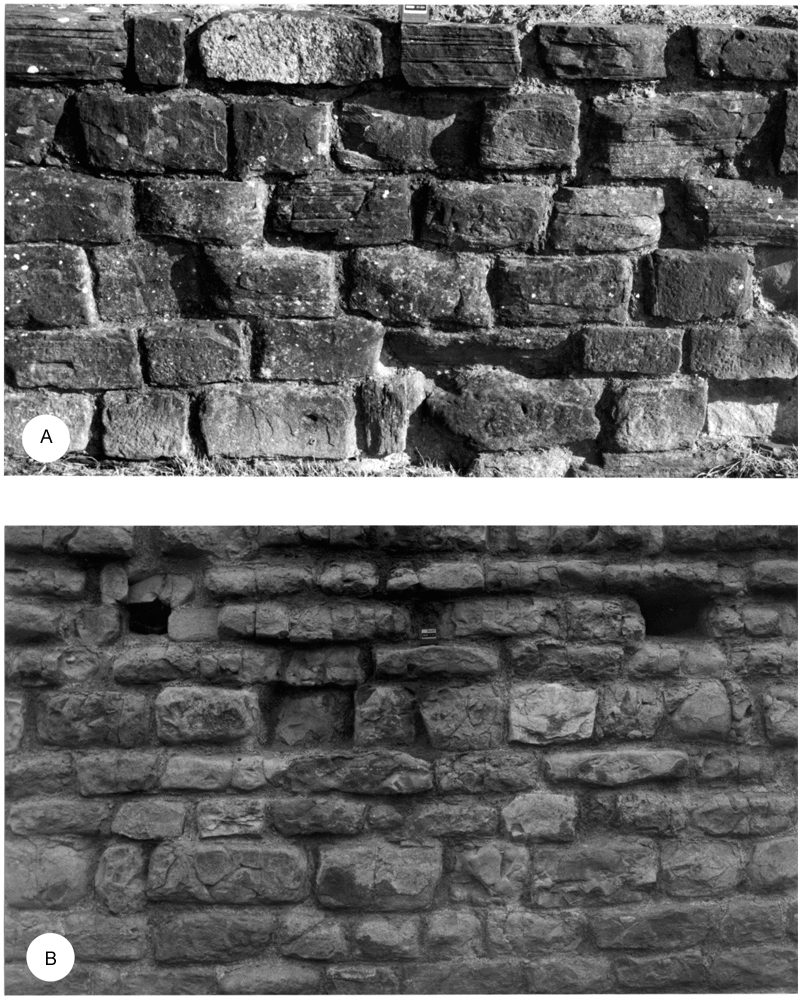
The military complex at Caerleon (fig. 4A) is built almost exclusively of dark red, laminated, richly micaceous, calcareous, fine- to medium-grained sandstones from the St Maughan’s Group,Footnote 13 of Siluro-Devonian age, outcropping c. 1 km to the north-west of the fortress. The laminae occur on a millimetre scale and mica flakes strew their surfaces, giving the rock a marked fissility. Blocks from the same formation of a calcite-cemented conglomerate of siltstone and limestone pebbles occur here and there in the Roman structures.
Representative facing masonry (see also Table 1). A: Caerleon amphitheatre, south entrance; B: Housesteads fort; C: York fort; D: Chester amphitheatre; E: London city wall, Tower Hill; F: Great Witcombe villa.

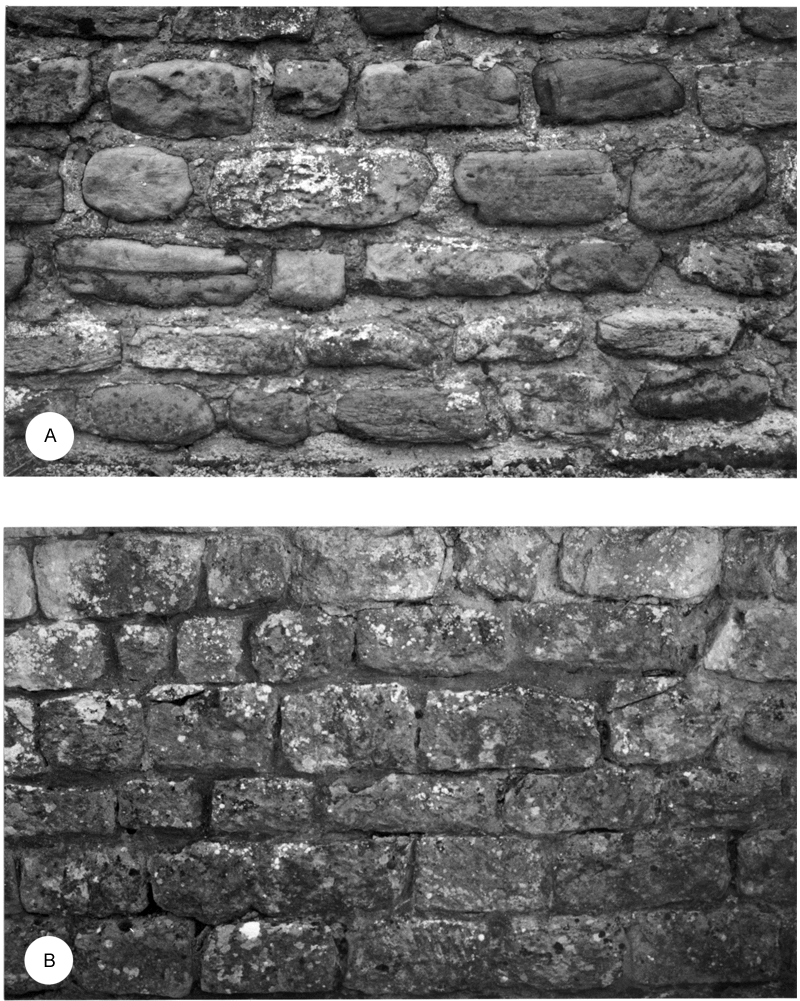
Sandstones of Carboniferous age feature at several widely scattered sites. The bath-house and temple at Lydney Park are built of red, poorly laminated, lightly cemented, quartzose sandstones from the local Lower Carboniferous Drybrook Sandstone.Footnote 14 Sandstones of this general age but of a different character were taken from local quarries to build the forts at Birdoswald and Housesteads (fig. 4B) on Hadrian’s Wall, in preference to the otherwise available igneous Whin Sill.Footnote 15 The rocks are pale-coloured, laminated but compact, strongly cemented, medium- to coarse-grained, quartzose sandstones. Rocks from the Upper Carboniferous Keele BedsFootnote 16 — dark red, laminated, medium- to coarse-grained, quartzose sandstones — were exploited at Wroxeter.Footnote 17 The nearest outcrop is c. 7 km distant. In contrast to the use of sandstones, the masonry at Caerwent (fig. 5A) is of compact, strongly cemented, mainly massive limestones and some dolomites from the Carboniferous Limestone Group cropping out within 1 km or less to the north and south.Footnote 18 Any laminae picked out by the weathering of the facing blocks are firmly welded together, and the rocks are non-fissile.
Representative facing masonry (see also Table 1). A: Caerwent town wall, south-west face; B: Cardiff Castle, south face.

Permo-Triassic beds were exploited for facings at Midland and north-eastern sites. BucklandFootnote 19 identified the Lower Magnesian Limestone of Permian ageFootnote 20 as the source of the compact, pale-coloured, strongly cemented, porcellaneous to granular, dolomitic limestones used for the fort at York (fig. 4C). The material cannot have come from closer than the much-quarried Tadcaster area c. 15 km to the south-west. The amphitheatre at Chester (fig. 4D) was built using strongly cemented, laminated to massive, medium- to coarse-grained sandstones from local quarries in the Lower Triassic Lower Mottled Sandstone.Footnote 21 At Wall (fig. 6A) a local source in the red, less well-cemented, fine- to coarse-grained Upper Triassic Keuper Sandstone was exploited.Footnote 22
Representative facing masonry (see also Table 1). A: Wall; B: Chedworth villa, sequence 1.

The Roman fort at Cardiff (fig. 5B) is unique among the sampled buildings in being constructed of cementstones — massive, fine-grained, clay-rich limestones — from the Lower Lias of early Jurassic age. Given the rounded edges and corners frequently seen on the blocks, these are perhaps more likely to have been taken from the beaches and coastal cliffs at Penarth and Lavernock, c. 7 km and c. 10 km respectively to the south, rather than Ward’sFootnote 23 preferred source of Leckwith Hill, c. 3.5 km to the south-west. These cementstones occur thinly interbedded with about equally abundant soft shales.Footnote 24 Transport is most likely to have been by water along the coast and up the Taff estuary.
Local rocks of Middle Jurassic age were exploited in South-West England at Great Witcombe,Footnote 25 Bath,Footnote 26 Chedworth,Footnote 27 and Cirencester.Footnote 28 Well-laminated shelly oolites were used at Great Witcombe (fig. 4F), apparently from the nearby Inferior Oolite Group. The freestone (Bathstone) from the Great Oolite Group used for the Roman baths at Bath is a compact, strongly cemented, medium- to coarse-grained, slightly shelly, oolitic limestone displaying occasional laminations. The coarse-grained but otherwise similar Taynton Stone from the Group appears to have been exploited at Chedworth villa (fig. 6B). The Cirencester wall consists of well-laminated, slightly shelly, fine-grained, pelloidal-oolitic limestones, probably from the local Kemble Beds in the uppermost Great Oolite Group.
Sandstones of Lower Cretaceous age were popular as facings with Roman builders at many locations in South-East England. Kentish rag from the Hythe Beds of the Maidstone areaFootnote 29 is seen at Rochester and the London sites (fig. 4E). The rock is a thinly bedded, off-white, compact, massive and unlaminated, slightly glauconitic, quartzose, bioclastic limestone. Rochester lies c. 15 km downriver from the outcrop of the Hythe Beds that crosses the Medway, but the distance to London by water amounts to c. 75 km or more. That this journey was frequently undertaken is demonstrated by the very many ragstone buildings in Roman London and by the Blackfriars boat of the mid-second century with its preserved cargo of the stone.Footnote 30 Long carriages by water also typify the use of quartzose sandstones from the Leziate Beds of west Norfolk.Footnote 31 This rock is an off-white, massive, lightly cemented, sugary-textured, fine- to medium-grained, quartzitic quartz sandstone of great purity, in modern times prized for glass-making. Lamination is very rare. Moderately weathered blocks commonly display instead a mottled texture indicative of the thorough bioturbation of the sediment, that is, the destruction of any original stratification due to deposition by the action of contemporaneous burrowing organisms. These quartzitic sandstones are restricted to the vicinity of the village of Castle Rising to the north-east of King’s Lynn, where the Babingley River is likely to have been tidal in Roman times. The distance from the village by water through The Wash to Brancaster on the north coast is c. 35 km and c. 130 km to the ‘lost’ Roman building at Reedham on the Yare estuary in east Norfolk. At the fort at Pevensey on the English Channel coast, massive, thoroughly bioturbated, calcareous, fine- to medium-grained, glauconitic quartz sandstones from the Upper GreensandFootnote 32 contribute significantly to the fabric. PearsonFootnote 33 suggests that these pale green rocks were procured in the Eastbourne area several kilometres to the south-west.Footnote 34 A massive, iron-cemented facies of the Upper Greensand appears at Portchester Watergate. The source is thought to be the Upper Greensand outcropFootnote 35 c. 25 km away by water at the eastern tip of the Isle of Wight.Footnote 36
The fort at Richborough is the only structure to include rocks of Tertiary age.Footnote 37 The Palaeocene Thanet BedsFootnote 38 are well-represented in the north wall by blocks of pale grey to pale brown, finely laminated, very fine-grained, weakly calcareous sandstones with occasional seams of bivalve mollusc shells. This material was probably collected as doggers (large, discoidal concretions) from Pegwell Bay, a few kilometres by water from the fort, or from Reculver Bay, then c. 15 km distant on the north Kent coast.
Igneous rocks were exploited at only two sites. The town wall at Exeter is built of well-dressed blocks of purple, vesicular, basaltic lava of the type outcropping close at hand at Rougemont in the city.Footnote 39 At Leicester, the bath-house (Jewry Wall) is faced chiefly with a mixture of intrusive granodiorites, syenites and diorites from Charnwood Forest and Mountsorell.Footnote 40 The sources of these rocks lie at a distant 10–12 km from the city.
What attracted Roman builders to these formations? Vitruvius’ ‘proximity to the building site’ provides the answer in only about half the listed cases. The chosen stones were clearly seen to possess a certain strength, but given that load-spreading mortar was invariably spread between blocks, it need not have been great; the stone from the Leziate Beds, for example, procured for Brancaster and Reedham, is almost sandrock, and the Upper Greensand at Pevensey is also weak. Other considerations could have swayed the choice. Setting aside the occasional use of igneous rocks, an upper limit on the size of masonry blocks that can be produced from a sedimentary deposit is set by the three-dimensional, statistical geometry of the major bedding surfaces and bedding-perpendicular joints that are present. Bathstone (Roman Bath), for example, comes in thick beds with widely spaced joints, whereas the Lower Lias cementstones (Cardiff) and Kentish rag (London, Rochester) occur in much thinner beds with joints roughly to scale. The dependence of joint spacing on bed thickness is well known.Footnote 41 Broadly, spacing increases linearly with thickness, measured ratios falling between 0.1 and 10 or more, with a central tendency of broadly 0.5–3. A ratio of 1.0 is critical, for this marks a change in the stress-regime under which jointing occurred when the rock was buried in the Earth’s crust.
The way a stone can be worked by quarrymen and masons is affected not only by the scale of the joints and bedding, but also by the presence within the masses thus defined of subordinate stratification and especially by laminae and the extent to which post-depositional cements weld these together. Laminae express slight fluctuations in depositional conditions: they differ in terms of some or all of such properties as composition, grain size and grain orientation. Some rocks are now found to be massive and unlaminated — the Hythe Beds (London, Rochester), Leziate Beds (Brancaster, Reedham), and Upper Greensand (Pevensey) are examples — because of intense bioturbation during deposition or decementation after burial and lithification. Such materials are equally strong parallel and perpendicular to the bedding — they may therefore be described as isotropic — and in many cases can be worked as freestones as well as used for general purposes. Almost isotropic, but commonly with some slight fissility, are well-laminated rocks with firmly welded laminae, such as Bathstone and the Lower Carboniferous sandstones of the Roman North. These are also recognised as freestones. The case of Bathstone is familiar from buildings of all ages; the use of the Lower Carboniferous sandstones as freestones is less familiar, but is attested by the carved and moulded stonework to be found in hotels and churches in the neighbourhood of Hadrian’s Wall. However, the bond is much less firm in many other laminated deposits, for example, the St Maughan’s Group (Caerleon), the Drybrook Sandstone (Lydney), the Inferior Oolite (Great Witcombe), and the Thanet Beds (Richborough). These materials are, therefore, significantly weaker parallel to the bedding than perpendicular to it, tending to split into masses that are comparatively long compared with their thickness. In terms of strength these rocks are anisotropic.
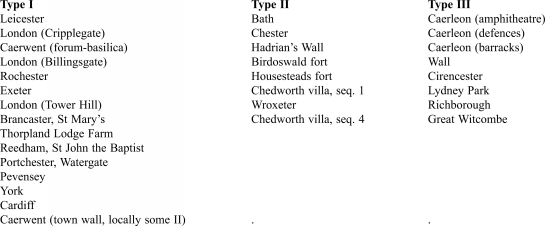
The materials surveyed may, therefore, be divided between three classes in terms of these characteristics (Table 2). Stone of Type I (isotropic) is massive and essentially unlaminated. Type-II stone, almost isotropic, displays laminae, but a strongly developed, post-depositional cement firmly welds these together and greatly reduces fissility. Laminae also typify stone of Type III (anisotropic), but are not as strongly bonded by cement. These rocks display marked fissility.
CLASSIFICATION OF SITES BY THE TYPE OF STONE

HANDLING STONE
What do the lithometric data (Table 1) reveal about the way in which these lithologies were handled at the quarry and/or building site to produce masonry? Given the comparatively modest number of principal samples, ordinations of the parameters seem preferable to histograms as a means of assessment. In an ordination each more gently sloping sequence of points indicates a local concentration of values and equates to a mode, whereas each more steeply sloping portion denotes a zone of low frequency, normally the trough between modes.
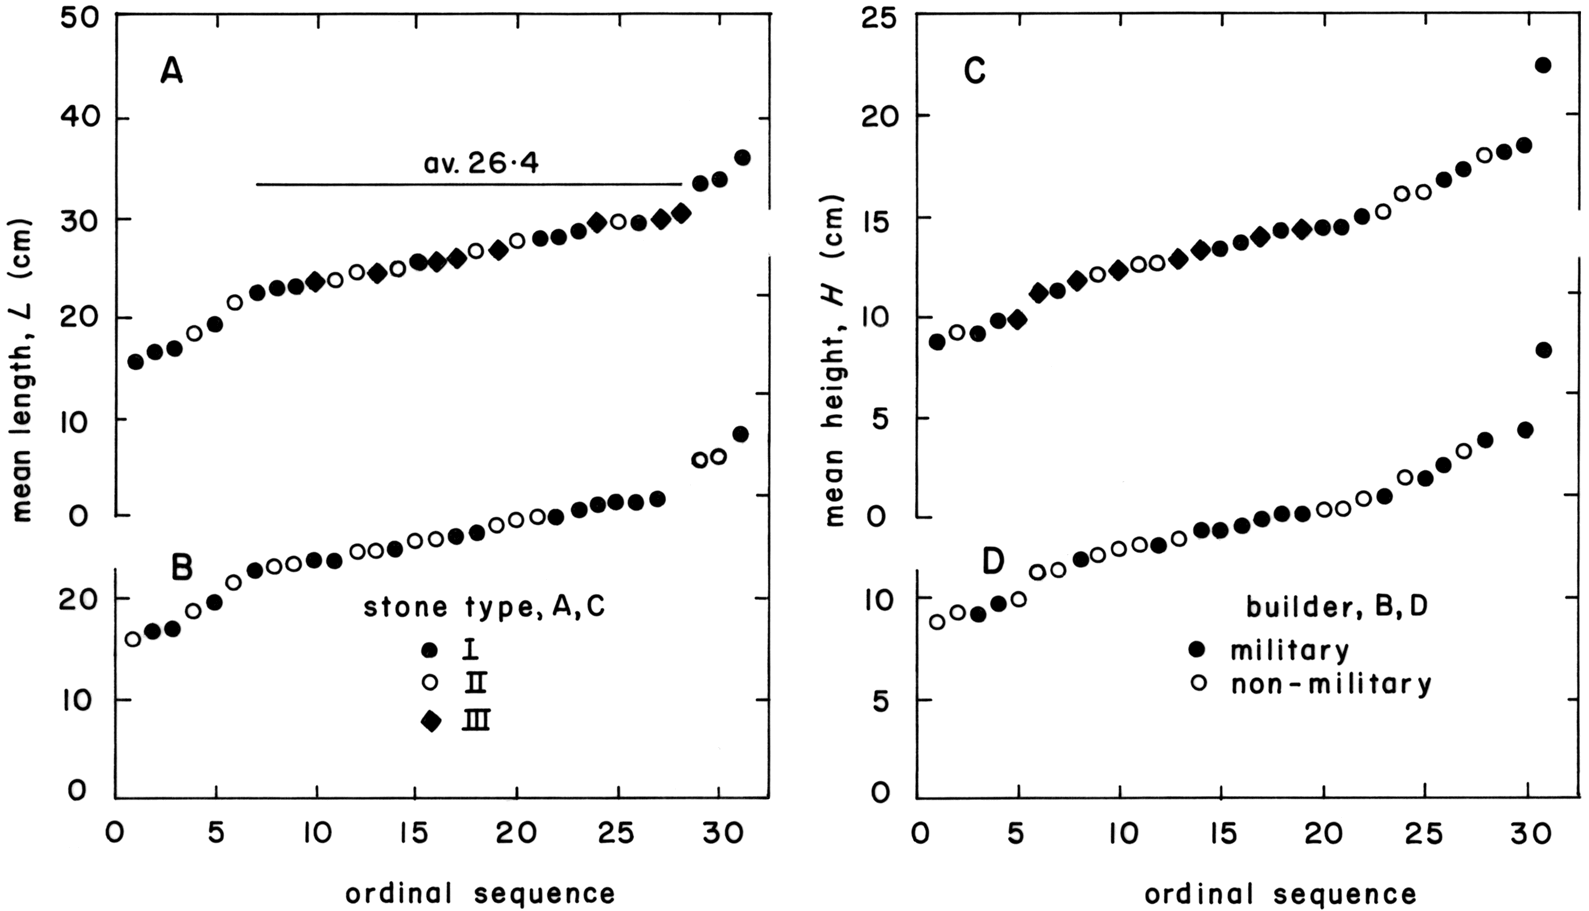
The ordination of mean length (fig. 7A, B) points to a strong preference for a single block length of between about three-quarters (Brancaster, St Mary’s) and one (Great Witcombe) Roman foot (29.6 cm). Type-III lithologies are confined to this concentration but Type-I rocks appear over the whole span of the ordination. Type-II is lacking at the lower and upper ends of the spread. Neither military nor non-military builders seem to have had any particular preferences regarding length.
Ordinations of sample mean block length and mean height qualified by stone type (A, C) and builder (B, D). Principal samples only.

A broadly similar ordination is obtained for mean height (fig. 7C, D). Roughly half the sites fall in a central concentration of blocks between about one-third (Wall) and one-half (London, city wall) of a Roman foot in height. The Upper Greensand masonry at Portchester Watergate, however, stands out as significantly taller than all the others. All but one of the Type-III rocks lies within the central mode as in the cases of length; Types I and II appear uniformly spread. There is a slight concentration of military builders within the central cluster of height values.
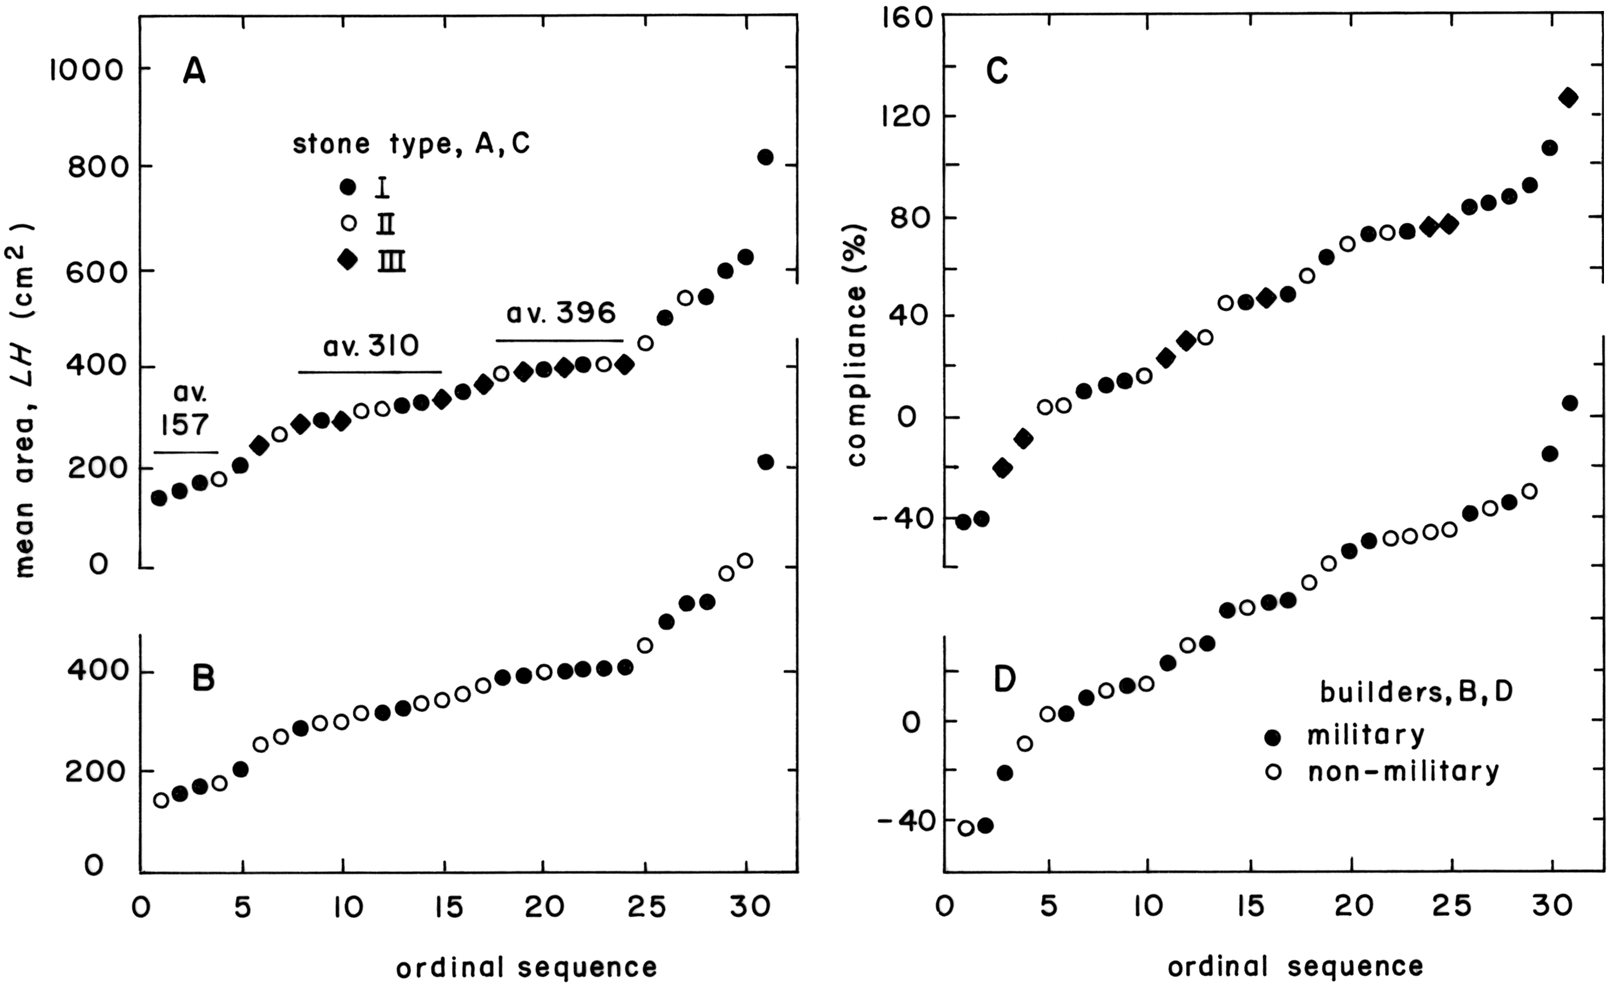
The ordination for mean area, measuring size independently of proportion, gives evidence for at least two modes (fig. 8A, B). The best defined of these lies between 386 (Housesteads) and 462 cm2 (Caerleon barracks), the other falling between 286 (Richborough) and 335 cm2 (Lydney Park). There is a hint of a third, at the lower end of the ordination (≤169 cm2). Type-I lithologies range over the whole ordination, whereas Type-III rocks are, as before, restricted to the middle ranges. Military builders are widely represented, but with only a slight preference for the larger concentration of area values.
Ordinations of sample mean block area and compliance qualified by stone type (A, C) and builder (B, D). Principal samples only.

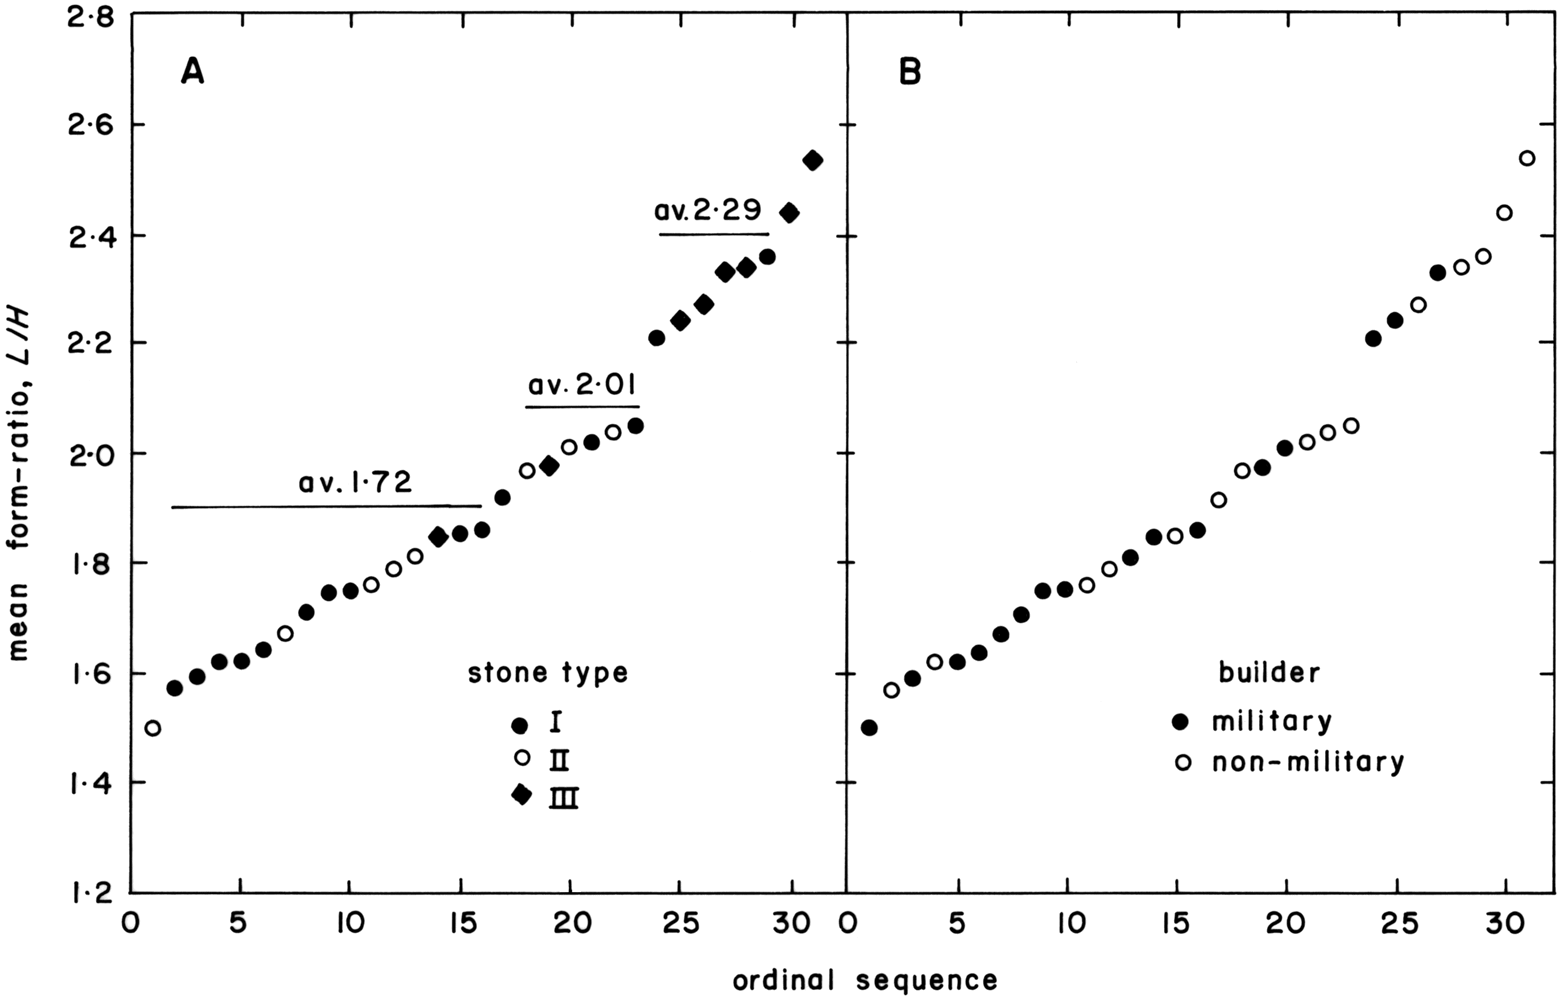
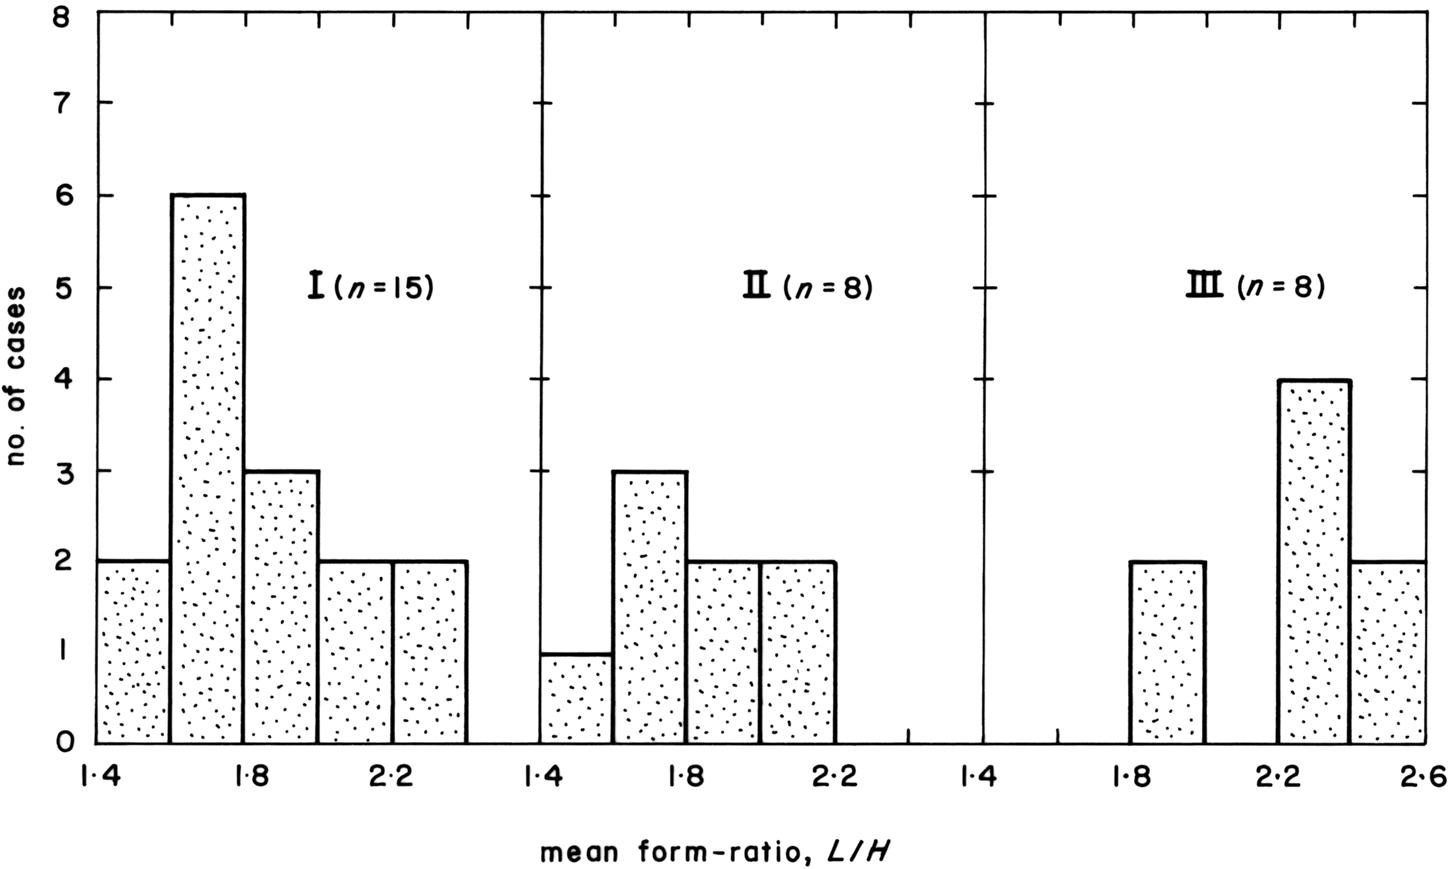
The most interesting ordination is provided by the mean form-ratio, measuring the proportions of masonry blocks independently of their size (fig. 9A, B). Three clusters of values appear to be present, separated by short, steep sections. The lowest mode ranges from 1.57 (Rochester) to 1.86 (London, fort) and averages 1.72 (figs. 4C, E; 5A). Averaging 2.01, the intermediate cluster (fig. 4D) extends from 1.97 (Chedworth, seq. 4) to 2.05 (Caerwent, town wall). The six sites that form the highest mode average 2.29 in value and vary from 2.21 (Cardiff) to 2.36 (Leicester) (figs. 4A, 5B). fig. 10 shows how values of the mean form-ratio are distributed between the three lithological types. All but two Type-III rocks fall in the highest mode or take larger values still (fig. 4F); only one site with this type of lithology occurs in each of the other clusters (fig. 9A). Correspondingly, masonry of Types I and II is found chiefly in the lower and intermediate ranges of the ordination. The military builders have a marked preference for these same ranges (fig. 9B).
Ordinations of sample mean form-ratio. A: stone type; B: builder.

Frequency distributions of sample mean form-ratios by stone type. Principal samples only.

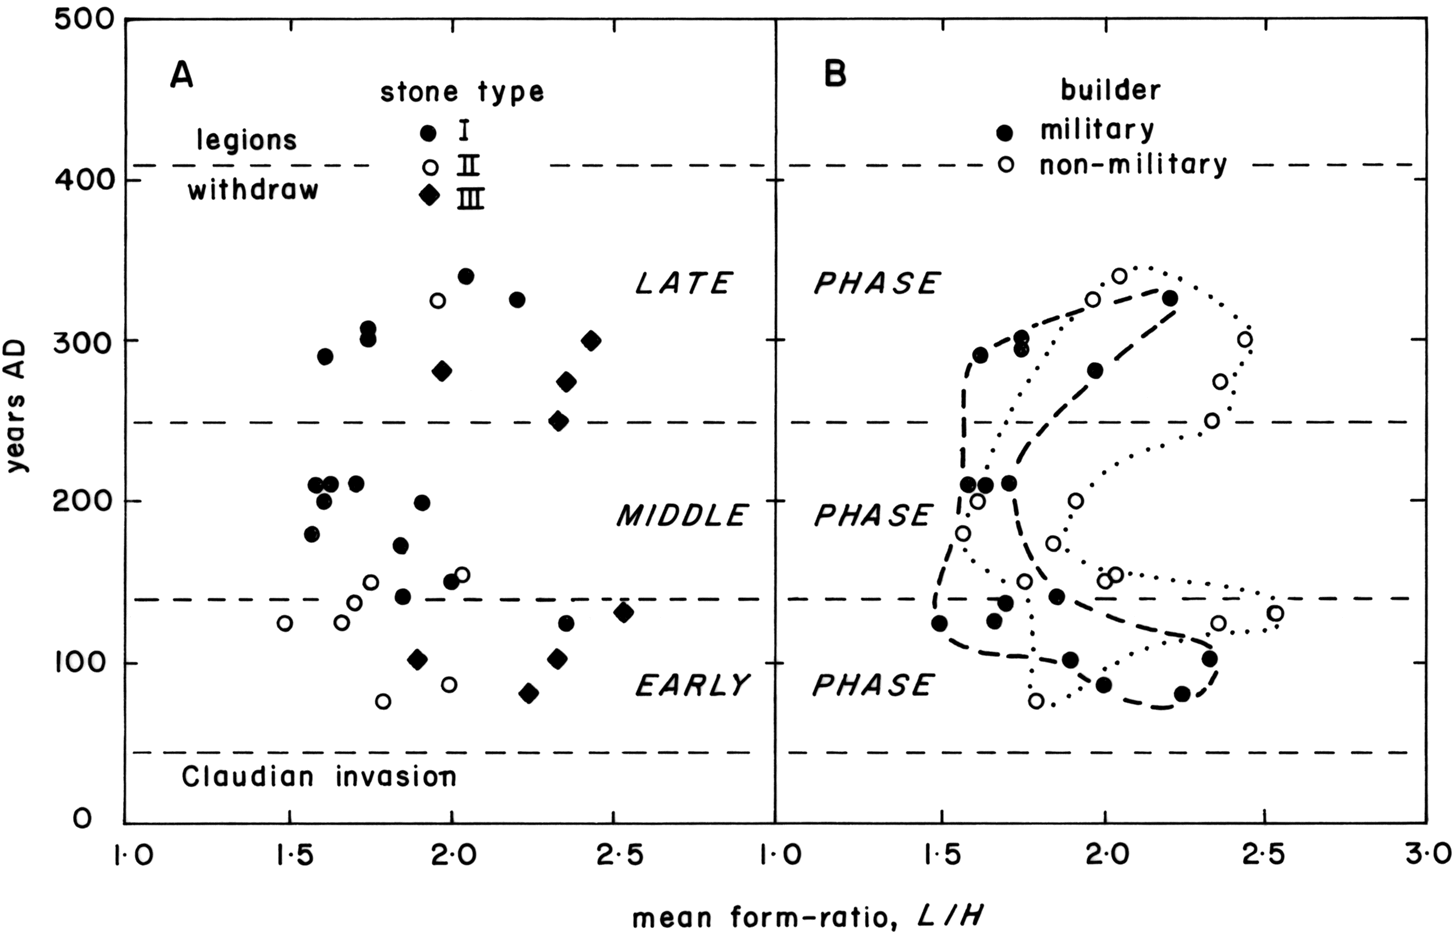
The principal sampled sites represent a period of c. 275 years, from the late first to the mid-fourth centuries a.d. (Table 1). There are indications that over this span there were changes in the selection and handling of stone. Type-I lithologies, recorded from the mid-second century, appear until the end of the period (fig. 11A). Stone of Type II is listed chiefly in the late first and early second centuries, with a single reappearance in the early fourth. Type-III rocks are recorded in the late first and early second centuries and again in the late third century. Military builders, using stone chiefly of Types I and II, are represented throughout the period but appear mainly in the later first and early second centuries (fig. 11B). The average mean form-ratio for their masonry is 1.84; that for non-military builders is 2.04, reflecting a greater preference for Type-III stone.
Variation of sample mean form-ratio over time. A: stone type; B: builder. Principal samples only.

Three phases can, therefore, be suggested in the choice of masonry proportions. In the early phase, up to c. a.d. 140, the mean form-ratio takes a wide range of values, from 1.50 (Housesteads) to 2.33 (Caerleon, barracks) (figs. 4A, B, D; 6A). The middle phase, between c. a.d. 140 and c. a.d. 250, is typified by low values of the form-ratio, between 1.62 in London (Tower Hill) and 2.04 at Wroxeter, and by the exclusive use of Types I and II stone (figs. 4E; 6B). As a total of 13 sites of both kinds falls into this phase, it is judged unlikely that it is an artefact of the overall sampling. The final phase sees a return to a wide range of proportions (figs. 4C, F; 5A, B), from a form-ratio of 1.62 at Portchester to 2.44 at Great Witcombe.
Values for the compliance range widely (fig. 4A, B, D; 5A, B), but form in the ordination a broad mode between 3.1% and 91.1% (fig. 8C, D). There are perhaps minor clusters at c. 9%, c. 45%, and c. 74%. Whereas some builders worked with blocks of comparatively uniform thickness (low compliance), erecting courses of roughly constant height, others employed stone that approximated to a constant form-ratio (high compliance), with all stages between, building courses of variable height. No correlations between compliance, lithological type and builder are recognizable. Since only five samples yield negative values of the compliance (Table 1), there is, as may be expected (see above), a positive correlation (p<5%) with the coefficient of variation of height. There is a little evidence for a change in compliance over time. During the first phase identified in fig. 11B the compliance is on average lower (36.7%) and more consistent (st. dev. 29.1%) than in the later ones. An overall average of 47.7% (st. dev. 45.2%) is recorded for the compliance in the second phase. In the final phase the compliance averages 42.2% (st. dev. 52.2%).
An issue that the survey leaves unresolved is the question of whether the building blocks were dressed primarily at their quarry sources or at the building sites. Accounting for the dates of the buildings, the lithometric data (Table 1) reveal no obvious differences between blocks of stone from what may be regarded as ‘distant’ sources and those that are ‘local’, that is, lying within a few kilometres of the building site (see above). A possible difference is present, however, in the case of the coefficient of variation. The overall mean value of the coefficient for all parameters at sites with local sources (see above) agrees to within one per cent of the equivalent value for sites with sources that are distant, but the more variable coefficients are those for the distant sources. Applying an F-test, the difference between the two standard deviations is statistically significant at the 1% probability level, but it is not clear how this subtle evidence should be interpreted. Archaeologically, there is some evidence for final dressing at the building site. The Kentish rag that formed the cargo of the Blackfriars boat is described and illustrated not as dressed blocks but as taking the form of irregular lumps weighing up to 31 kg.Footnote 42 This is but a single sample, and would not seem to represent the most economical way of transporting stone, even from a local source, but may point to a sharp distinction between the trades of quarryman and mason.
Another unresolved issue is the manner in which the walls of the structures considered here were finished off. Giving examples, BidwellFootnote 43 points out that Roman walls could be whitewashed, plastered or rendered overall, or simply pointed in various decorative ways prior to possible whitewashing (the basic coursed structure of the facing stones remained for all to see). Parts of Hadrian’s Wall, for example, may have been plastered overall, and there is a Roman structure near Kenchester with trompe l’oeil ashlar painted on the plaster coating. The lithometric data suggest, however, that, generally speaking, considerable care was taken to make walls with regular courses (figs. 4–6). Such care would be unnecessary if subsequently an overall cover of plaster or render was to be applied. It is therefore likely that any decorative treatments were initially limited to some form of pointing. Evidence for decorative pointing is reported from the Caerleon amphitheatre, Caerwent town wall, Colchester town wall, and from buildings at Leicester, South Shields and Corbridge.Footnote 44
DISCUSSION
The above account outlines a scheme for the lithometric analysis of the stone building blocks that face Roman walls in Britain in the form of petit appareil, allowing them to be characterized in terms of block length, height, apparent size (area), and apparent proportions. When these data are linked to the geological characteristics of the stone, especially those that govern workability, it becomes possible to obtain new insights into Roman building practices in Britain, especially changes in ‘tradition’ and sourcing over time.
The account is based on an analysis of Roman masonry at 31 sites, on the basis of which it is now possible to characterize petit appareil quantitatively. Typically, the blocks in masonry of this style are between about one-third and one-half of a Roman foot (29.6 cm) in height (fig. 7C, D), and between three-quarters and one foot in length (fig. 7A, B). These dimensions are rather greater than the height of 10–12 cm and the length of 10–20 cm given by AdamFootnote 45 as a general average for ‘small’ blocks, described largely from Gallic sites, which is his only quantitative statement. It is also possible to specify block size in terms of exposed area (fig. 8A, B). The data suggest that, within the range of typical linear dimensions, there was a preference over the whole of the Roman period for blocks of two slightly different sizes, with mean areas of c. 310 cm2 and c. 400 cm2 respectively. Their individual dimensions at any one wall display significantly more variability (Table 1) than is implied by some of the coursed stonework illustrated by Adam,Footnote 46 formed of perfectly regular courses of carefully dressed and mainly almost square blocks (i.e. F≈1). In the case of British buildings, values for the mean form-ratio measure up to 2.54 and at no site does this parameter fall below 1.50.
Reflecting Pythagorean ideas, Vitruvius in Books 2–4 of De architectura stressed the importance of symmetry and proportion in architecture, and advocated the use of simple ratios in building design and construction, from the overall shape of the structure, to that of individual spaces and the detailing.Footnote 47 He says nothing about the proportions of stone building blocks, but it would be surprising if his advice did not also influence building work at this level.
Many simple proportions, some systematic in character, were known in the pre-modern world. Calculated as values of the form-ratio above, they include 2:3 (F=1.5), 3:8 (F=1.60), 3:5 (F≈1.67), 1:√3 (F≈1.73), 1:2 (F=2.00), 1:√5 (F≈2.24), and 1:√6 (F≈2.45). Some of these numbers are irrational, arising, for example, in the sequence of right-angled triangles based on a square of unit side, whereas others depend on early integers in the Fibonacci series 0, 1, 1, 2, 3, 5, 8 … The ratio of two consecutive numbers in the latter tend to Euclid’s irrational number known as the Golden Ratio or Mean (F≈1.62), widely used in classical and medieval architectural design, having also a geometrical interpretation among the proportions of a pentagon (1:(1+√5)/2). Another special but larger number is 1:(1+√2)(F≈2.41).
The observed range of mean values of the British form-ratio is from 1.50 to 2.54, a numerical space wide enough to accommodate all nine of the simple and special ratios listed above. Were any actually used by the Roman builders? Three clusters of values are tentatively recognized (fig. 9), one centred on 1.72, a second on 2.01, and a third on 2.29. All three clusters overlap slightly when the c. ±10% error associated with population means is taken into account (see above). The first cluster looks close to 1:√3 but is broad enough also to include the ratios 3:8 and 3:5, as well as the Golden Ratio. The second and third are much narrower and centred each on a single simple ratio, effectively on 1:2 and 1:√5 respectively, and could therefore represent real preferences. There is no convincing evidence from within the first, broad cluster that any particular simple ratios were consciously or subconsciously selected within this range, but there is, as noted, a decided preference on the part of military builders for low proportions generally (fig. 9B). In this regard, it is interesting to note that the masonry forts depicted by the artists of Trajan’s Column of the early second century in Rome — a commemoration of his victorious Dacian campaigns — yield form-ratios typically between 1.5 and 1.8, but occasionally as low as 1.3 and as high as 2.0.Footnote 48
The three-phase chronological pattern of proportion in the application of stone to general purposes is unexpected (fig. 11). Non-military builders shadow the military ones, the main difference being a seeming preference on the part of the latter for Types I and II lithologies and, as noted, generally low values of the form-ratio.
Military outnumber non-military builders during the early phase and all but one draw upon a local source of stone. The igneous rocks used at Leicester outcrop 10–12 km away, but represent the nearest worthwhile building stone. The Triassic sandstones are thin and few, the cementstones of the local Lias necessitate quarries with much waste of shale, and the Middle Jurassic limestones lie 40 km distant. Although mainly procured locally, stone was handled with varying degrees of consistency. The form-ratio is relatively consistent at between 1.50 and 1.79 for the Hadrianic masonry on the northern frontier, erected over a period of a decade and a half. At military Caerleon, however, where the data cover three building dates that also fall within a c. 15-year interval, the proportions used range from 1.85 (defences) to 2.33 (barracks). The high value of 2.54 enforced by Type-III lithology at non-military Wall seems far-removed from a possible tradition in Vitruvius’ image. The emphasis on adequate stone available as far as possible locally, and a relaxed approach to proportion, suggests that necessity drove builders during this phase.
Although dominated by non-military builders, the middle phase is typified by a narrow range of low proportions and the use of mainly non-local Types I and II stone (fig. 11). This could betoken a more selective and considered approach to the procurement and handling of general-purpose stone than earlier. Both kinds of builder imported Kentish rag into London from the Medway area several tens of kilometres away. A quartzitic sandstone from the Leziate Beds was carried long distances round the East Anglian coast for the fort at Brancaster and the ‘lost’ building at Reedham on the Yare. This rock is a bright off-white when freshly quarried, suggesting that it could have been selected on aesthetic groundsFootnote 49 in preference to the more readily and obviously available dark brown Carstone, so effectively used in medieval and post-medieval times.Footnote 50 Did the bright near-whiteness of freshly-worked Kentish rag have a similar appeal for builders in Roman London, perhaps on account of a Mediterranean tradition? Whatever the particular appeal of this stone, it seems to have been enduring, despite the considerable distance from the source.
The late phase encompasses the unsettled times of the late third and earliest fourth centuries a.d. and the constraints on earlier builders perhaps re-emerged. There is a return to all three lithological types, an emphasis on local procurement, and a wide range of masonry proportions (fig. 11). Strictly local procurement is evident only at the non-military structures. Except for perhaps the fort at Richborough, the stone sampled at the other military sites was obtained under the same constraints as the bath-house at Leicester, that is, from the nearest source of suitable material even when that was 10 km or so distant. It may therefore be a coincidence rather than a choice on aesthetic grounds that the bright, pale-coloured Lower Magnesian Limestone was exploited at York. Other than the iron-cemented Upper Greensand at the Portchester Watergate — a comparatively special application — there is no evidence for the remote procurement of any particular stone.
It would, therefore, seem that petit appareil masonry in Roman Britain has a well-defined character that can be expressed quantitatively through lithometric analysis, but which has been influenced by geological considerations, and has varied over time in response to changing circumstances. Roman military builders tended to prefer low length:height ratios for their facing masonry but there is little evidence that they worked to particular values legitimized by architectural theory.
ACKNOWLEDGEMENTS
It is a pleasure to thank Stephen Clews (Curator, Bath) for allowing me to work at the Roman baths, Jennifer Hall (Museum of London) for advice and guidance in Roman London, Lord Bledisloe for the opportunity to visit the religious complex at Lydney Park, and Michael Fulford for encouragement and practical help. I am greatly indebted to Catherine and Jean Allen for assistance and companionship in the field.