Introduction
Syntopic species are defined by co-occurrence in the same macrohabitat (Rivas, Reference Rivas1964) and are likely to face strong competition when presenting morphological, ecological and/or physiological similarities (Wootton, Reference Wootton1990; Oliveira & Isaac, Reference Oliveira and Isaac2013; Bonato & Fialho, Reference Bonato and Fialho2014). Among the different niche dimensions where these species may overlap (i.e. habitat use and activity period, among others), the trophic component is the most approachable and frequently applied tool in studies evaluating the mechanisms underlying syntopic coexistence (Bearhop et al., Reference Bearhop, Adams, Waldron, Fuller and MacLeod2004). Trophic niches are influenced by resource density and diversity, population density, competition and predation susceptibility (Fox, Reference Fox1981; Bearhop et al., Reference Bearhop, Adams, Waldron, Fuller and MacLeod2004; Olsson et al., Reference Olsson, Stenroth, Nyström and Graneli2009), all of which are related to consumer body size (Werner & Gilliam, Reference Werner and Gilliam1984; Scharf et al., Reference Scharf, Juanes and Rountree2000). The latter attribute is often considered in studies performed within the field of fish ecology (Woodward & Hildrew, Reference Woodward and Hildrew2002; Russo et al., Reference Russo, Pulcini, O'Leary, Cataudella and Mariani2008; Vasconcellos et al., Reference Vasconcellos, Gomes-Gonçalves, Santos, Cruz Filho and Araújo2018; Andrade-Tubino et al., Reference Andrade-Tubino, Milagre and Araújo2019), since the number of potential prey items and species trophic level are positively associated with the improvement of fish morphological apparatus, as well as swimming and foraging abilities (Werner & Gilliam, Reference Werner and Gilliam1984; Woodward et al., Reference Woodward, Ebenman, Emmerson, Montoya, Olesen, Valido and Warren2005; Romanuk et al., Reference Romanuk, Hayward and Hutchings2011).
Most marine fish species undergo ontogenetic dietary shifts (Costa, Reference Costa2009; Guedes et al., Reference Guedes, Araújo, Pessanha and Milagre2014; Vasconcellos et al., Reference Vasconcellos, Gomes-Gonçalves, Santos, Cruz Filho and Araújo2018; Andrade-Tubino et al., Reference Andrade-Tubino, Milagre and Araújo2019), which may occur in response to the intrinsic characteristics of each individual (i.e. physiological demands, anatomical structure and behaviour) and/or environmental factors, such as habitat, food supply and predation risk (Sogard, Reference Sogard1997; de Roos et al., Reference de Roos, Leonardsson, Persson and Mittelbach2002; Svanbäck & Persson, Reference Svanbäck and Persson2004). These dietary changes are usually followed by an increase in prey selectivity and energy gain (Werner & Gilliam, Reference Werner and Gilliam1984; Aarnio et al., Reference Aarnio, Bonsdorff and Rosenback1996; Elliott et al., Reference Elliott, Hemingway, Costello, Duhamed, Hostens, Labropoulou, Marshall, Winkler, Elliott and Hemingway2002), and may also reduce the competitive pressure within and between species populations (Platell et al., Reference Platell, Sarre and Potter1997; Vasconcellos et al., Reference Vasconcellos, Gomes-Gonçalves, Santos, Cruz Filho and Araújo2018; Andrade-Tubino et al., Reference Andrade-Tubino, Milagre and Araújo2019). Resource partitioning by fish from distinct cohorts can minimize density-dependent effects on food supply, thus weakening negative interactions at the intraspecific level, while also increasing species niche breadth (Werner & Gilliam, Reference Werner and Gilliam1984; Vasconcellos et al., Reference Vasconcellos, Gomes-Gonçalves, Santos, Cruz Filho and Araújo2018; Andrade-Tubino et al., Reference Andrade-Tubino, Milagre and Araújo2019). Differences in size may also influence the degree of niche overlap between species within a trophic guild (i.e. displaying a similar functional role), thus aiding their coexistence in a given environment (Schückel et al., Reference Schückel, Sell, Kröncke and Reiss2012; Garcia et al., Reference Garcia, Garcia, Vollrath, Schneck, Silva, Marchetti and Vieira2018; Vasconcellos et al., Reference Vasconcellos, Gomes-Gonçalves, Santos, Cruz Filho and Araújo2018). Moreover, a strong dissimilarity in the species body size itself may unravel the influence of non-random interactions (i.e. competition) in structuring the biotic community (Gotelli et al., Reference Gotelli, Hart and Ellison2015).
Fish from the Trachinotus genus are widely distributed throughout the Atlantic, where juveniles are commonly found inhabiting the surf zone of sandy beaches (Zahorcsak et al., Reference Zahorcsak, Silvano and Sazima2000; Niang et al., Reference Niang, Pessanha and Araújo2010; Palmeira & Monteiro-Neto, Reference Palmeira and Monteiro-Neto2010; Vaske-Junior et al., Reference Vaske-Junior, Viliod and Knoeller2018). Five species have been recorded in the Brazilian coast, of which Trachinotus cayennensi Cuvier, 1832, occurs exclusively in the north-east shelf, while the other four are found along the entire coast. The Florida pompano Trachinotus carolinus (Linnaeus, 1766) and the great pompano Trachinotus goodei Jordan & Evermann, 1869 are the most abundant species in beaches in south-eastern Brazil, where they benefit from a variety of food resources and protection against predators during most of the annual cycle (Niang et al., Reference Niang, Pessanha and Araújo2010; Palmeira & Monteiro-Neto, Reference Palmeira and Monteiro-Neto2010; Franco et al., Reference Franco, Chaves, Castel-Branco and Santos2016; Souza et al., Reference Souza, Santos and Santos2018). These morphologically similar species have a strong competitive potential, as a high degree of niche overlap has been reported for their juveniles (Vaske-Junior et al., Reference Vaske-Junior, Viliod and Knoeller2018). A high resource exploitation intensity between closely related species may lead to local exclusion of the less-fit competitor if species do not adopt strategies to promote trophic niche separation (Hardin, Reference Hardin1960; Pianka, Reference Pianka1974). Therefore, evaluating potential relationships between the diet of syntopic species and their morphological traits may reveal co-evolutionary strategies that would promote population stability and interspecific coexistence (Werner & Gilliam, Reference Werner and Gilliam1984; Day et al., Reference Day, Hall, Kemp, Yáñez-Arancibia, Day, Hall, Kemp and Yáñez-Arancibia1989; Platell et al., Reference Platell, Sarre and Potter1997).
In this context, the aim of this study was to analyse the influence of size on the trophic interactions between the juveniles of two syntopic species Trachinotus carolinus and Trachinotus goodei. These juveniles are expected to reveal intra- and interspecific dietary partitioning related to their body size. To test this hypothesis, the size structure of juvenile pompano was assessed in order to ascertain patterns that might be related to species-specific dietary shifts. The hypothesis that juveniles with distinct body sizes would share fewer resources than those within the same size groups was evaluated, and that interspecific feeding resource partitioning would increase with size.
Materials and methods
Study site
Located in the state of Rio de Janeiro, one of the largest metropolitan areas in Brazil (>16 million habitants), Guanabara Bay (22°50′S 43°10′W; Figure 1) extends 28 km along its north-south axis and 30 km at its west-east axis, covering ~381 km2 of surface area (Fistarol et al., Reference Fistarol, Coutinho, Moreira, Venas, Cánovas, Paula, Coutinho, Moura, Valentin, Tenenbaum, Paranhos, de Valle, Vicente, Amado Filho, Pereira, Kruger, Rezende, Thompson, Salomon and Thompson2015). Water circulation within the bay is mainly related to the micro (i.e. 0.7 m of amplitude) and semi-diurnal tidal regime, which features maximum currents of 1.6 m s−1 at the entrance channel, resulting in 11.4 days to renew 50% of the resident water (Fistarol et al., Reference Fistarol, Coutinho, Moreira, Venas, Cánovas, Paula, Coutinho, Moura, Valentin, Tenenbaum, Paranhos, de Valle, Vicente, Amado Filho, Pereira, Kruger, Rezende, Thompson, Salomon and Thompson2015). Guanabara Bay's environmental characteristics follow a marine-estuarine gradient along its longitudinal axis, where typical marine conditions of higher salinity, dissolved oxygen and pH prevail at the entrance of the bay, in the lower estuary, whereas the inner areas of the bay, in the upper estuary, are distinguished by eutrophic, polluted and mixohaline waters (Fistarol et al., Reference Fistarol, Coutinho, Moreira, Venas, Cánovas, Paula, Coutinho, Moura, Valentin, Tenenbaum, Paranhos, de Valle, Vicente, Amado Filho, Pereira, Kruger, Rezende, Thompson, Salomon and Thompson2015; Chaves et al., Reference Chaves, Franco, Seixas, Rodrigues da Cruz and Santos2018).
Geographic location of Dentro (A), Fora (B) and Vermelha (C) beaches, Guanabara Bay, RJ, Brazil. Dark grey indicates land; white indicates water.

Dentro, Fora and Vermelha beaches are located close to each other (<2 km) and near the Guanabara Bay entrance (Figure 1), undergoing practically the same periodical influence of both estuarine (i.e. inner bay) and oceanic (i.e. outer bay) waters (Franco et al., Reference Franco, Chaves, Castel-Branco and Santos2016; Souza et al., Reference Souza, Santos and Santos2018). These beaches are predominantly composed by fine sand (Catanzaro et al., Reference Catanzaro, Baptista Neto, Guimarães and Silva2004), differing from each other regarding wave exposure and anthropogenic pressure. Vermelha beach (22°57′19″S 43°09′49″W) and Fora beach (22°56′42″S 43°09′17″W) are ~300 and 400 m long, respectively, with a steep slope and influenced by wave action. Dentro beach (22°56′34″S 43°09′33″W) is ~100 m long, with a smooth slope, and is the most sheltered from wave action, which rarely reaches >0.25 m height (Souza et al., Reference Souza, Santos and Santos2018). Fora and Dentro beaches are also located inside the São João Fortress, a military complex with limited access to bathers and fishers, in contrast to Vermelha beach, which is intensively used by the local population (Franco et al., Reference Franco, Chaves, Castel-Branco and Santos2016).
Sampling
The surf zones of Dentro, Fora and Vermelha beaches were surveyed once per season in May 2011 (autumn), September 2011 (winter), December 2011 (spring) and March (summer) 2012. Samples were carefully distributed along the beach to avoid overlapping hauls (i.e. 3–7 replicates per beach according to the length of the beach), and were carried out between 09:00 and 16:00 h, using a seine net with a codend (20 m width × 2 m height; 7 mm mesh size). For each sample, the seine was opened 20 m away from the shoreline and hauled through ropes along the surf zone (i.e. from deeper to shallower areas, towards the coast), thus resulting in a sampling area of 400 m2 per haul. Sampling was authorized by the Chico Mendes Institute for Biodiversity Conservation (ICMBio), Brazilian Ministry of the Environment (permit number: 48201-2). Collected fish were placed in plastic bags, labelled and cooled on ice in the field, before being transferred to the Laboratory of Theoretical and Applied Ichthyology (LICTA) at the Federal University of the State of Rio de Janeiro (UNIRIO), for storage in a freezer.
Laboratory procedures
Trachinotus carolinus and Trachinotus goodei juveniles were identified (Figueiredo & Menezes, Reference Figueiredo and Menezes1980) using the first maturation length (L50) proposed by Muller et al. (Reference Muller, Tisdel and Murphy2002) (L50 = 356 mm) and Alvarez-Lajonchére & Ibarra-Castro (Reference Alvarez-Lajonchère and Ibarra-Castro2012) (L50 = 547 mm), respectively. All specimens were weighed (g) using precision scales (accuracy of 0.001 g), total length (TL, mm) was determined and the stomachs were removed and stored in a 10% formalin solution for dietary analyses. Stomach contents were identified to the lowest taxonomic level under a stereomicroscope (Zeiss stereoscope) with additional specialist assistance, weights were recorded (precision scale – accuracy of 0.001 g) and were subsequently grouped into six trophic categories (i.e. algae, molluscs, annelids, crustaceans, insects and fish).
Data analysis
Size structure
Juvenile pompano were distributed in eight size classes, at 25 mm intervals, defined by the Sturges Algorithm (Sturges, Reference Sturges1926), as follows: SA = A/K, with K = 1 + 3.3 × log n, where: A is the range between the highest and lowest value in each size class; K is the number of classes; and n is the total abundance of individuals. Classes I (35–60 mm), II (60–85 mm) and III (85–110 mm) were gathered together to create Size Group 1, represented by the smallest juveniles; classes IV (110–135 mm), V (135–160 mm) and VI (160–185 mm) comprised Size Group 2, which consisted of medium-size juveniles; and classes VII (185–210 mm) and VIII (≥210 mm) composed Size Group 3, with the largest young fish (i.e. sub-adults) caught in this study.
Size overlap between the pompano species was investigated using a null-model analysis of the average total length (TL) of each species per site (beach). The null-model analysis matches observed vs expected size differences for each pair of species in the data matrix, in order to reveal unusual patterns in species body size due to non-random interactions such as competition (Gotelli et al., Reference Gotelli, Hart and Ellison2015). The algorithm chosen for this test was the ‘size uniform user’, which allows the user to define the endpoints of the original and simulated matrices, in this case, the lowest (i.e. 39 mm) and highest (i.e. 228 mm) TL values recorded in the sample universe of the present study. The ‘minimum size ratio’ was the metric chosen for this test, which scans the smallest size ratio in the original matrix and compares it with the critical minimum ratio, a value generated by the simulated matrices that account for species coexistence. Significant differences in the upper or lower-tail P-values reveal segregation or convergence in species body size, respectively (Gotelli et al., Reference Gotelli, Hart and Ellison2015). The size ratio null-model was applied using the ‘EcoSim’ package for R (1000 interactions; R Core Team, 2019).
Diet and trophic strategy
The percentage of empty stomachs (Vacuity Index) per size group was assessed for each pompano species in order to evaluate the feeding activity of Trachinotus juveniles according to size, through the formula: VI = S 0/TS (Berg, Reference Berg1979), where S 0 is the number of empty stomachs and TS is the total number of stomachs. Rarefaction and extrapolation (R/E) curves were constructed for each species to assess if the sampling effort carried out herein was suitable to describe the diet of juvenile pompano, using the ‘iNEXT’ package (Chao et al., Reference Chao, Gotelli, Hsieh, Sander, Ma, Colwell and Ellison2014; Hsieh et al., Reference Hsieh, Ma and Chao2019) for R (R Core Team, 2019). This method computes diversity estimates and the associated 95% confidence intervals to plot sample-size based and coverage-based R/E curves, using the Hill numbers procedure described in Chao et al. (Reference Chao, Gotelli, Hsieh, Sander, Ma, Colwell and Ellison2014) and Hsieh et al. (Reference Hsieh, Ma and Chao2019), which has been described as the best choice to measure diversity (Ellison, Reference Ellison2010). Input data consisted of a presence/absence matrix of the trophic items consumed by each of the Trachinotus species (i.e. incidence raw type of data) and prey richness was the diversity measure chosen for this test (q = 0), thus not accounting for the relative weights of trophic items (Hsieh et al., Reference Hsieh, Ma and Chao2016).
The Kawakami Feeding Index (IAi) was used to describe the diet of juvenile pompano species, which encompasses frequency of occurrence (FO%) and weight (FW%) of dietary items and categories:  $IAi = FOi \times FWi/\sum _{i = 1}^n \lpar FOi \times FWi\rpar $, where FOi is the frequency of occurrence of the item or category i (%) and FWi is the frequency of weight of the item or category i (%). The frequency of occurrence (FO%) was calculated by dividing the number of times an item or category occurred and the total occurrence of the items or categories, multiplied by 100. The frequency of weight (FW%) was determined as a ratio between the weight of an item or category and the total weight of the items or categories, multiplied by 100 (Kawakami & Vazzoler, Reference Kawakami and Vazzoler1980). Differently from other feeding indices, the IAi does not encompass the per cent number (PN%) of each dietary item or category, thus relying solely on the FO% and FW%. Since there were uncountable items recorded in the stomachs of the Trachinotus species such as algae, snails, soft or fragmented bodies of molluscs, insects and crustaceans, the IAi was the most suitable option for describing our data. This feeding index also prevents potential bias arising from huge numeric variations amongst items/categories, as prey abundance is not necessarily correlated with greater biomass (i.e. several small individuals may account for less biomass than one large individual), thus being largely applied in the literature (Souza et al., Reference Souza, da Cruz Canellas, Sakabe, dos Santos and dos Santos2019; Santos et al., Reference Santos, Souza and Santos2020; Reis et al., Reference Reis, Albrecht and Bunn2020).
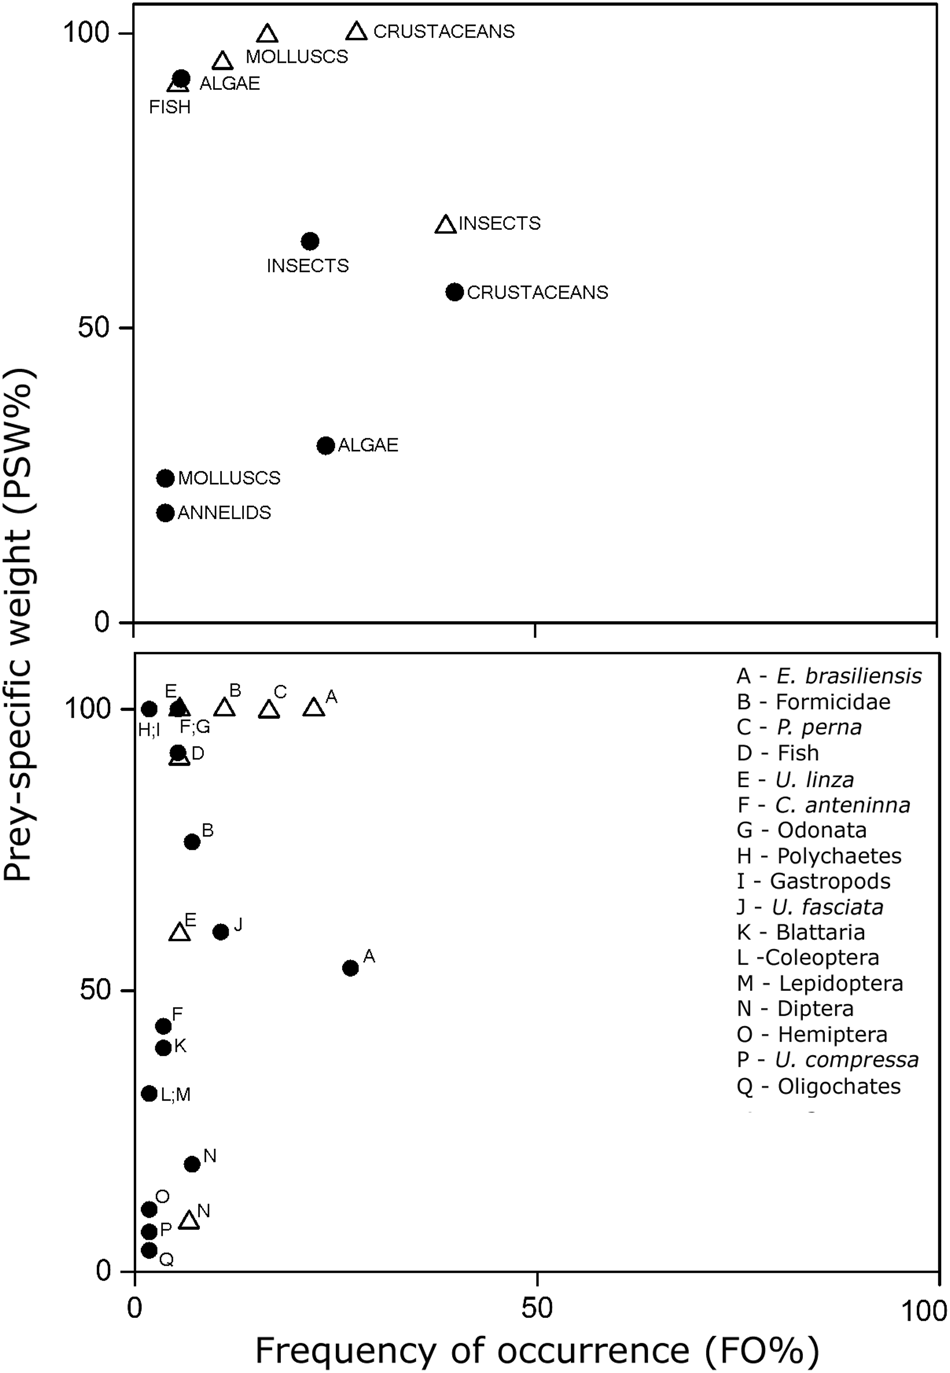
The feeding strategy adopted by each pompano species was assessed through a graphical analysis of dietary data, as in Amundsen et al. (Reference Amundsen, Gabler and Staldvik1996). The frequency of occurrence of each dietary item and category (FO%) was plotted against prey-specific weight (PSW%):  $PSW = \left({\sum {Wi} /\sum {WSi} } \right)\times 100$, where Wi is the weight of the item or category i and WSi is the total weight of all stomachs containing the item or category i. Items or categories in the upper left part of the diagram represent high between-phenotype component (BPC) to niche width, suggesting variations in resource use among individuals, while items or categories in the lower right part indicate that most individuals use different resource types simultaneously.
Seasonal dietary variations were not assessed in this study, as previous authors have reported that seasonality plays a minor role in the feeding of Trachinotus species (Helmer et al., Reference Helmer, Teixeira and Monteiro Neto1995; Niang et al., Reference Niang, Pessanha and Araújo2010). In addition, no spatial pompano dietary variation was evaluated, as the surveyed beaches are close to each other (<2 km) and under the influence of very similar physical and chemical water conditions (Franco et al., Reference Franco, Chaves, Castel-Branco and Santos2016), thus being considered a single beach system, among which these species would migrate.
Niche overlap
Niche overlap between Trachinotus species was assessed using a null-model analysis concerning the IAi values of the consumed items by each species (1000 interactions). The null-model analysis matches observed vs expected values of niche overlap in order to reveal if species are sharing (i.e. significant upper-tail P-value) or partitioning (i.e. significant lower-tail P-value) resources (Gotelli et al., Reference Gotelli, Hart and Ellison2015). The randomization algorithm chosen for this test was the RA3, which retains the real niche breadth observed for the assessed species in the simulated matrices. Thus, resource values are exchanged amongst rows without altering the number of trophic items each species fed on. RA3 also reshuffles the zeros found in the original data matrix, thus simulating the use of resources other than the ones that the assessed species actually fed on (Gotelli et al., Reference Gotelli, Hart and Ellison2015). The metric chosen for this test was the Czechanowski Index, performed using the ‘EcoSim’ package for R (R Core Team, 2019).
Size influence on juvenile pompano species diets
A clustering dendrogram was built based on the log10x + 1 transformed biomass of the trophic items and log10x transformed size (i.e. total length) of juvenile pompano, to assess whether ontogenetic dietary shifts agree with the established size groups based on the Sturges algorithm and validate their use as response variables in the RDA analysis (see next). Data were transformed in a dissimilarity matrix using the ‘vegdist’ (Bray–Curtis distance) function from the ‘vegan’ package (Oksanen et al., Reference Oksanen, Blanchet, Friendly, Kindt, Legendre, McGlinn, Minchin, O'Hara, Simpson, Solymos, Stevens, Szoecs and Wagner2019), and cluster analysis (method = ‘ward.D2’) was performed using the ‘hclust’ function from the ‘stats’ package of R (R Core Team, 2019). SIMPROF tests (Bray–Curtis distance, method = ‘complete’) were also performed using the ‘clustsig’ package for R (R Core Team, 2019), to assess the number of significant clusters produced with the ‘hclust’ (Whitaker & Christman, Reference Whitaker and Christman2014).
A Partial Redundancy Analysis (RDA) was applied on the log10x + 1 transformed biomass of the trophic items consumed by both Trachinotus species, aiming to detect diet composition shifts according to size groups. Data was permutated 999 times and the statistical significance of the RDA model was tested through an Analysis of Variance (ANOVA). Size groups (SG1, SG2 and SG3) were used as explanatory variables in this test, performed using the ‘vegan’ package (Oksanen et al., Reference Oksanen, Blanchet, Friendly, Kindt, Legendre, McGlinn, Minchin, O'Hara, Simpson, Solymos, Stevens, Szoecs and Wagner2019) in R (R Core Team, 2019).
Results
Size structure
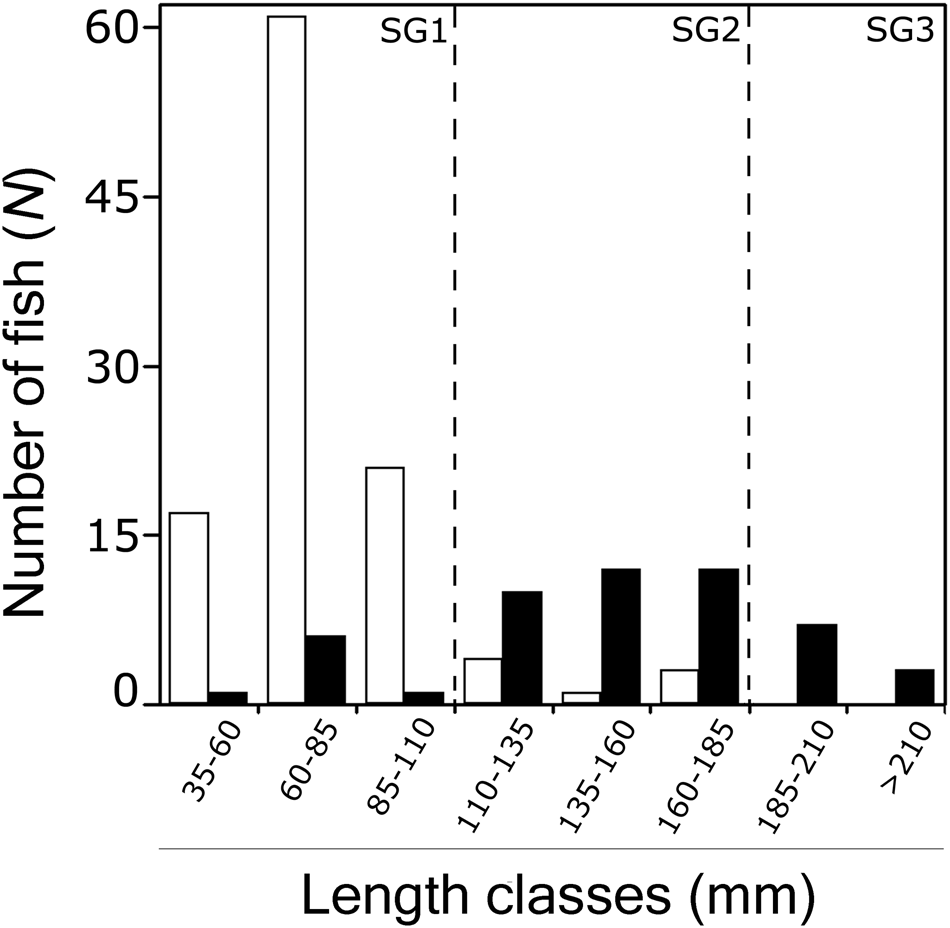
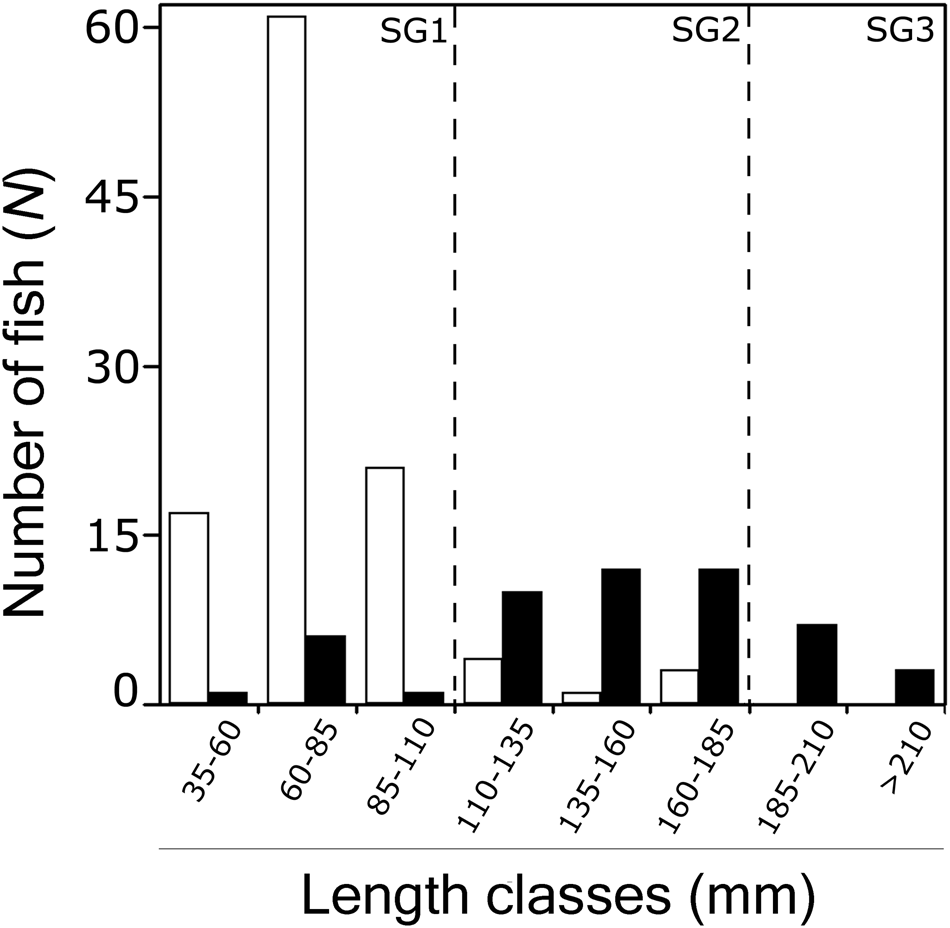
A total of 150 juvenile pompano were caught, ranging from 39 to 228 mm in TL. Of this total, 103 individuals were identified as the Florida pompano species Trachinotus carolinus (mean weight = 9 g ± 1.13; mean TL = 79.6 mm ± 2.4), and 47 as the great pompano Trachinotus goodei (mean weight = 46.7 g ± 3.34; mean TL = 147.7 mm ±4.2). Abundance calculations per length class indicate that T. carolinus juveniles were smaller than T. goodei juveniles, since most Florida pompanos were recorded on length classes I, II and III (i.e. Size Group 1), ranging from 35 to 110 mm in TL (Figure 2). In addition, no fish from this species were found for size group 3 (i.e. length classes VII and VIII). Trachinotus goodei juveniles were found in all length classes, with a highest abundance for size group 2 (i.e. length classes IV, V and VI), which ranged from 110 to 185 mm in TL (Figure 2).
Trachinotus carolinus (white) and Trachinotus goodei (black) abundance per length classes. The dotted line indicates the limit between size groups. SG1, Size Group 1; SG2, Size Group 2; SG3, Size Group 3.
The minimum size ratio of the assessed pompano species (observed mean = 1.20) was significantly higher than the critical minimum ratio obtained from the simulated matrices (expected mean = 1.07; upper-tail P = 0.04), revealing a segregation trend for Trachinotus species body size (Supplementary Figure S1).
Diet and trophic strategy
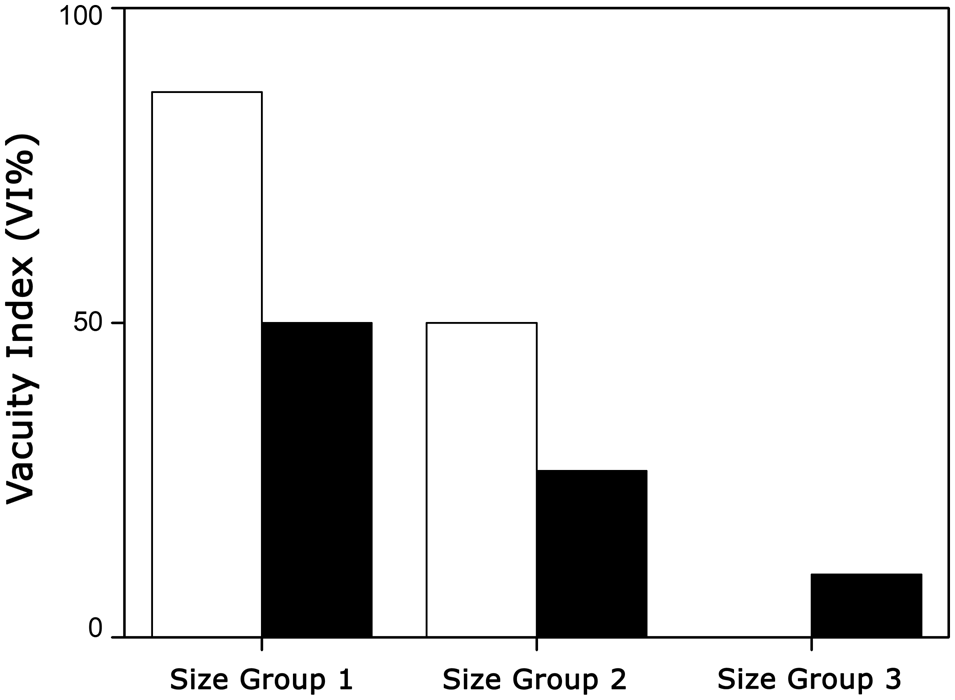
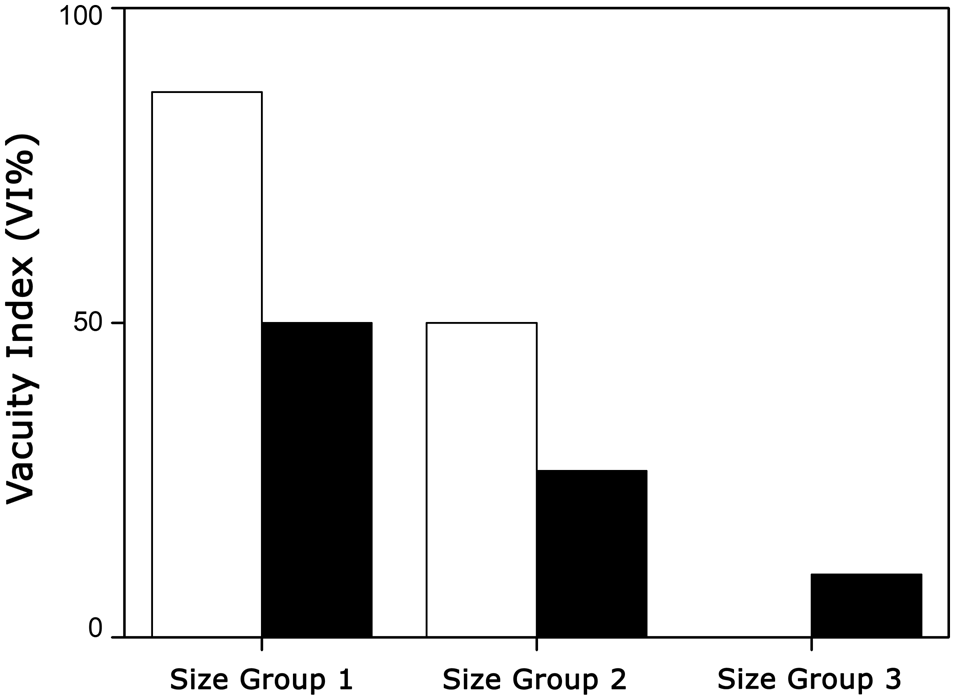
Pompano species juveniles displayed high vacuity (Figure 3), which hindered a dietary analysis per size groups. Thus, IAi values were obtained by mixing individuals from all length classes. A high percentage of empty stomachs was recorded for both species, especially in size group 1, and vacuity was higher for T. carolinus compared with T. goodei regarding all the size groups where both species co-occurred (Figure 3). In addition, medium and larger-sized juveniles seem to be more actively feeding than smaller fish, since VI values decreased according to the growth of both Trachinotus species, mainly T. goodei (Figure 3).
Vacuity Index (VI) for Trachinotus carolinus (white) and Trachinotus goodei (black) according to size groups.
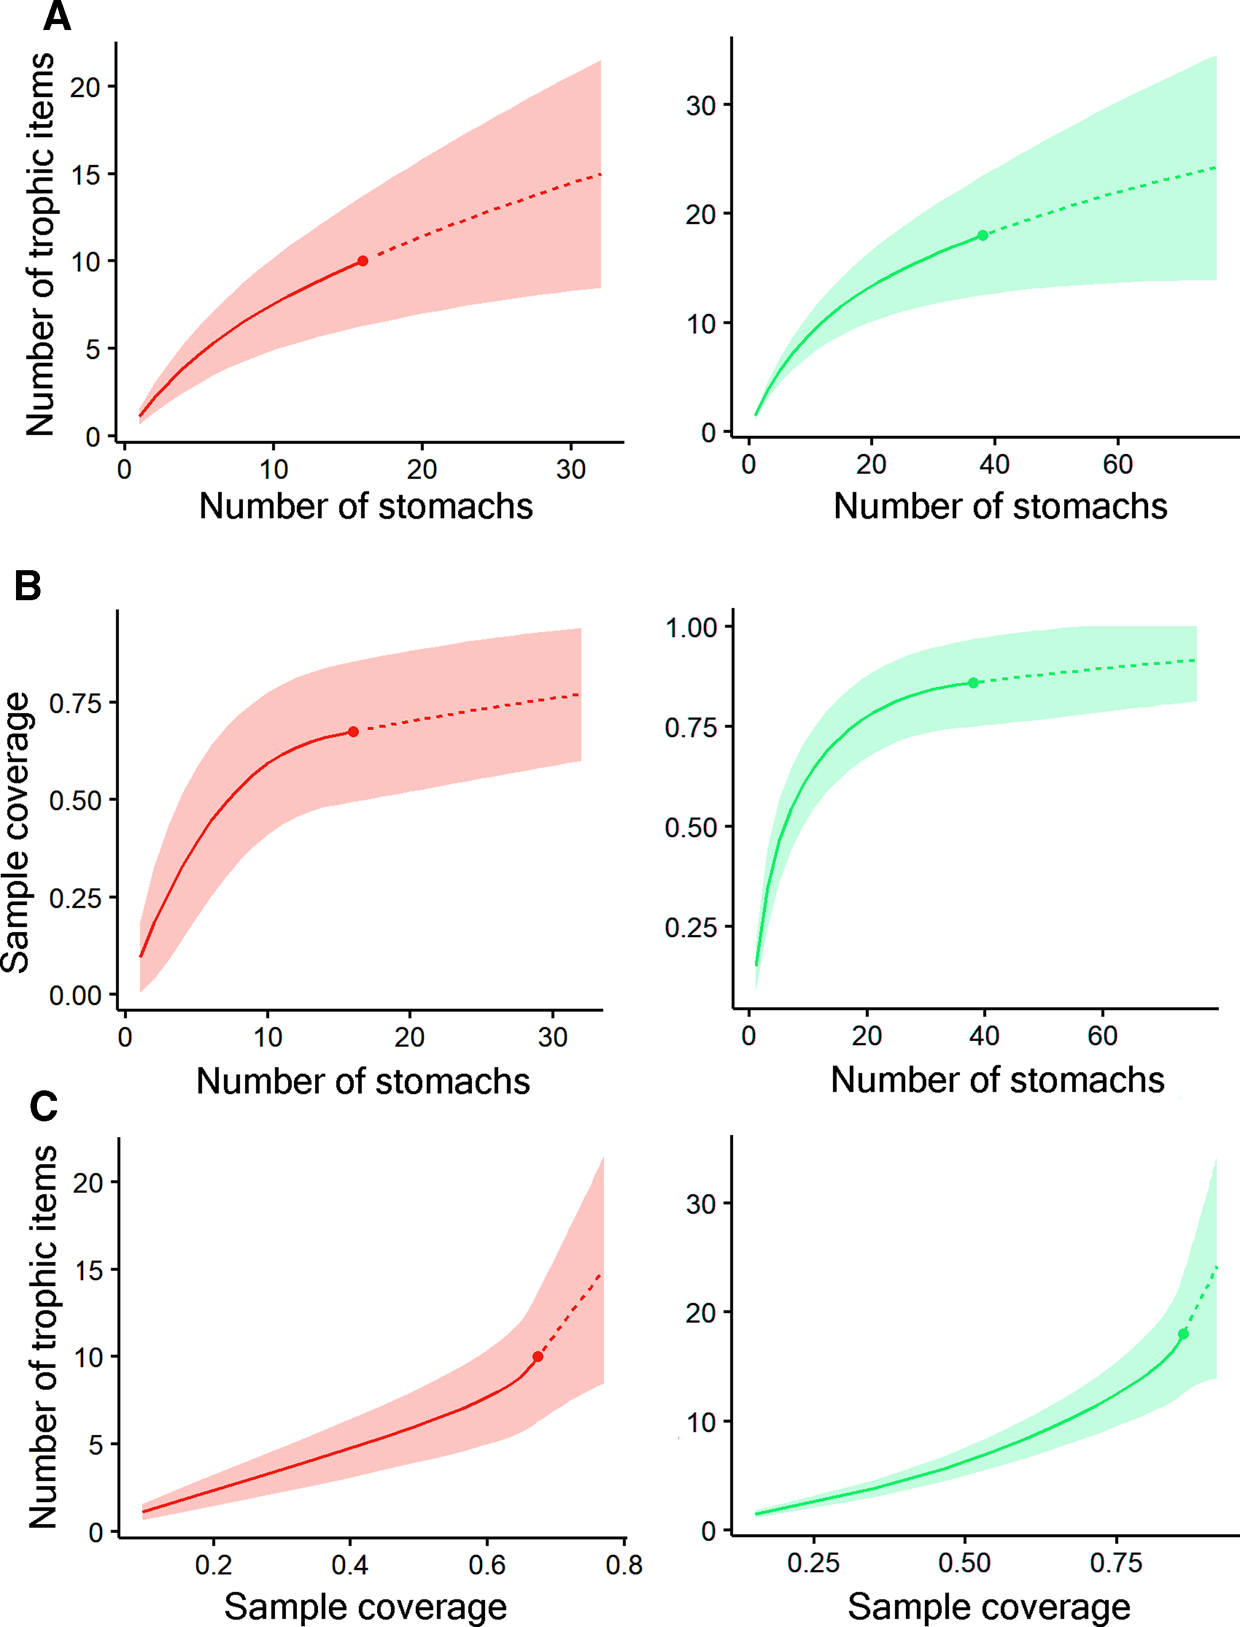
Sample-size based R/E curves revealed that the number of stomach samples did not reach an asymptote, especially regarding T. carolinus juveniles (Figure 4A). However, coverage-based R/E curves indicate that the number of stomach samples accounted for ~70% and 85% of the total prey diversity expected in T. carolinus and T. goodei diets, respectively (Figure 4B). Sample completeness R/E curves (Figure 4C) indicate higher prey diversity for T. goodei compared with T. carolinus, regardless of the percentage of sample coverage (i.e. interpolated and extrapolated).
Sample-size based (A), coverage-based (B) and sample completeness (C) R/E curves along with the associated 95% confidence intervals for Trachinotus carolinus (red) and Trachinotus goodei (green), calculated by the number of trophic items and stomach samples. Legend: solid line = interpolated method; dotted line = extrapolated method.

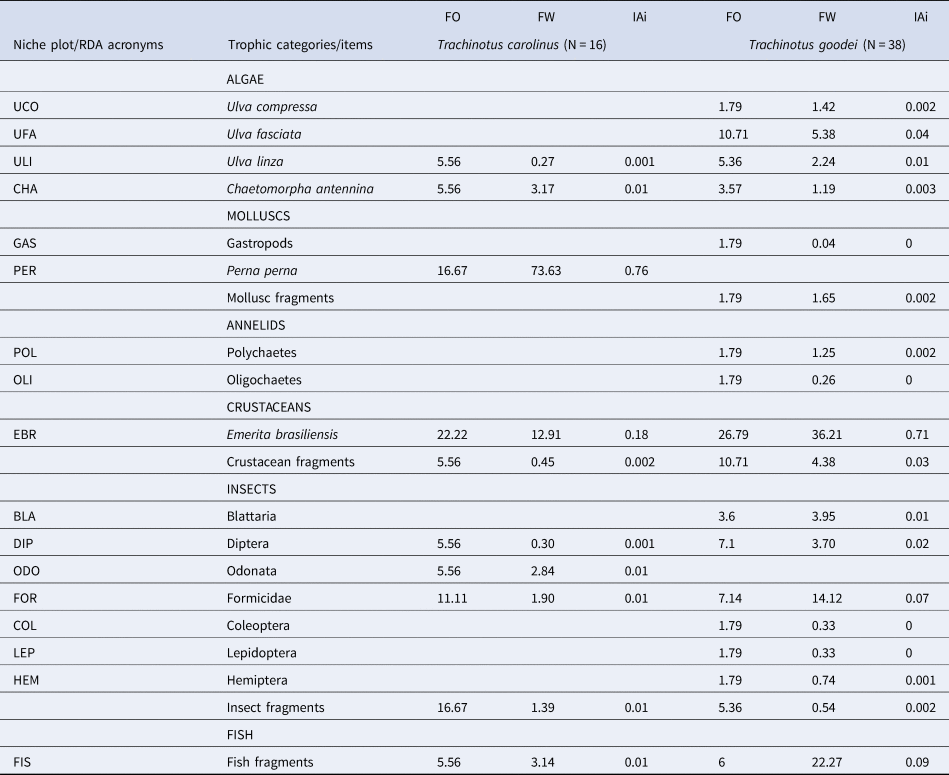
The stomach contents of 54 individuals were analysed, 16 (29.6%) from the Florida pompano T. carolinus and 38 (70.4%) from the great pompano T. goodei (Table 1). Overall, T. carolinus fed on 10 items, mainly molluscs (IAi = 0.64) and crustaceans (IAi = 0.20), while T. goodei fed on 18 prey, mainly crustaceans (IAi = 0.64) and insects (IAi = 0.21). The brown mussel Perna perna (IAi = 0.76) was the main item consumed by T. carolinus juveniles, followed by the mole crab Emerita brasiliensis (IAi = 0.18), while young T. goodei fed mostly on E. brasiliensis (IAi = 0.71). Despite the several types of insect prey consumed by T. goodei, none prevailed in this species' diet (IAi values <0.1 for all items; Table 1). According to the Kawakami Feeding index (IAi), the remaining categories and items consumed by the assessed Trachinotus species presented lower dietary representations (Table 1).
Frequency of occurrence (FO%), frequency of weight (FW%) and Kawakami's Feeding Index (IAi) for each item and trophic category consumed by Trachinotus carolinus and Trachinotus goodei at three sandy beaches at Guanabara Bay, RJ, Brazil

Acronyms used in the niche plot are also shown.
The graphical feeding strategy analysis revealed an opportunistic behaviour (higher between-phenotype component) for T. carolinus, with individuals specializing in different types of prey, such as the algae Chaetomorpha anteninna, the insects Formicidae and Odonata, the mollusc Perna perna, the crustacean Emerita brasiliensis and fish (Figure 5). These items were recorded at a high percentage of prey-specific weight, as well as their categories (except for insects). Trachinotus goodei displayed a mixed feeding strategy, with a trend towards a generalist behaviour (Figure 5). While some juveniles specialized in items such as polychaetes, gastropods, the algae Ulva linza and fish (the latter also presenting high PSW% values as a category), others fed on rare prey such as molluscs, annelids and the insects Coleoptera, Lepidoptera, Diptera, Hemiptera and Blattaria – items presenting low FO% and PSW% values (Figure 5).
Distribution of the trophic categories and items consumed by Trachinotus carolinus (Δ) and Trachinotus goodei (•) according to the method of Amundsen et al. (Reference Amundsen, Gabler and Staldvik1996).

Niche overlap
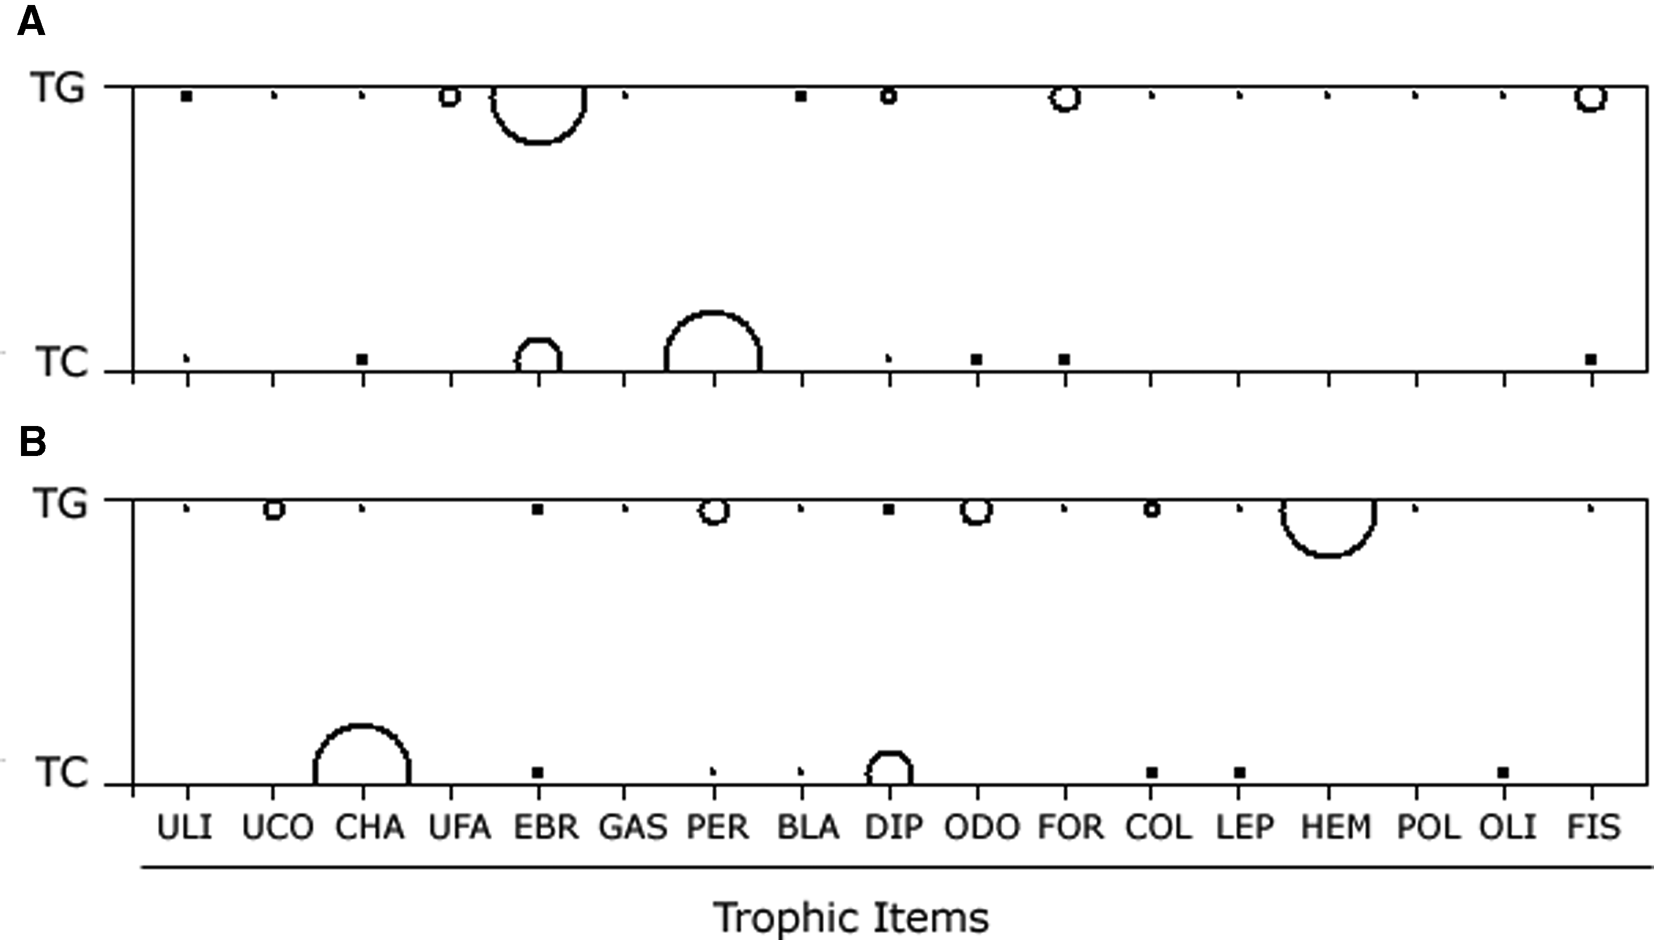
The niche overlap between the pompano species (Observed Index = 0.21) was higher than the value obtained from the simulated matrices (Simulated Index = 0.12), revealing that juveniles tend to share resources (Figure 6). However, this pattern was found to be only marginally significant (Upper-tail P-value = 0.09).
Niche plot for the observed (A) and simulated (B) matrices of the trophic items consumed by Trachinotus carolinus (TC) and Trachinotus goodei (TG). The area of each depicted circle is proportional to the use of a certain item by each species. See Table 1 for dietary items acronyms.

Influence of fish size on the juvenile pompano species diets
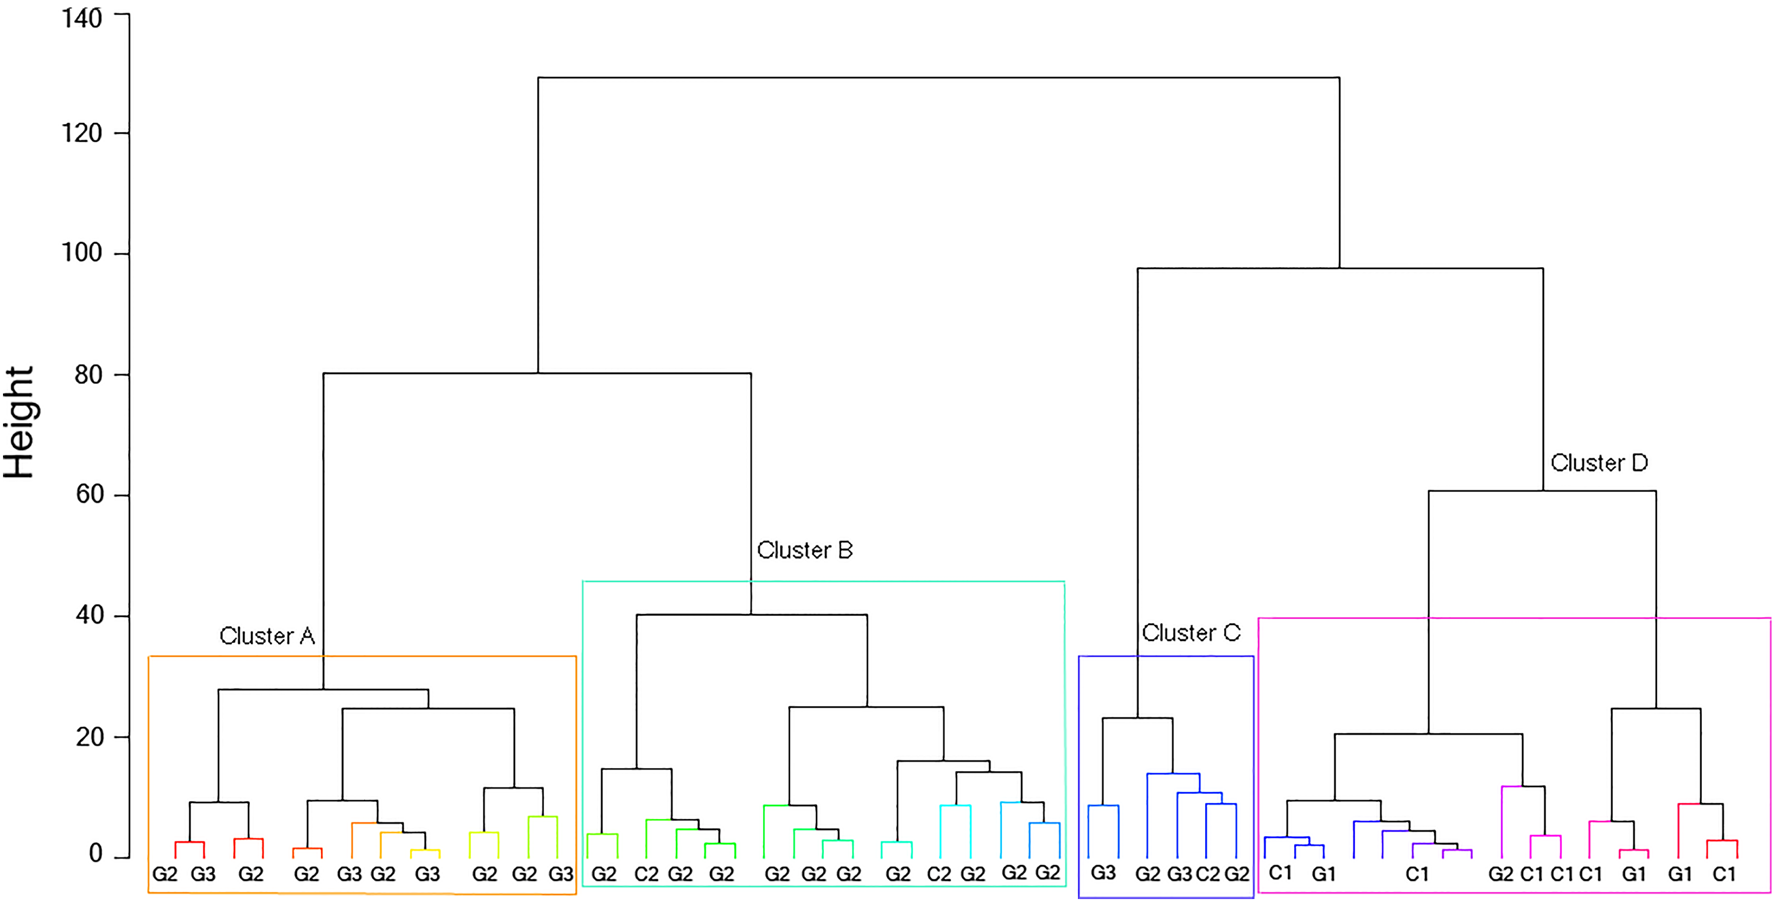
A cluster analysis on the biomass of trophic items consumed by the assessed Trachinotus species revealed four main feeding groups related to fish size (Figure 7). The first group (Figure 7, orange box) comprised T. goodei juveniles from size groups 2 and 3, whereas the second (Figure 7, cyan box) was formed exclusively by individuals belonging to size group 2 from both species. Group 3 (Figure 7, blue rectangle) mixed some T. goodei juveniles from size groups 2 and 3, while the fourth group (Figure 7, purple box) was formed by juveniles belonging to size group 1. The cluster analysis also revealed a dietary partitioning between individuals within each of the four groups (Figure 7).
Dendrogram obtained from the cluster analysis on the log10x + 1 biomass of trophic items consumed by Trachinotus carolinus (represented by letter C) and Trachinotus goodei (represented by letter G) juveniles per size. Numbers 1, 2 and 3 represent size groups, while colours represent the significant clusters.

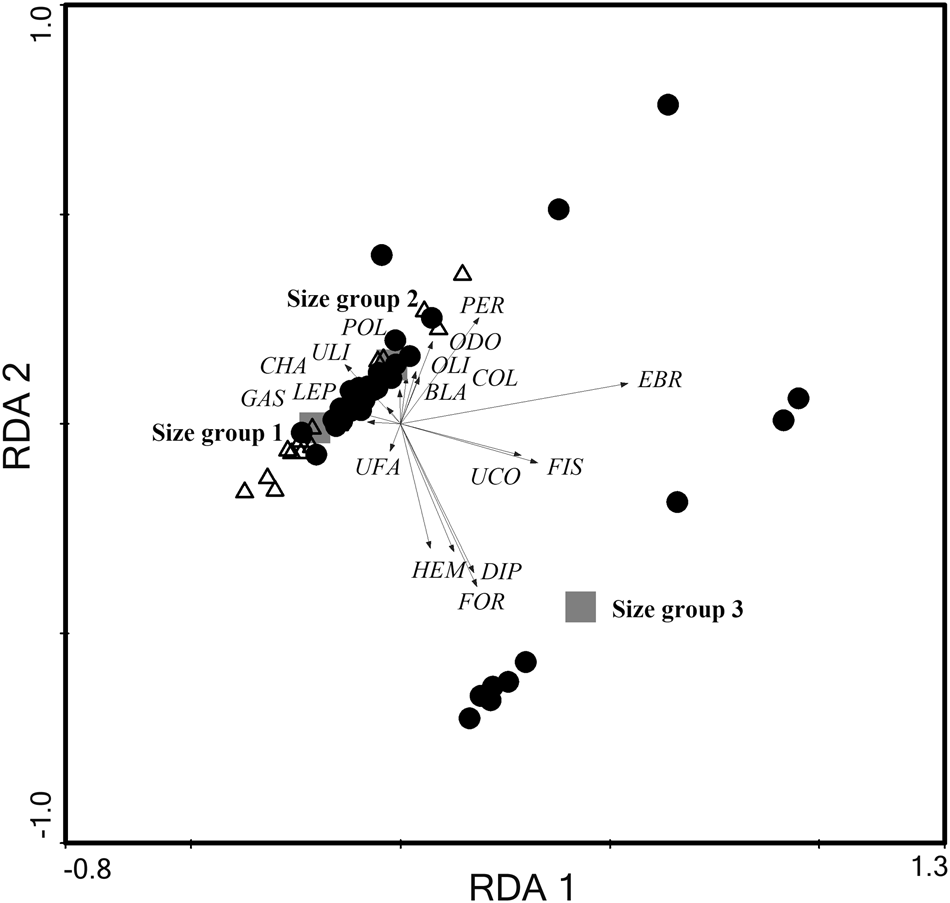
RDA axis 1 (eigenvalue = 1.71) accounted for 68.4% of the data variance regarding Trachinotus species diets (ANOVA: F = 2637.7; P < 0.001), and indicated size-related shifts concerning the trophic items consumed by juveniles (Figure 8). Eleven dietary items (i.e. Ulva fasciata, Ulva linza, Chaetomorpha anteninna, gastropods, Perna perna, polychaetes, oligochaetes, Blattaria, Odonata, Coleoptera and Lepidoptera) were correlated to juveniles from size groups 1 and 2, while five prey (i.e. Ulva compressa, Emerita brasiliensis, Diptera, Formicidae and fish) were associated with young T. goodei from size group 3.
Partial Redundancy Analysis (RDA) showing the trophic items consumed by Trachinotus carolinus (Δ) and Trachinotus goodei (•) according to size groups (■). See Table 1 for dietary items acronyms.

Discussion
The overall findings reported herein demonstrate the influence of size in the trophic interactions between juveniles of the pompano species Trachinotus carolinus and Trachinotus goodei. Trophic similarities were observed for small and medium-sized juveniles (i.e. size groups 1 and 2), whereas the largest juveniles (i.e. size group 3), represented exclusively by T. goodei, displayed little interspecific overlap with fish from other size groups. Pompano juveniles from size groups 1 and 2 also presented the highest vacuity values, particularly T. carolinus, revealing that these closely related species may be facing competition while sharing resources. These findings suggest complex trophic interactions between both pompano species, expanding on knowledge from previous studies, which have reported a high degree of niche overlap between Trachinotus juveniles, but failed to address the mechanisms through which co-existence is achieved (Helmer et al., Reference Helmer, Teixeira and Monteiro Neto1995; Zahorcsak et al., Reference Zahorcsak, Silvano and Sazima2000; Vaske-Junior et al., Reference Vaske-Junior, Viliod and Knoeller2018). By performing multivariate analyses on dietary data and fish size, this study indicates that the assessed Trachinotus species are partitioning feeding resources beginning at 185 mm in length (i.e. size group 3). In addition, this study also unveiled the importance of size concerning intraspecific trophic partitioning, as Trachinotus juveniles from size groups 1 and 2 specialized in different resource types (i.e. high BPC), leading to separate dietary clusters (Figure 7).
Young fish belonging to the Trachinotus genus are usually found inhabiting the surf-zone of sandy beaches, where they feed on a wide range of prey such as crustaceans, molluscs, annelids and small fish (Zahorcsak et al., Reference Zahorcsak, Silvano and Sazima2000; Batistic et al., Reference Batistić, Tutman, Bojanić, Skaramuca, Kŏzul, Glavić and Bartulović2005; Niang et al., Reference Niang, Pessanha and Araújo2010; Palmeira & Monteiro-Neto, Reference Palmeira and Monteiro-Neto2010; Battaglia et al., Reference Battaglia, Pedà, Musolino, Esposito, Andaloro and Romeo2016; Vaske-Junior et al., Reference Vaske-Junior, Viliod and Knoeller2018). Pompano juveniles caught at Guanabara Bay's sandy beaches display a similar trophic pattern, as T. carolinus fed mostly on the brown mussel Perna perna, while also preying upon the mole crab Emerita brasiliensis. This crustacean was also the most important item consumed by T. goodei juveniles, particularly those from size group 3, which may reveal a potential size-related competitive advantage in relation to its congener, T. carolinus. Crustacean prey such as the mole crab are difficult to handle and ingest (Juanes et al., Reference Juanes, Buckel and Scharf2001) due to their mobility and other behavioural characteristics, such as burying themselves in the sand (Veas et al., Reference Veas, Hernández-Miranda and Quiñones2014), leading to high energetic expenditure by predators with poorly developed morphological traits. These traits are enhanced as fish increase in size, improving their foraging ability (Aarnio et al., Reference Aarnio, Bonsdorff and Rosenback1996; Elliott et al., Reference Elliott, Hemingway, Costello, Duhamed, Hostens, Labropoulou, Marshall, Winkler, Elliott and Hemingway2002), which may have thus favoured E. brasiliensis exploitation by T. goodei, since this species encompassed the largest juveniles in the sample assessed herein. A graphical analysis of the pompano's feeding strategy also supports this hypothesis, as it revealed that T. goodei fed more frequently on E. brasiliensis in comparison to T. carolinus, which displayed an opportunistic behaviour, with only a few fish recording a high mole crab prey-specific weight (PSW%). In contrast, T. carolinus juveniles displayed a preference (i.e. high PSW%) for the bivalve P. perna, which is sessile and attaches to hard substratum (Erlandsson et al., Reference Erlandsson, McQuaid and Kostylev2005), mostly consumed by fish belonging to size group 2.
Ontogenetic dietary shifts have been reported previously for marine fish (Palmeira & Monteiro-Neto, Reference Palmeira and Monteiro-Neto2010; Schückel et al., Reference Schückel, Sell, Kröncke and Reiss2012; Guedes et al., Reference Guedes, Araújo, Pessanha and Milagre2014; Vasconcellos et al., Reference Vasconcellos, Gomes-Gonçalves, Santos, Cruz Filho and Araújo2018), related not only to the establishment of preferential, larger and more energetic prey (Aarnio et al., Reference Aarnio, Bonsdorff and Rosenback1996; Elliott et al., Reference Elliott, Hemingway, Costello, Duhamed, Hostens, Labropoulou, Marshall, Winkler, Elliott and Hemingway2002), but also to avoid intra- and interspecific niche overlapping (Day et al., Reference Day, Hall, Kemp, Yáñez-Arancibia, Day, Hall, Kemp and Yáñez-Arancibia1989; Platell et al., Reference Platell, Sarre and Potter1997; Guedes et al., Reference Guedes, Araújo, Pessanha and Milagre2014). The pompano results reported herein seem to agree with this trophic pattern, as small juveniles fed on annelids, insects and algae, switching to macrocrustaceans, molluscs and fish as they grew into subadults, partially matching previous findings (Armitage & Alevison, Reference Armitage and Alevison1980; Niang et al., Reference Niang, Pessanha and Araújo2010; Palmeira & Monteiro-Neto, Reference Palmeira and Monteiro-Neto2010). These dietary changes were also correlated to fish body size, revealing a shift from sharing to partitioning of feeding resources by the investigated Trachinotus species. Fish belonging to size groups 1 and 2 fed on secondary items such as Chaetomorpha anteninna, Ulva linza, Formicidae and other insects, which may explain the marginally significant trend towards resource sharing detected by the null-model analysis. The ingestion of non-preferred trophic items such as those previously mentioned may be an outcome of interspecific competition, as individuals would reduce their use of preferential prey by feeding on previously ignored resources, leading to an increase in niche breadth (Piet et al., Reference Piet, Pet, Guruge, Vijverberg and Van Densen1999). In contrast to juveniles belonging to size groups 1 and 2, pompano within size group 3, represented exclusively by T. goodei, displayed little dietary overlap with T. carolinus juveniles (Figure 8), while also recording the lowest vacuity values. These findings suggest that the significant size difference detected between the evaluated Trachinotus species may be important to avoid competitive exclusion amongst congeners, as previously reported for other marine species (Schückel et al., Reference Schückel, Sell, Kröncke and Reiss2012; Amariles et al., Reference Amariles, Navia and Giraldo2017; Vasconcellos et al., Reference Vasconcellos, Gomes-Gonçalves, Santos, Cruz Filho and Araújo2018).
Dissimilarities in fish size are related to trophic niche expansion and reduced intra- and interspecific competition (Werner & Gilliam, Reference Werner and Gilliam1984; Vasconcellos et al., Reference Vasconcellos, Gomes-Gonçalves, Santos, Cruz Filho and Araújo2018; Andrade-Tubino et al., Reference Andrade-Tubino, Milagre and Araújo2019). Smaller fish have a faster metabolism and require more frequent feeding than larger ones, displaying a trend towards generalist behaviour in contrast to the latter, which usually exhibit higher levels of prey selectivity (Aarnio et al., Reference Aarnio, Bonsdorff and Rosenback1996; Elliott et al., Reference Elliott, Hemingway, Costello, Duhamed, Hostens, Labropoulou, Marshall, Winkler, Elliott and Hemingway2002; Andrade-Tubino et al., Reference Andrade-Tubino, Milagre and Araújo2019). Such distinct behaviour not only prevents the exploitation of similar resources by two or more species, but also increases the niche breadth of the entire population while reducing overlap between conspecifics (Schoener, Reference Schoener1971; Wootton, Reference Wootton1990; Andrade-Tubino et al., Reference Andrade-Tubino, Milagre and Araújo2019). In the present study, intraspecific partitioning was detected between juveniles belonging to size groups 1 and 2 of each Trachinotus species (Figures 7 & 8). Insects from the Formicidae family were mostly consumed by pompano juveniles in size group 1, while individuals from size group 2 fed mostly on the algae U. linza and U. fasciata, molluscs, annelids and other insects such as Blattaria, Diptera, Coleoptera and Lepidoptera. The cluster analysis applied to dietary data further revealed dietary partitioning between the juveniles within each of these size groups (Figure 7), in accordance with the generalist-opportunistic behaviour reported for Trachinotus species (Niang et al., Reference Niang, Pessanha and Araújo2010). The first dietary algae record for T. carolinus and T. goodei may be specifically related to their feeding strategy, as this resource is highly available on the sampled beaches (Souza et al., Reference Souza, Santos and Santos2018).
Despite the low number of stomachs with identifiable food content sampled, the reported data still account for a high percentage of the total prey diversity expected for pompano juveniles, as revealed by coverage-based R/E curves (Figure 4). However, the higher number of empty stomachs recorded for T. carolinus may reveal the importance of size in the trophic dynamics within this population. The Florida pompano was more abundant than its congener in the investigated beach system, but most juveniles belonged to size group 1, with the highest vacuity among young fish. Individuals with similar body size may not be able to coexist, as they would significantly overlap shared resources (Pianka, Reference Pianka1974; Wootton, Reference Wootton1990), which may, at least partially, explain the high vacuity observed for the smallest T. carolinus juveniles. Although adopting an opportunistic behaviour may aid in reducing competition amongst its conspecifics (Piet et al., Reference Piet, Pet, Guruge, Vijverberg and Van Densen1999; Bolnick et al., Reference Bolnick, Svanback, Fordyce, Yang, Davis, Hulsey and Forister2003), the trophic overlapping with smaller T. goodei may create an extra pressure for T. carolinus to overcome. High trophic overlap values are often used to imply shared resource utilization and lack of competition, but it is also possible that they may reveal strong competition that has not yet led to resource use segregation by two or more species (Gotelli & Graves, Reference Gotelli and Graves1996). Therefore, the higher vacuity recorded for smallest fish may provide additional evidence concerning the size ratio null-model results, which revealed a greater size difference between Trachinotus species juveniles than expected (i.e. critical minimum ratio) to enable their coexistence.
The high vacuity of the sampled specimens could also be related to feeding time and physiology concerning rapid digestion, but we do not believe these to be the main cause of the reported results. Pompano species have been reported as feeding primarily during day hours (Armitage & Alevison, Reference Armitage and Alevison1980; Batistic et al., Reference Batistić, Tutman, Bojanić, Skaramuca, Kŏzul, Glavić and Bartulović2005), i.e. the same sampling hours as the campaigns carried out herein, and were thus expected to show a high degree of fullness. Moreover, Trachinotus species have a Y-shaped stomach, which is associated with greater food retention in comparison to simpler anatomies (Ehemann et al., Reference Ehemann, Abitia-Cardenas, Navia, Mejía-Falla and Cruz-Escalona2019).
In conclusion, the results reported in the present study indicate that fish size influences both intra- and interspecific Trachinotus juvenile trophic partitioning, potentially aiding species local coexistence. Interspecific overlapping was recorded for juveniles belonging to size groups 1 and 2, which fed on non-preferred trophic items, whereas larger fish (i.e. size group 3), represented exclusively by T. goodei, displayed a dietary separation from young T. carolinus individuals, feeding mainly on the mole crab E. brasiliensis. Size also seems to play an important role within the population of each Trachinotus species, as intraspecific dietary partitioning was observed especially between small- and medium-sized juveniles (i.e. groups 1 and 2). These feeding strategies may have a positive effect on competitive pressure at both the intra- and interspecific level, by preventing intensive resource exploitation by Trachinotus juveniles. This study contributes to the advancement of knowledge on intra- and interspecific trophic interactions, and the potential co-evolutionary strategies adopted by species to reduce competition and facilitate coexistence. However, further studies addressing a larger range of body sizes and other morphological features related to feeding, such as mouth height and width, among others, should be performed in order to strengthen the patterns found in this research.
Supplementary material
The supplementary material for this article can be found at https://doi.org/10.1017/S0025315420000545.
Acknowledgements
The authors thank the Laboratory of Theoretical and Applied Ichthyology (LICTA) and the Federal University of the State of Rio de Janeiro (UNIRIO) for providing logistic support. We especially thank Prof. Dr Joel Campos de Paula, Prof. Dr Elidiomar Ribeiro da Silva and Prof. Dr Valeria Gomes Veloso (in memoriam), from the Federal University of the State of Rio de Janeiro (UNIRIO) Biosciences Institute (IBIO) for assisting in the identification of the trophic items and categories consumed by the pompano species in the present study. We are also grateful to Dr Rachel Ann Hauser-Davis for reviewing the manuscript and improving the use of British English.
Financial support
This work was funded by Fundação Carlos Chagas Filho de Amparo à Pesquisa do Estado do Rio de Janeiro, Brazil (research grant to L.N.S., E-26/111.548/2010), Federal University of the State of Rio de Janeiro (UNIRIO) and National Council for Scientific and Technological Development (CNPq), Brazil (Research Grant to L.N.S., ref. 314379/2018-5) (Programa PELD e Guanabara) (undergraduate scholarship to J.S.S).