In the late nineteenth and early twentieth centuries, the Mexican population in the United States increased more than fivefold (Gratton and Gutmann Reference Gratton and Gutmann2000). This influx raised concerns over whether Mexican immigrants and their descendants would assimilate (e.g., Foerster Reference Foerster1925; Jenks and Lauck 1911, p. 211). This is a familiar fear today, but the historical environment may have been particularly advantageous for Mexican and Mexican American outcomes compared with the modern environment: Wage inequality after 1915 was falling, the penalty for a lack of English fluency was small, and undocumented entry was not criminalized until 1929 (Goldin and Katz Reference Goldin and Katz2008, ch. 2; Gratton and Merchant 2015; Ngai Reference Ngai2003; Perlman 2005; Ward Reference Ward2020a). On the other hand, there were significant barriers to historical progress since Mexican Americans were “legally white but functionally nonwhite” (Benton-Cohen Reference Benton-Cohen2011, p. 33). “Mexican” was even its own racial category in the 1930 Census, a division never created for European source countries. Due to structural barriers, intergenerational mobility for Mexican Americans may have been more similar to Black mobility than to non-Mexican white mobility.
In this paper, we ask whether Mexican immigrants and their descendants caught up to non-Mexican white outcomes across multiple generations. To answer this question, we use repeated cross sections to track the outcomes of subsequent generations between 1880, 1910, and 1940. We then uncover the mechanisms behind generational convergence (or the lack thereof) with linked data between fathers and sons. In particular, we measure the importance of childhood characteristics, including the father’s status, for explaining gaps across Mexican Americans and non-Mexican whites.
The complete-count censuses provide many benefits over previously available samples. First, the data include more observations, which is important for measuring the outcomes of a small but rapidly growing population. Second, we can measure intergenerational mobility by linking censuses, which is key for understanding why Mexicans lagged or converged to non-Mexican white or Black outcomes (e.g., Collins and Wanamaker 2017; Hertz Reference Hertz, Bowles and Gintis2005; Chetty et al. Reference Chetty, Hendren, Jones and Porter2020). Linking provides an additional benefit: the ability to observe higher-order generations. Assimilation studies typically directly observe only the first and second generations (Smith Reference Smith2003; Gratton and Merchant 2015), but we can go further since we observe grandparental birthplace during childhood and then link children forward to their adult outcomes.Footnote 1 Linking further allows us to measure educational disparities for the great-grandchildren of Mexican immigrants. Overall, the richness of the data provides the most complete picture of historical Mexican American progress to date.
We find that Mexican immigrants and their descendants consistently lagged non-Mexican whites across three generations. After imputing income based on occupation, race/ethnicity, and region of residence, we estimate that first-generation Mexicans in 1880 had a 47 percent deficit relative to non-Mexican whites; 60 years later in 1940, third-generation Mexicans also had a 47 percent deficit. That is, we find zero generational convergence. However, after analyzing the occupational distributions behind the income scores, we do find convergence in farming and unskilled occupational categories, but not in white-collar or semi-skilled categories. Nevertheless, we find a sizable educational deficit for the great-grandchildren of Mexican immigrants in the 1940 Census, suggesting that income score gaps persisted beyond the third generation.
A lack of convergence could be due to growing up in poorer households or because Mexicans faced additional barriers to progress. Turning to the intergenerational data, we find that relatively worse outcomes were not solely due to growing up in poorer households; rather, Mexican Americans were less likely to escape from the bottom of the economic distribution. Estimates from rank–rank regressions show that conditional on the father’s rank, Mexican Americans ended up about 13–23 percentiles lower than non-Mexican whites. Due to this mobility gap, the results suggest that Mexican Americans would persistently lag non-Mexican whites in the long run (Chetty et al. Reference Chetty, Hendren, Jones and Porter2020). However, this gap could have closed over time due to the reduction of structural barriers over the twentieth century.
A potential explanation for limited convergence is that Mexican Americans were raised in different areas than non-Mexican whites, which had different environments in terms of schooling, health, or crime (Chetty and Hendren 2018a; Reference Chetty and Hendren2018b). Using the linked data from childhood to adulthood, we decompose the economic gap between Mexican Americans and non-Mexican whites; in particular, we compare those who grew up in the same childhood neighborhood in 1910 (as proxied by enumeration district). Accounting for childhood characteristics explains only a small part of the gap, leaving a large deficit for Mexican Americans compared to non-Mexican whites raised in the same neighborhood. The results suggest that there were additional unobserved barriers to progress beyond father’s status and neighborhood effects, such as labor market discrimination or pre–labor market discrimination (e.g., attending different quality schools).
We contribute to the literature on how across-generation assimilation has changed over time (e.g., Abramitzky, Boustan, and Eriksson Reference Abramitzky, Boustan and Eriksson2020; Borjas Reference Borjas1994; Card, DiNardo, and Estes Reference Card, DiNardo, Estes and George2000; Perlmann Reference Perlmann2005; Smith Reference Smith2006).Footnote 2 Note that this literature and our paper take an intergenerational perspective of assimilation, which differs from the traditional focus on first-generation assimilation (e.g., Abramitzky, Platt Boustan, and Eriksson 2014; Borjas Reference Borjas2015; Collins and Zimran 2019a; Hatton Reference Hatton2000; Minns Reference Minns2000). When using imputed income over time, we show with repeated cross sections that Mexican American generational progress is more rapid today than 100 years ago. This result is consistent with us finding a negative mobility gap for Mexicans in the past and Abramitzky et al. (Reference Abramitzky, Boustan, Jácome and Pérez2019) finding a positive mobility gap for Mexicans in the present. We also show that third-generation Mexican Americans had smaller gaps in wage income (for wage workers) and education in 2000 than in 1940. Therefore, it appears that the generational progress of Mexican Americans has improved substantially over time, perhaps due to gains in civil rights and the reduction of structural barriers in schooling and the labor market following WWII.
Our results also contribute to the literature on Mexican American progress, which aims to measure higher-order generation outcomes in a precise way (e.g., Duncan and Trejo Reference Duncan and Trejo2011; Duncan et al. Reference Duncan, Grogger, Leon and Trejo2020). Other historical research on generational progress must identify higher-order Mexicans with indirect methods, such as whether one has a Spanish-sounding surname or self-identifies as having Mexican ancestry (e.g., Borjas Reference Borjas1994; Smith Reference Smith2003; Smith Reference Smith2006). We show that indirect methods only identify half of the third generation with a Mexico-born grandparent. Further, indirect methods only capture a select group of lower skilled third-generation Mexicans. Therefore, using indirect methods to identify higher-order Hispanics in the pre-1980 data, much like the Hispanic self-identifier today, provides an incomplete picture of Mexican American progress in the past (Duncan and Trejo 2007; Reference Duncan and Trejo2011). Future research should be cautious when using indirect methods prior to 1980.
Finally, we contribute to the literature on intergenerational mobility gaps across groups, whether based on race/ethnicity or based on the immigration status of the parents (e.g., Collins and Wanamaker 2017; Hertz Reference Hertz, Bowles and Gintis2005; Mazumder 2014; Reference Davis and MazumderDavis and Mazumder 2018; Chetty et al. Reference Chetty, Hendren, Jones and Porter2020). In a related historical paper on Europeans, Abramitzky et al. (Reference Abramitzky, Boustan, Jácome and Pérez2019) estimate mobility gaps across sons of immigrants and natives and find that almost all European groups were more upwardly mobile than native-born whites.Footnote 3 Our results stand in contrast by showing that Mexicans experienced a significant mobility deficit relative to non-Mexican whites; that is, a second-generational advantage was not uniform across all sources. Instead, it appears that Mexican American mobility was more like that of African Americans, which is consistent with Mexican Americans facing substantial structural barriers to progress in the late nineteenth and early twentieth centuries.
HISTORICAL BACKGROUND
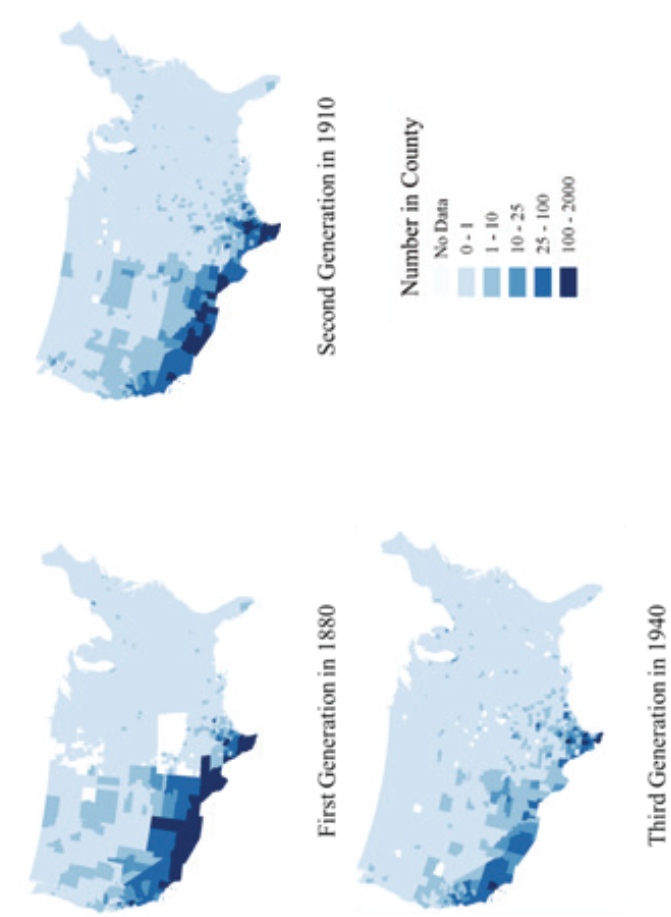
The Mexican-born population we consider in this study, from the middle of the nineteenth century through around 1910, was increasing at a fast rate (Borjas and Katz 2007; Clark Reference Clark1908; Escamilla-Guerrero Reference Escamilla-Guerrero2018; Gratton and Merchant 2016).Footnote 4 With the end of the Mexican–American War and the signing of the Treaty of Guadalupe Hidalgo in 1848, large portions of Mexican territory were ceded to the United States, which created a new group of residents who did not cross a border themselves but had the border cross them.Footnote 5 Then, better transportation with the expansion of the railroad in Mexico, relatively higher wages in the American Southwest (much of it newly acquired territory), and political turmoil in Mexico associated with the Mexican Revolution caused the Mexican-born population in the United States to grow rapidly into the 1920s. By 1930, there were about 1.2 million first- and second-generation Mexicans in the United States, comparable to the Norwegian and Swedish populations. However, the Mexican experience was fundamentally different from the European one in that most Mexicans lived closed to the Southern border rather than in the Northeast or Midwest (Figure 1).
PERSISTENCE OF LOCATION IN THE AMERICAN SOUTHWEST ACROSS THREE GENERATIONS
Notes: Population is 30- to 44-year-old males. The first generation are those born in Mexico, the second generation are U.S. born to at least one Mexican-born parent, and the third generation are U.S. born to two U.S.-born parents and have at least one Mexican-born grandparent.
Sources: 1880 and 1910 full-count censuses and 1910–1940 linked samples (Ruggles et al. Reference Ruggles, Flood, Goeken, Grover and Meyer2019).

While European descendants experienced upward mobility relative to U.S.-born whites (Abramitzky et al. Reference Abramitzky, Boustan, Jácome and Pérez2019; Collins and Zimran 2019b), Mexican immigrants and their descendants faced additional barriers to progress (Fox and Guglielmo Reference Fox and Guglielmo2012). The working conditions for the first generation were poor, such that they likely limited investment in the next generation. For instance, employers paid Mexican workers lower wages for the same jobs relative to other workers, which could lead to lower investments in health and education in the immigrants’ children (Gratton and Merchant 2015). Further, migrants lived in segregated communities (e.g., migrant labor camps on large-scale farms) that had a poor nutrition and disease environment for children; indeed, Mexican American infant mortality rates were much higher than non-Mexican white mortality rates (Gratton and Merchant 2016). Many children also worked alongside the migrant workers, despite compulsory schooling and child labor laws, which may have limited their investments in education.
Mexican immigrants and their descendants were also likely to be limited by discrimination in society more generally. For example, a 1925 Department of Labor report explicitly stated that Latin Americans do “not attain the race value of the white stocks, and therefore immigrants from these countries tend to lower the average of the race value of the white population of the United States” (Foerster Reference Foerster1925, p. 57). This view led many to call for the exclusion of Mexican Americans from citizenship based on the argument that Hispanics were neither white nor Black (Padilla Reference Padilla1980). While Mexican Americans’ right to citizenship was upheld in the 1897 In Re Rodriguez case, this did not halt the racialization of Mexican Americans. For instance, the 1930 Census is the only one in American history that has Mexican as a separate racial category—a category later removed due to legal ramifications of being non-white and non-Black. Despite the de jure classification that Mexican Americans were white, they experienced de facto treatment as if they were non-white (Gross Reference Gross2006). Mexican Americans faced segregated schools, lynchings, exclusion from so-called “sundown towns,” debt peonage tying them to company towns, restrictions from voting and juries, and segregated public accommodations (Carrigan and Webb 2003; Gross Reference Gross2006).Footnote 6 The infamous “Whites Only” signs also appeared in parts of Texas and California, applying to both African and Mexican Americans. The early welfare state was less accessible to Mexican than to European immigrants since citizenship restrictions were more severe in the American Southwest; indeed, there is evidence that some Mexican immigrants were deported for asking for public assistance (Fox Reference Fox2012). The Great Depression also led to many deportations of first- and second-generation Mexican Americans, while European immigrants were not deported (Lee, Peri, and Yasenov 2017).
After WWII, Mexican Americans gained more political power and civil rights protections to reduce the discrimination they faced in the labor market and society in general. The first time a federal court ruled against segregated schools was for Mexican Americans in Mendez v. Westminster in 1947, rather than the more famous Brown v. Board of Education decision seven years later (Gross Reference Gross2006). Further, the Supreme Court case of Hernandez v. Texas in 1954 granted Mexican Americans equal protection under the 14th Amendment. The Mexican American civil rights movement grew following the 1950s, similar in timing to the Black civil rights movement, although it took a 1975 amendment to the Voting Rights Act of 1965 to expand protections to the Mexican American minority and guarantee bilingual elections in areas with a large language minority population (Hunter Reference Hunter1975). Despite some gains in civil rights, there remains a sizable education and income gap between third-generation Mexican and non-Mexican white Americans in recent decades (Duncan et al. Reference Duncan, Grogger, Leon and Trejo2020; Smith Reference Smith2003).Footnote 7 This paper, however, will focus on Mexican American progress before 1940, that is, before these advances in civil rights and the reduction of some of the discriminatory barriers to progress.
DATA FROM THE EARLY TWENTIETH CENTURY
We use the 1880, 1910, and 1940 full-count U.S. Censuses to estimate the generational progress of the Mexican-origin population prior to WWII (Ruggles et al. Reference Ruggles, Flood, Goeken, Grover and Meyer2019).Footnote 8 We compare Mexican-origin outcomes with non-Mexican Black and white individuals who are U.S. born. Individuals are assigned to discrete groups such that if one is Mexican and Black or white, we place them only in the Mexican group. Our population is of 30- to 44-year-old males with reported occupations.
The main difficulty with estimating generational progress is that standard data only observe the first and second generations, which leaves outcomes beyond the second generation unknown. To observe the third generation, we use the 1910 Census’s questions on parental birthplaces to identify the grandparental birthplace for children of intact households. We define a third-generation Mexican as having one Mexico-born grandparent and two U.S.-born parents. We then link 0- to 14-year-old sons in 1910 forward to the 1940 Census based on name, race, year of birth, and state of birth.Footnote 9 With this data structure, we can observe first-generation outcomes in 1880, second-generation outcomes in 1910, and third-generation outcomes in 1940.
Besides the generational progress of the first generation in 1880 to the third generation in 1940, we also include a second cohort of first-generation Mexicans in 1910 and second-generation Mexicans in 1940. The advantage of this cohort is that it covers a larger population since many Mexicans arrived between 1880 and 1910, and therefore it provides a more complete picture of Mexican progress. It also avoids the problem with most of the 1880 first-generation cohort being born prior to the Treaty of Guadalupe Hidalgo in 1848; that is, it is possible that some of the first generation in 1880 crossed the modern-day border and that some were long-term residents who had the border cross them. However, we will find similar assimilation patterns for the 1880 and 1910 cohorts, and so much of our focus remains on three-generational outcomes between 1880 and 1940.
We use a mix of hand-linking and machine-learning methods to create our linked samples. First, we hand link the entire group of third-generation Mexican Americans. The main benefit of hand linking is that the match rates increase, which is important because the third-generation Mexican population is relatively small. The other groups (non-Mexican white and Black and second-generation Mexican Americans) are too large and costly to hand link, so we instead use the Feigenbaum (Reference Feigenbaum2016) method, where we hand link a subset and then use a probit model to predict links for the entire census. One may be concerned that we use different linking methodologies for different groups, but we will show that the results are robust when using a machine-learning methodology for third-generation Mexican Americans.Footnote 10 More detail on linking is provided in Appendix B.
We successfully forward link 31.5 percent of third-generation Mexican Americans, 14 percent of second-generation Mexican Americans, 11.9 percent of non-Mexican Black Americans, and 29.8 percent of non-Mexican white Americans. Discrepancies in linking rates are due to differential mortality between censuses, under-enumeration, errors in the underlying data, and matches not being of sufficiently high probability or uniqueness to be included in the data set. These linking rates lead to a sample of 5,088 third-generation Mexican American sons in 1940, 5,381 second-generation Mexican sons in 1940, 161,764 African Americans, and 3,235,260 non-Mexican white Americans. We weight the sample using the method described by Bailey et al. (Reference Bailey2019), where we predict the probability of being linked based on observable characteristics and then weight based on the inverse probability (see Online Appendix Table B5).
One limitation of the data is that income is unobserved, so we cannot estimate a traditional measure of income assimilation. Instead, we estimate the convergence of occupational categories or income scores. The advantage of an income score is that it provides a single measure of the gap between Mexican and non-Mexican white Americans. To create an income score, we follow the approach of Collins and Wanamaker (2017) and estimate income based on occupation, region, and racial/ethnic group (i.e., whether non-Mexican Black, non-Mexican white, or Mexican American). Estimated income is primarily based on the wage income data from the 1940 Census and is essentially the average wage income for wage workers in each occupational, region, and race/ethnicity cell.Footnote 11 Also following Collins and Wanamaker (2017), we estimate self-employed earnings based off of information in the 1960 Census, and further increase farmer and farm laborer income to reflect in-kind benefits (see Online Appendix C). In addition to these imputed income scores, we find it valuable to also look directly at occupational categories that do not rely on the assumptions we make in the calculation of the income scores and that will not suffer from some of the documented issues with using occupation-based income scores (Saavedra and Twinam Reference Saavedra and Twinam2019; Inwood, Minns, and Summerfield Reference Inwood, Minns and Summerfield2019).
MEXICAN AMERICAN ADVANCE: EVIDENCE FROM STACKED CROSS SECTIONS
Cross-Sectional Evidence of Generational Progress
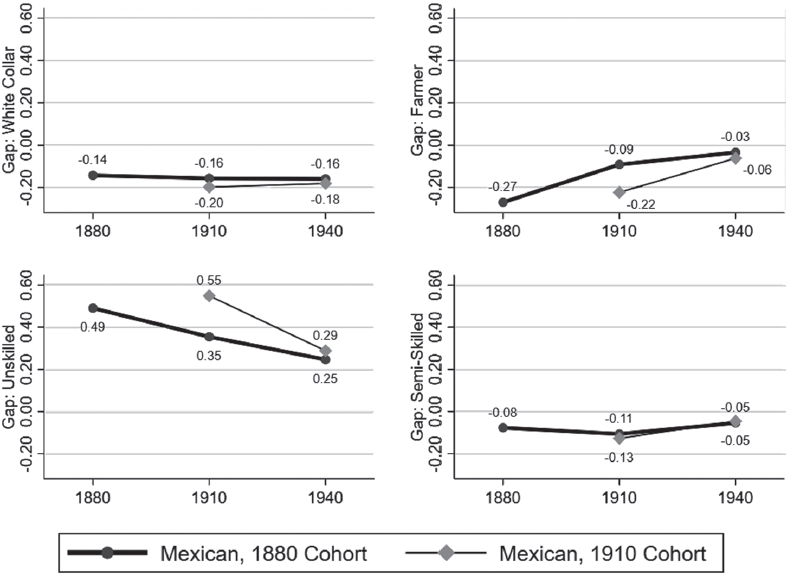
Figure 2 shows that the occupational gaps between first-generation Mexicans and non-Mexican whites were large. The widest gap was for unskilled work, where immigrants in 1880 were 49 percentage points, or 169 percent, more likely to hold an unskilled job (78 vs. 29 percent). Note that unskilled work includes farm laborers, an occupation that Mexican immigrants frequently held. This positive gap for unskilled work contrasts with a negative gap for white-collar (–14), farmer (–27), and semi-skilled work (–8). These wide gaps for the 1880 cohort were similar in direction and magnitude for the 1910 cohort of first-generation immigrants.
OCCUPATIONAL CONVERGENCE ACROSS GENERATIONS BETWEEN 1880 AND 1940
Notes: Population is 30- to 44-year-old males who claim an occupation. The gap is measured relative to U.S.-born non-Mexican whites. The 1880 cohort follows the first generation in 1880, the second generation in 1910, and the third generation in 1940. The 1910 cohort follows the first generation in 1910 and the second generation in 1940.
Sources: 1880 and 1910 full-count censuses and 1910–1940 linked samples (Ruggles et al. Reference Ruggles, Flood, Goeken, Grover and Meyer2019).

The initial occupational gaps were strongly persistent across three generations for white-collar and semi-skilled work, but they were less persistent for unskilled and farming work.Footnote 12 For example, the white-collar gap increased from –14 percentage points in 1880 to –16 percentage points for the third generation in 1940. Therefore, it appears that the highest-skilled occupations were not accessible to many Mexican Americans who were U.S. born and had two U.S.-born parents. On the other hand, there was generational convergence in unskilled and farming work. For instance, the gap in unskilled work halved from 49 percentage points in the first generation to 25 percentage points in the third generation. A similar pattern held for the 1910 cohort.
Farming is the unique category where convergence was nearly complete across three generations. Convergence (from –27 to –3 percentage points) partially occurred because non-Mexican whites were trending toward zero, reflecting structural transformation between 1880 and 1940.Footnote 13 Mexicans also left farming across three generations but did so more slowly. For example, the percent of Mexican Americans who farmed dropped from 15 to 10 percent, while it dropped from 42 to 12 percent for non-Mexican whites. In fact, second-generation Mexicans entered farming (increasing from 15 to 21 percent), which led to substantial convergence between the first and second generations.Footnote 14 The difference in entering or exiting farming does not appear to be due to geography: If one controls for state, then the Mexican/non-Mexican white gap converged from 36 to 4 percentage points.Footnote 15
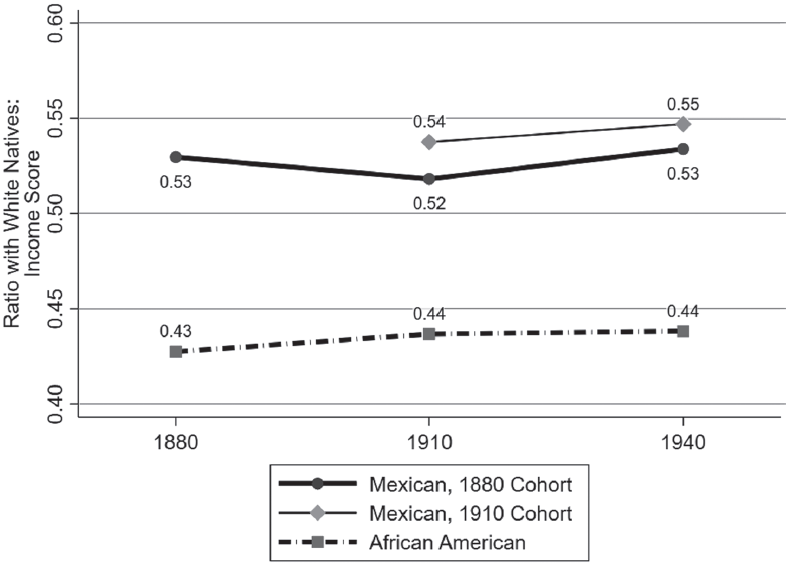
If one uses income scores instead of occupational categories, then there was zero convergence across three generations. Figure 3 shows that Mexican immigrants held jobs that paid 53 percent of non-Mexican white jobs in 1880, which dropped to 52 percent for the second generation in 1910 and returned to 53 percent in 1940. The subsequent cohort who entered by 1910 had a slightly smaller gap with non-Mexican whites (income ratio of 54 percent) but also did not converge toward non-Mexican whites by 1940 (ratio of 55 percent). The lack of convergence is surprising because not only was the second generation reared in the United States, but the third generation was raised by two parents who were raised in the American environment—an environment that benefited first- and second-generation Europeans (Alexander and Ward Reference Alexander and Ward2018; Abramitzky et al. Reference Abramitzky, Boustan, Jácome and Pérez2019; Collins and Zimran 2019b). Further, the second and third generations should have enjoyed the benefits of citizenship, though it is unclear whether these benefits were accessible to Mexican Americans (Catron Reference Catron2019).
SLOW GENERATIONAL CONVERGENCE IN INCOME SCORES BETWEEN 1880 AND 1940
Notes: Population is 30- to 44-year-old males who claim an occupation. Non-Mexican white Americans and African Americans are native born. The 1880 cohort follows the first generation in 1880, the second generation in 1910, and the third generation in 1940. The 1910 cohort follows the first generation in 1910 and the second generation in 1940. The income score is as discussed in Appendix C. See Table 2 for estimates after controlling for geography.
Sources: 1880 and 1910 full-count censuses and 1910-1940 linked samples (Ruggles et al. Reference Ruggles, Flood, Goeken, Grover and Meyer2019).

It is important to note that income scores could underestimate actual income convergence but also underestimate the actual income gap. For example, the income score methodology estimates zero convergence for African Americans and a 56 percent Black–white income score gap in 1940, which contrasts with the (small) per capita income convergence and larger 62 percent income gap estimated using a different methodology in Margo (Reference Margo2016). Looking instead at changes in the occupational distribution, there were some gains in occupational status at the lower end of the distribution, which is likely the result of structural transformation in the economy (Collins and Zimran 2019a).Footnote 16
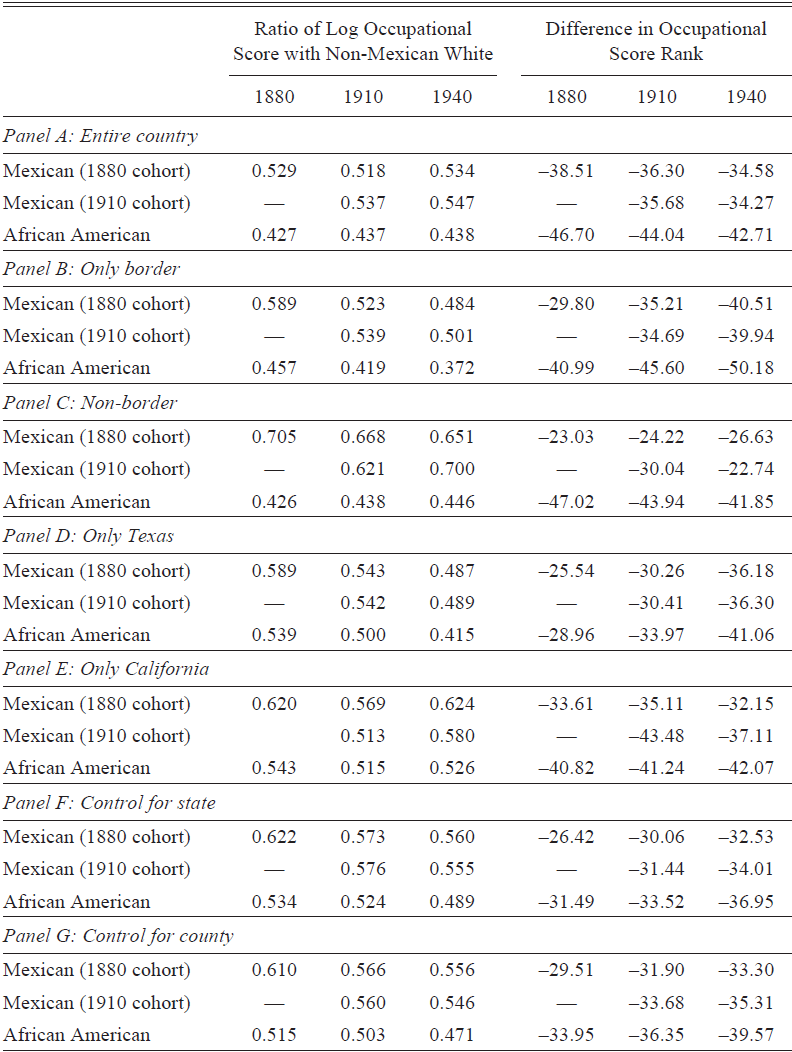
Differences in geographical location across Mexicans and non-Mexican whites do not explain the lack of income score convergence (see Table 1). In fact, there is often evidence for divergence after controlling for geographic location. For instance, the income score ratio dropped from 59 to 48 percent for those living in border states (Panel B) and from 71 to 65 percent for those living in non-border states (Panel C).Footnote 17 We also limit the sample to Texas and California (Panels D and E), given that California was at the forefront of educational expansion in the early twentieth century and speculation in the literature that barriers to progress were greater in Texas (del Castillo Reference del Castillo1985; Duncan et al. Reference Duncan, Grogger, Leon and Trejo2020). However, note that educational expansion in California might have left Mexican Americans behind if they were unable to attend higher quality schools. Indeed, the gap was smaller and generational progress was better in California since the ratio stagnated at 62 percent from the first to third generations. In contrast, the Texan income score ratio fell from 59 to 49 percent. In general, controlling for state or county of residence (Panels F and G) narrows the first-generation gap but lessens the assimilation rate.
MEXICAN AMERICAN GENERATIONAL PROGRESS IN INCOME SCORE AND RANKS

Notes: Target population is 30- to 44-year-old males who claim an occupation. Non-Mexican white and African Americans are native born; 1880 only includes first-generation Mexicans, 1910 only includes second-generation Mexican Americans, and 1940 only includes third-generation Mexican Americans. Standard errors are not reported since 1880 and 1910 data include population of 30- to 44-year-old males. See Table A1 for the number of observations for the entire country.
Sources: 1880 and 1910 full-count censuses and 1910–1940 linked samples (Ruggles et al. Reference Ruggles, Flood, Goeken, Grover and Meyer2019).
While there was little generational convergence, the children and grandchildren of Mexican immigrants were upwardly mobile in absolute terms. When measured with income scores, the third generation held jobs that earned 15 percent more than the first generation.Footnote 18 Alternatively, the proportion of workers in white-collar jobs more than quadrupled from 4 percent of the first generation to 15.5 percent of the third generation (see Online Table A1). However, since non-Mexican whites experienced similar gains, the gaps between the two groups persisted.
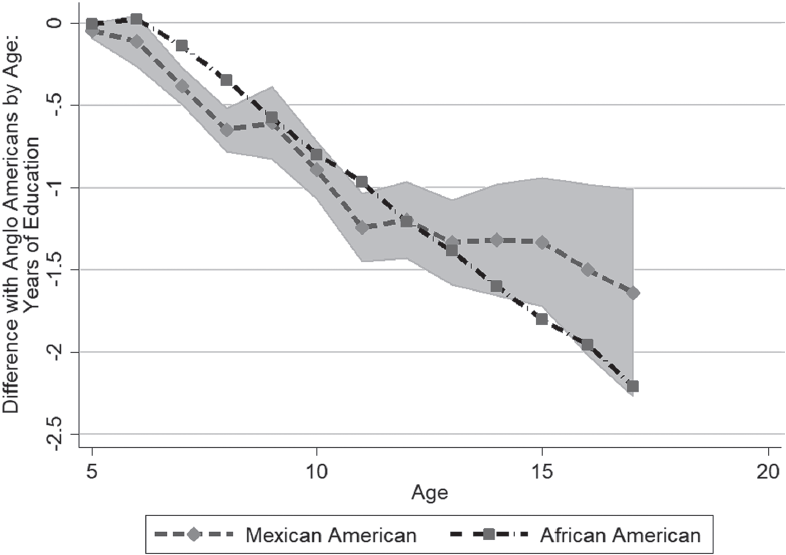
Was there convergence after the third generation? A unique feature of the data is that since we can observe children in the household, we can observe completed years of education for the great-grandchildren of first-generation immigrants (the “fourth generation”).Footnote 19 In Figure 4 we show that the non-Mexican white and Mexican education gaps were wide for the fourth generation. However, fourth-generation Mexican Americans had similar education levels as African Americans. As early as age 7, fourth-generation Mexican Americans received about 0.4 fewer years of education relative to non-Mexican white Americans. This gap grew constantly throughout childhood, and by age 17, the gap was 1.6 years. To the extent that differences in human capital caused wage disparities in adulthood, more research is needed on why Mexican American schooling attainment lagged non-Mexican white American attainment after four generations. Further, note that the historical 1.6-year gap is larger than the modern-day gap of 0.9 years for third-generation Mexicans (Duncan and Trejo Reference Duncan and Trejo2011), which provides the first hint that modern-day Mexican assimilation is faster than historical assimilation.
EDUCATIONAL GAPS PERSISTED FOR “FOURTH-GENERATION” MEXICAN AMERICANS IN 1940
Notes: The sample includes the children observed in the household from the 1910–1940 linked sample. The figure shows the simple differences in means of years of education across fourth-generation Mexican Americans, African Americans and non-Mexican white Americans. We refer to children of third-generation of Mexican American fathers as fourth-generation Mexican Americans, although we do not observe the grandparental birthplace on the maternal side. 95 percent confidence interval for Mexican Americans.
Sources: 1940 United States Census (Ruggles et al. Reference Ruggles, Flood, Goeken, Grover and Meyer2019)

Robustness
One limitation of the analysis so far is that the first generation includes potential return migrants. If return migrants were negatively selected, then we would estimate a generational assimilation profile that is too steep (Abramitzky, Platt Boustan, and Eriksson 2014).Footnote 20 Note that we already estimate a flat generational profile, so correcting for return migration is unlikely to overturn the result of “slow generational progress.” Nevertheless, in Online Figure A1, we provide alternative estimates to address return migration: limiting the sample to adults with children.Footnote 21 Single migrants returned at higher rates than families, so limiting the sample to fathers skews the sample to more permanent migrants (Greenwood and Ward 2015). After this sample limitation, we find the same flat assimilation profile, suggesting that return migration is not strongly biasing results. A more direct test can be done for the 1910 cohort since we can restrict the first generation to long-term stayers with the year of immigration variable, but this method also finds a similar assimilation profile.Footnote 22 Overall, we do not believe that selective return migration would overturn the result of slow generational convergence.
Another limitation arises from border changes following the Treaty of Guadalupe Hidalgo in 1848. Since the border changed, there is some ambiguity over whether those who claimed to be, for example, Californian born were actually of Mexican origin. One way to address this issue is to include those born in former Mexican territories in the Mexican group. The states that had some parts in Mexico were Arizona, California, Colorado, New Mexico, Nevada, Texas, Utah, and Wyoming.Footnote 23 Of course, individuals in these areas could have been American families who arrived prior to 1848 and, therefore, should not be included in the Mexican-origin group, especially in Texas.Footnote 24 Nevertheless, if one includes these states in the Mexican-origin group, then generational convergence was still slow (from 61 to 70 percent, see Online Figure A2). This method is a blunt and perhaps unsatisfying way to handle the border problem, so we make an alternative check: limiting the sample to those born after the 1848 Mexican Cession (30- to 31-year-olds in 1880). We continue to find no generational progress for this group, consistent with our main finding (see Online Figure A3). Finally, the border change problem does not exist for the second cohort of Mexico born in 1910, which also has slow generational progress between 1910 and 1940. Overall, we are confident that border changes do not alter our main result that Mexican-origin outcomes converged slowly toward non-Mexican white outcomes.
Bias from Pre-1980 Hispanic Identifier
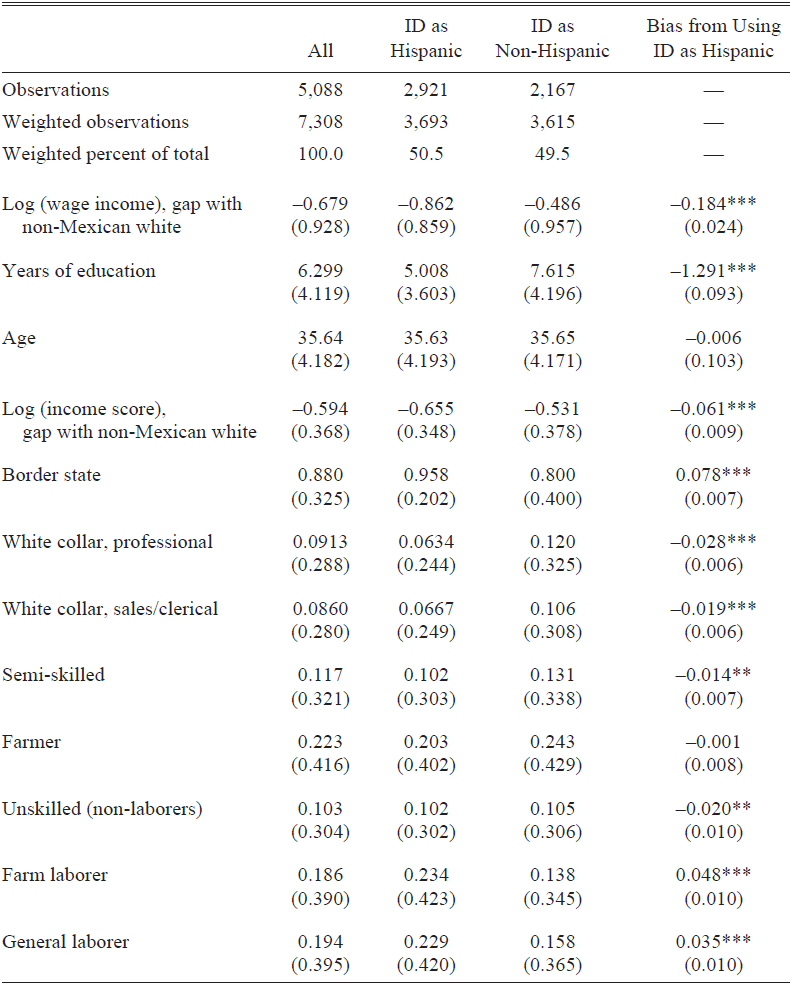
We can identify third-generation Mexican Americans by grandparent’s country of birth, which may serve as an improvement over an indirect way of identifying higher-order Mexican Americans. Prior to 1980, when the Hispanic self-identifier question was added to the Census, Hispanics were identified in IPUMS data based on a variety of rules discussed by Gratton and Gutmann (Reference Gratton and Gutmann2000) and primarily by whether one had a Spanish surname.Footnote 25 However, this strategy may miss descendants who lose Spanish surnames through the maternal line.Footnote 26 Since we have the IPUMS Hispanic identifier in our 1940 data, we can compare outcomes of the entire set of third-generation Mexican Americans (identified by grandparents’ country of birth) with those identified by the Hispanic variable.
In Table 2, we split our 1940 third-generation Mexican Americans into those who are identified as Hispanic versus those not identified as Hispanic by IPUMS. First, about 49.5 percent of our (weighted) third-generation Mexican Americans are not identified as Hispanic, indicating that the variable misses almost half of third-generation Mexican Americans. Second, there are large economic differences between the group that can be identified as Hispanic and the one that cannot. For example, the Hispanic identified have 5 years of education, while those non-identified have 7.6 years of education. The difference in log wage income for wage workers is similarly large, where those identified as Hispanics have 58 percent less wage income than non-Mexican whites and those not identified have 38 percent less. Part of the differences in outcomes between those identified and those not identified as Hispanic are due to where people lived; those identified as Hispanic were much more likely to live in a border state, perhaps because their father was more likely to be a descendant of Mexico (and have a Spanish-sounding surname).
BIAS IN THIRD-GENERATION OUTCOMES BASED ON THE PRE-1980 IPUMS HISPANIC IDENTIFIER

Notes: Data are of third-generation Mexican Americans. The column “ID as Hispanic” indicates the observation was identified as Hispanic according to the HISPAN variable at IPUMS. This variable lists one as Hispanic based on whether they or someone they were related to was born in Mexico, had a parent born in Mexico, or had a Spanish surname (see variable HISPRULE at IPUMS for more details). Log wage income is only measured for wage workers; the income score is based on the one discussed in Appendix C. Finally, years of education is missing for 53 individuals. *p < 0.1, **p < 0.05, ***p < 0.01.
Source: 1910–1940 linked sample (Ruggles et al. Reference Ruggles, Flood, Goeken, Grover and Meyer2019).
Introduction of bias from the pre-1980 Hispanic identifier is seen most clearly in the comparison of the two Table 2 columns: “ID as Hispanic” and “All.” Using the identifier will underestimate the average level of education for third-generation Mexican Americans by about 1.3 years. Additionally, estimates from our sample show that using the identifier will significantly overestimate the size of the wage income gap with non-Mexican white Americans. Since Reference SmithSmith (2003; Reference Smith2006) uses a similar way to identify Hispanics as the IPUMS identifier, this suggests that his estimates of third- and higher-order Mexican American outcomes using pre-1980 data are downwardly biased. Absent the more accurate identification of third-generation Mexican Americans in this paper, we would have incorrectly estimated that there was generational divergence for the Mexican-origin population. Thus, the analysis highlights how important it is to accurately identify the third generation of Mexican Americans in the pre-1980 data, just as it has been shown to be important for the post-1980 identifier (Duncan and Trejo 2007; Reference Duncan and Trejo2011).
MEXICAN AMERICAN UPWARD RANK MOBILITY: EVIDENCE FROM FATHER–SON LINKED DATA
Evidence of Generational Progress from Father–Son Linked Data
With the evidence so far, we document that Mexican generational progress in income scores was slow to non-existent. Now we turn to understanding why. It could be that slow convergence was due to an inheritance of poverty or to factors outside of the household, such as labor market discrimination or the quality of the neighborhood. Note that for this section, we pool second- and third-generation Mexican Americans together since they both had limited convergence and similar rates of intergenerational mobility (see Online Figure A4). Further, note that we will use the hand-linked version of the third-generation data since we cannot reject that the hand-linked slope is different from a data set that is created using the same machine-learning methods for the non-Mexican white and Black groups (see Online Figure A5).
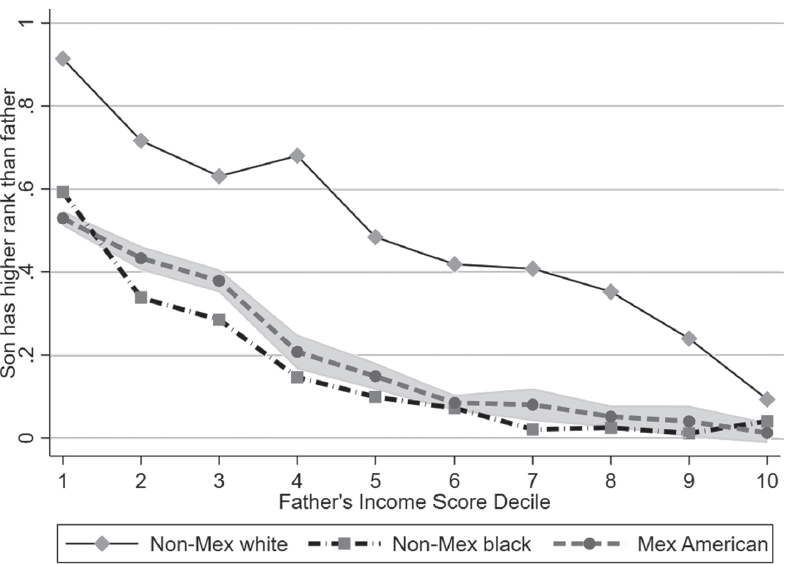
In Figure 5, we show that Mexican Americans were less likely to strictly improve on their father’s percentile rank than non-Mexican whites (Bhattacharya and Mazumder Reference Bhattacharya and Mazumder2011). About 91 percent of non-Mexican white Americans who grew up in the poorest decile improved on their father’s percentile rank, in contrast with 53 percent of Mexican Americans. Mexican Americans were less likely to improve on their father’s rank across all deciles, but note that most Mexican Americans were between the zero and 20th income score deciles (see percentile rank distributions in Figure A6). Interestingly, the poorest Mexican Americans appear to have an even lower rate of upward rank mobility than African Americans in the bottom decile (53 vs. 59 percent). Our results for African Americans are consistent with Collins and Wanamaker (2017), who provide more detail on the limited upward mobility of African Americans.
MEXICAN AMERICAN UPWARD RANK MOBILITY BETWEEN 1910 AND 1940
Notes: Income scores are estimated incomes based on occupation, region, and whether the son is non-Mexican white, Black, or Mexican American (either second or third generation). See Appendix B for more details. This figure plots the share of sons to have a strictly greater percentile rank than their father by the father’s decile in the income score distribution. 95 percent confidence intervals are shown. Only deciles with more than 30 people by group are plotted.
Source: 1910–1940 linked census sample (Ruggles et al. Reference Ruggles, Flood, Goeken, Grover and Meyer2019).

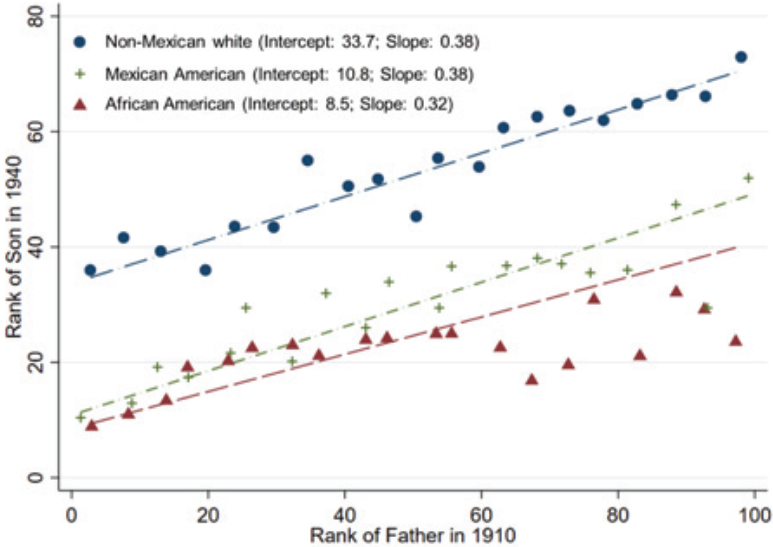
In Figure 6, we estimate the race/ethnic differences in rank–rank associations, which provide greater detail on where Mexican American sons ended up in the distribution. On average, Mexican Americans are predicted to end up 22.7 percentiles lower in the distribution, conditional on the father’s economic rank. This is a smaller gap than for African Americans, which is estimated at 25.7 percentiles. An alternative way of showing the same pattern is to use occupational categories; for example, Online Figure A7 shows that Mexican Americans were less likely to enter a professional job, conditional on the father’s category. Not only were Mexican Americans less upwardly mobile relative to non-Mexican whites, but Mexicans also were more downwardly mobile since they were more likely to enter an unskilled occupational category, conditional on the father’s category (Online Figure A8).
RANK-RANK MOBILITY BETWEEN 1910 AND 1940
Notes: Ranks are based on estimated income scores, as discussed in Appendix C. Mexican Americans are second- or third-generation sons.
Source: 1910–1940 linked census sample (Ruggles et al. Reference Ruggles, Flood, Goeken, Grover and Meyer2019).

Measurement error in the father’s economic status may bias intergenerational associations, so it may be that we are measuring mobility gaps with error (Solon Reference Solon1992; Ward Reference Ward2019).Footnote 27 One way to account for measurement error is to instrument one father observation with a second one under the assumption that the error components are uncorrelated (Modalsli and Vosters Reference Modalsli and Vosters2019).Footnote 28 We take this approach after linking the 1910 fathers to a second observation in 1920 and find that measurement error does not appear to drive the direction of the gaps. However, correcting for measurement error shrinks the magnitude of the gap from 23 to 13 percentiles (see Online Table D1). This pattern occurs because we are more accurately comparing poor non-Mexican white households to poor Mexican households. While the magnitude of the mobility gap may be subject to error, the more important result is the direction: given the father’s income score, Mexican American children ended up lower in the income score distribution.
A negative mobility gap for Mexican Americans contrasts a positive mobility gap found for nearly all European sources in Abramitzky et al. (Reference Abramitzky, Boustan, Jácome and Pérez2019).Footnote 29 The one exception for European sources is Norway, but the Norway gap (4 percentiles) was much smaller than the Mexico gap (23 percentiles when estimated in a similar way). Relatedly, Ward (Reference Ward2020b) estimates that about half of the occupational income gaps across source countries persisted from the first generation in 1880 to the third generation in 1940; however, we find zero convergence for Mexican Americans. Therefore, Mexico appears to be a unique source in the late nineteenth and early twentieth centuries, which experienced limited gains relative to Europeans and U.S.-born whites.
Understanding Why Mexican Americans Had Worse Outcomes Relative to Non-Mexican White Americans
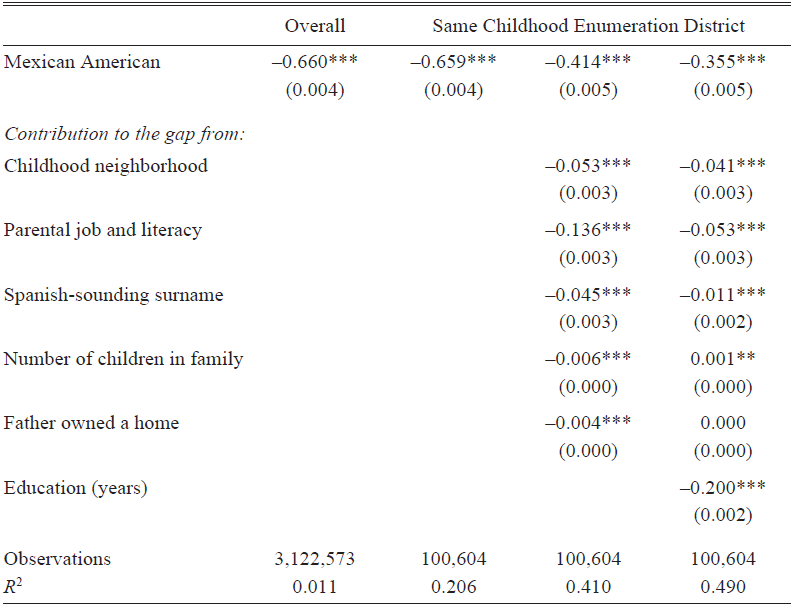
What factors outside of the father’s income score limited the upward mobility of Mexican Americans? In Table 3, we use the Gelbach (Reference Gelbach2016) decomposition to understand what mechanisms contributed to the Mexican/non-Mexican white gap. We are particularly interested in the importance of childhood environment since recent evidence suggests that neighborhood effects are important (Chetty and Hendren 2018a; Reference Chetty and Hendren2018b). Therefore, rather than focus on the gap for the entire population, we limit the sample to 1910 enumeration districts that have at least one non-Mexican white and one Mexican American son. This geographical restriction skews the sample toward the American Southwest, but the income score gap for children raised in these enumeration districts is the same as for the overall country (see the first and second columns in Table 3).
DECOMPOSING THE GAP BETWEEN NON-MEXICAN WHITE AND MEXICAN AMERICANS IN 1940

Notes: The dependent variable is the log income score. Mexican Americans are either second or third generation. The columns under “Same Childhood Enumeration District” limit the same to enumeration districts with at least one Mexican and one non-Mexican white American. Childhood neighborhood are indicators for childhood enumeration district. Parental job and literacy include father and mother’s log income score and literacy levels. *p < 0.1, **p < 0.05, ***p < 0.01.
Source: 1910–1940 linked samples (Ruggles et al. Reference Ruggles, Flood, Goeken, Grover and Meyer2019).
In the third column of Table 3, we estimate the importance of parental characteristics (father’s occupation, father’s literacy, and mother’s literacy), childhood enumeration district (with enumeration district fixed effects), having a Spanish-sounding surname, the number of children in the household, and homeownership (which is a proxy for wealth). After including these variables in the regression, the income score gap drops from 66 to 41 log points (or from 48 to 34 percent). The largest contributor to the gap is parental characteristics, which accounts for about half of the drop. Having a Spanish-sounding surname explains five log points, which may reflect labor market discrimination but also likely proxies for other unobservable characteristics. The full range of fixed effects for childhood enumeration district explains only five log points, less than parental characteristics, which is surprising given the evidence that childhood location matters for ethnic gaps (Abramitzky et al. Reference Abramitzky, Boustan, Jácome and Pérez2019; Alexander and Ward Reference Alexander and Ward2018; Ward Reference Ward2020b). It may be that other barriers to progress were strong enough that improvements to the childhood environment had a limited impact on upward mobility. The number of children in the household and homeownership also explain little of the gap.
We also control for education for interested readers; however, education is an outcome of the parental controls and neighborhood factors, so the interpretation of the estimated coefficient is tenuous. When including total years of education, Mexican Americans earned 36 log points less. The decomposition further suggests that most of the Mexican and non-Mexican white gap is due to educational differences. We prefer the results from the third column since education is endogenous to parental characteristics and childhood environment.
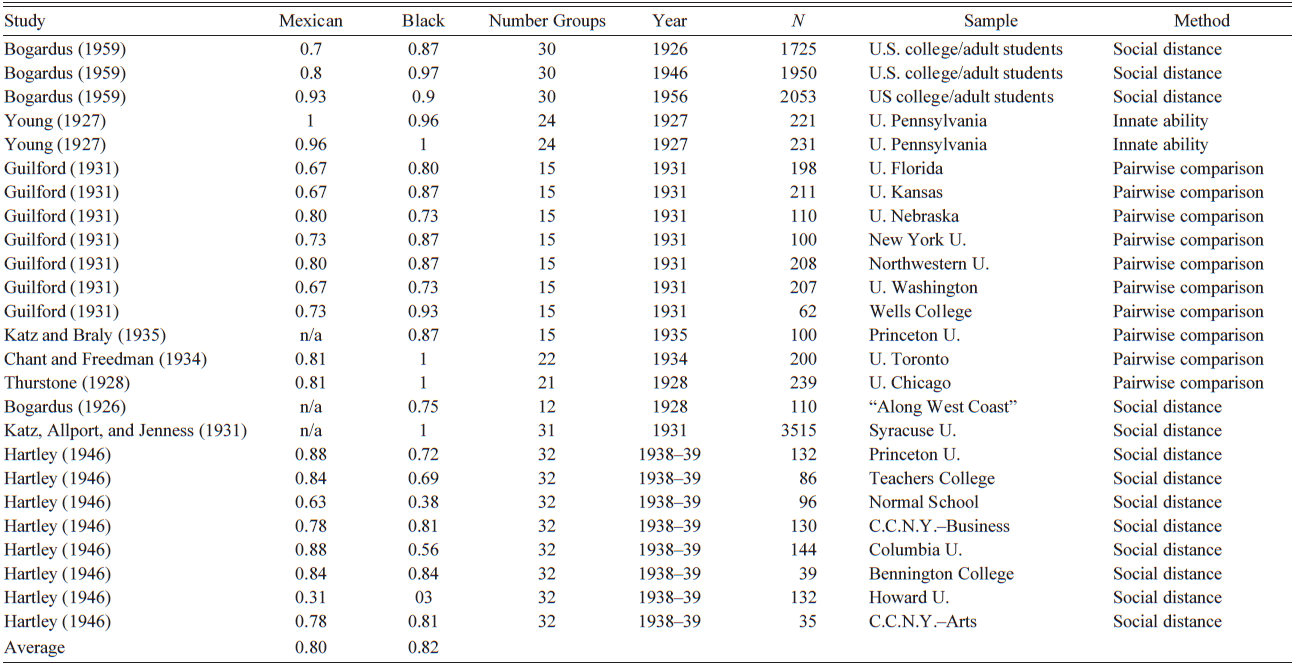
The residual 41 log point gap in the third column may be due to unobserved discrimination in the labor market. To provide a quantitative measure of discrimination, we follow the method discussed by Hilger (Reference Hilger2016) and construct measures of racist attitudes among whites using surveys from mostly college students between 1926 and 1956 (see Table 4). It is important to remember, however, that college students in the early twentieth century were not representative of the population in general. Nonetheless, information from these surveys can provide suggestive evidence. The resulting measures suggest that Mexicans were among the least favored race/ethnic group and faced a similar amount of prejudice as did African Americans. This result suggests that labor market discrimination might have contributed to poorer economic outcomes for Mexican Americans, but we cannot directly measure the effect in a regression.
MEASURES OF RACISM

Notes: This table follows the table in Hilger (Reference Hilger2016), presenting the rankings of racism toward Black and Mexican individuals. The scale goes from 0 (minimum prejudice) to 1 (maximum prejudice). Averages omit the rankings from New York U. because the sample was disproportionately Jewish-American, Howard University because the sample was disproportionately Black, and any studies where rankings were not available for Mexicans.
Sources: Shown in the first column of the table.
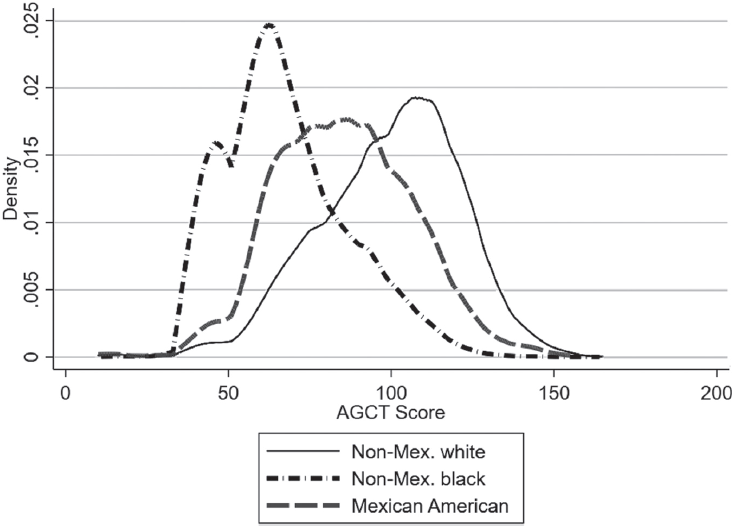
There are many other unobserved factors that may have led to a residual gap besides labor market discrimination, such as differences in unobserved human capital. One way to proxy for unobserved human capital is to use the Armed Forces Qualifying Test or its precursor, the Army General Classification Test (AGCT) (Neal and Johnson 1996; Collins and Wanamaker 2017; Hilger Reference Hilger2016). In Figure 7, we show that the Mexican American AGCT score distribution lies between the African American and non-Mexican white distribution. On average, Mexican Americans scored 0.6 standard deviations below non-Mexican whites but 0.8 standard deviations above African Americans.Footnote 30 This group ordering is consistent with the mobility gaps we found earlier, which suggests that unobserved human capital differences partially explain the difference in mobility rates. However, we cannot include AGCT directly as an explanatory variable in the 1940 data due to limited sample sizes. Differences in human capital may come from differences in schooling quality, which has been shown to be important for the Black–white gap (Carruthers and Wanamaker 2017; Collins and Wanamaker 2017); future research could attempt to quantify the importance of schooling quality for Mexican Americans, to the extent that such schooling records exist.
DIFFERENCES IN ARMED GENERAL CLASSIFICATION TEST (AGCT) SCORES
Notes: The AGCT is a precursor to the more well-known Armed Forces Qualification Test. The test aims to measure the intelligence of recruits and has been used as a proxy of ability in the economics literature (Neal and Johnson 1996; Carruthers and Wanamaker 2017). There are 187,112 non-Mexican white Americans, 18,288 African Americans, and 2,302 second- and third-generation Mexican Americans.
Source: Linked sample of WWII records to the 1930 Census.

DISCUSSION OF THE EVOLUTION OF ECONOMIC GAPS OVER THE TWENTIETH CENTURY
If labor market discrimination or institutional barriers held back Mexican progress in the past, it is possible that progress is faster today since some barriers fell after the extension of civil rights protections (Hilger Reference Hilger2016). One way to compare historical mobility to modern-day mobility is to re-estimate Mexican mobility in the National Longitudinal Survey of Youth or Panel Study of Income Dynamics, but there are too few Mexican Americans in these surveys for reliable estimates. Fortunately, modern-day estimates of Mexican American mobility are possible with 1997–2015 tax records, which document that second-generation Mexicans had a positive mobility gap relative to the U.S.-born white population (Abramitzky et al. Reference Abramitzky, Boustan, Jácome and Pérez2019).Footnote 31 This result contrasts with the negative gap we find between 1910 and 1940. Therefore, it appears that there was a large change to intergenerational mobility for the Mexican-origin population across the twentieth century.
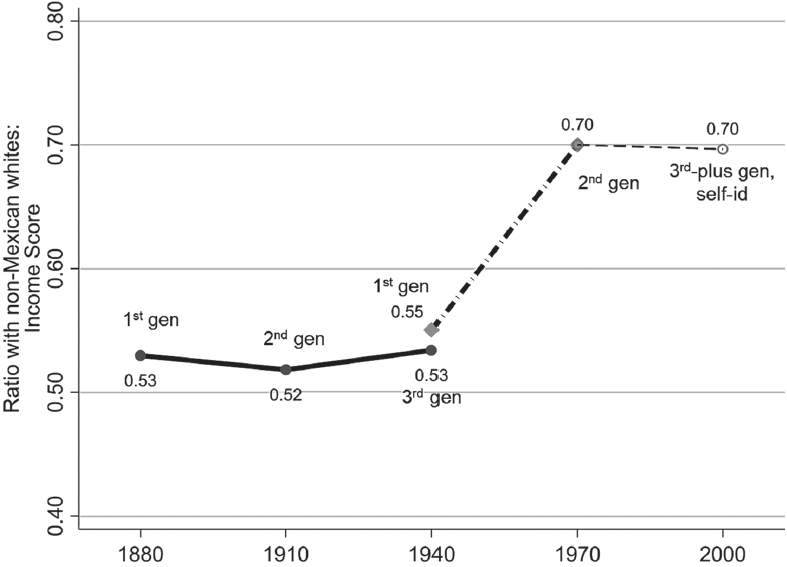
However, modern-day estimates of income mobility may differ from our historical estimates of income score mobility. To address this issue, we estimate Mexican American generational progress between 1880 and 2000 with repeated cross sections, where economic status is consistently imputed by occupation, race/ethnicity, and region.Footnote 32 To do so, we take 30- to 44-year-old male outcomes from the 1940 Census for the first generation, the 1970 Census for the second generation, and the 1998–2002 CPS for the third-plus generation (we refer to the 1998–2002 period as year 2000).Footnote 33 For the CPS data, we can only identify the third-plus generation as those who are native born to two native born parents and who self-identify as Mexican. As noted, this method leads to bias from ethnic attrition and from lumping the third generation with higher-order generations (Duncan et al. Reference Duncan, Grogger, Leon and Trejo2020).
In Figure 8, we show that Mexican generational progress was more rapid between 1940 and 2000 than between 1880 and 1940. Progress was more rapid in the sense that there was actual progress; while we estimate zero convergence between 1880 and 1940, the more recent cohort improved from an income score ratio of 55 percent in 1940 to 70 percent in 2000. A major difference between the cohorts appears to be convergence between the first and second generations, which took place for the modern-day cohort but not for the historical cohort. Second-generational gains are consistent with the positive mobility gap found in Abramitzky et al. (Reference Abramitzky, Boustan, Jácome and Pérez2019). A stronger gain for the second generation today is also consistent with a rising return to English fluency, since the second-generation often acquires fluency in youth (Abramitzky et al. Reference Abramitzky, Boustan and Eriksson2020; Ward Reference Ward2020a). Beyond the second generation, however, the data suggest that Mexican American progress stalled. Stalling is a common finding in the literature (e.g., Portes and Zhou Reference Portes and Zhou1993); however, recall that the modern third-generation estimate is downwardly biased due to ethnic attrition (Duncan et al. Reference Duncan, Grogger, Leon and Trejo2020).
MEXICAN AMERICANS HAVE SMALLER GAPS TODAY THAN IN THE PAST
Notes: The sample is 30- to 44-year-old males to make the comparison consistent across time. Income scores are used throughout, which are estimated based on the average income within occupation/region/(race/ethnic) cells. The third generation in 1940 is identified with grandparent’s country of birth in our linked data, but the third-plus generation in 2000 is identified with the Hispanic self-identifier (thus, the “self-id” label). We cannot separate third from third-plus generation in 2000 since we do not observe grandparental birthplace.
Sources: 1880, 1910, 1940, and 1970 Censuses and the 1998–2002 CPS (Ruggles et al. Reference Ruggles, Flood, Goeken, Grover and Meyer2019).

Due to faster generational assimilation for modern-day Mexicans, the gap for third-generation Mexicans is smaller in 2000 than in 1940. We find a 27.5 percent wage income gap for the third-plus generation in 2000, which contrasts with a 50 percent wage income gap in 1940 (note that this is only estimated for wage workers). Further, we find a 1.3-year education gap in 2000, which is smaller than the 3.3-year gap in 1940 (6.3 vs. 9.6 years). A larger educational gap in the past is even more striking considering that the base level of education was about four years lower in 1940. Taking the income score, wage income, and education gaps together, third-generation Mexican Americans are more economically assimilated today than they were prior to WWII. This evidence suggests that opportunity is more equal for Mexican Americans than in the past, which may be due to the fall of structural barriers to progress, such as school desegregation and stronger anti-discrimination laws.
CONCLUSIONS
We use new data from full-count censuses between 1880 and 1940 to estimate the economic progress of Mexican Americans. We find that first-generation Mexicans held jobs that were lower paying than those held by non-Mexican whites but that paid more than those held by African Americans. These relative gaps (based on estimated income scores) persisted strongly between 1880 and 1940 with little to no convergence. By 1940, third-generation Mexican Americans had 3.3 fewer years of education; further, wage workers had about half the wage income of non-Mexican whites. The educational deficit further persisted to the great-grandchildren of the first generation. For those who grew up in the same areas of the country, about one-third of the Mexican/non-Mexican-white income score gap can be explained by observable childhood conditions. However, there remains an unexplained differential.
Our approach to decomposing the wage gaps includes numerous observables, but there is still more to be done. In particular, we do not observe health or education quality differences between Mexican, non-Mexican Black, and white Americans. For instance, Carruthers and Wanamaker (2017) argue that much of the Black–white wage gap may be due to variation in schooling inputs across Black and white schools, which may provide a fruitful avenue for future research on Mexican Americans. There is also evidence that infant mortality rates were much higher for Mexican Americans than for non-Mexican whites in the early twentieth century, perhaps indicating poor health conditions at the start of life (Gratton and Merchant 2016). Besides differences in human capital, another margin of research would be to understand why Mexicans and their descendants were reluctant to move to better opportunities outside of the American Southwest, opportunities that were important for moving upward in the income distribution for African Americans (Collins and Wanamaker 2014).
Whatever the reasons are for the historical gaps between Mexican, non-Mexican white, and African Americans, documenting the gap for Mexican immigrants over time and across generations is an important first step to a greater understanding of the migration history between the United States and Mexico. Despite the lack of the usual suspects to explain the lack of Mexican convergence today, such as large networks and undocumented status, Mexican Americans still lagged non-Mexican white Americans; however, there were stronger structural barriers to Mexican American progress in the form of exclusion from public goods and discrimination. Across-generation convergence has improved over time: today, second-generation Mexicans from poorer households have higher upward mobility rates than U.S.-born whites. Thus, one should keep in mind that while the “American Dream” or “El Sueño Americano” may be fading for non-Mexican whites, it is likely becoming brighter for Mexican Americans.