Introduction
Agriculture is the largest consumer of freshwater as the production of food, feed and fibre accounts for 0.70 of freshwater use throughout the world (Hoekstra and Mekonnen, Reference Hoekstra and Mekonnen2012; FAO, 2017). Within the agricultural sector, livestock production accounts for approximately 0.27 of total agricultural water use (Mekonnen and Hoekstra, Reference Mekonnen and Hoekstra2011) and is expected to increase as demand for meat is projected to double from 2000 to 2050 (Steinfeld et al., Reference Steinfeld, Gerber, Wassenaar, Castel, Rosales, Rosales and de Haan2006). Livestock production has a significant water use impact across the agriculture supply chain as an estimated 0.98 of livestock products water use is from grains used in livestock feed (e.g. maize and soybeans; Mekonnen and Hoekstra, Reference Mekonnen and Hoekstra2010). Countries whose economy depends on the maintenance and growth of beef cattle supply chains are likely to threaten the sustainability of water resources based on the suggestion by Legesse et al. (Reference Legesse, Ominski, Beauchemin, Pfister, Martel, McGeough, Hoekstra, Kroebel, Cordeiro and McAllister2017) that within the livestock sector, beef cattle production has the most substantial consumption of water resources. In 2015, the United States Geological Survey estimated that U.S. livestock consumed approximately 7.5 billion m3 of water per day (<0.01 of total U.S. freshwater withdrawals) (Dieter et al., Reference Dieter, Maupin, Caldwell, Harris, Ivahnenko, Lovelace, Barber and Linsey2018). Additionally, Rotz et al. (Reference Rotz, Asem-Hiablie, Place and Thoma2019) estimated that the United States' blue water footprint (WF) for cattle ranges from 102 to 14 771 litres blue water/kg carcass weight (CW), suggesting that livestock water use intensities vary between states and regions, especially those with higher densities of livestock.
The United States is one of the top four most significant exporters of beef in the world (FAO-UN, 2016). As of July 2018, U.S. beef exports reached 279 million pounds, a 17% increase from 2017 (Ha, Reference Ha2018). Economically, cattle production is one of the most important sectors within the United States that contributed approximately $78 billion of gross income in 2015 alone (USDA-NASS, 2016). However, consumer perception of agricultural production has increased public pressure for sustainable water use across the agricultural supply chain. It has been linked to purchasing decisions (Aivazidou et al., Reference Aivazidou, Tsolakis, Vlachos and Iakovou2018). Market demand and social pressure have the potential to impact U.S.’ states with large cattle production sectors that include California, Kansas, Nebraska, Oklahoma and Texas. These states account for 0.50 of all U.S. beef cattle and calf production (Mcbride and Mathews, Reference Mcbride and Mathews2011; USDA-NASS, 2019). The U.S. beef industry's definition of sustainability is the ability to meet the growing demand for beef by balancing environmental responsibility, economic opportunity and social diligence (Rotz et al., Reference Rotz, Asem-Hiablie, Dillon and Bonifacio2015; Tedeschi et al., Reference Tedeschi, Muir, Riley and Fox2015, Reference Tedeschi, Almeida, Atzori, Muir, Fonseca and Cannas2017a, Reference Tedeschi, Fonseca, Muir, Poppi, Carstens, Angerer and Foxb). Concerns of water use sustainability make the quantitative assessment of the WF from beef production critical. However, current documentation of U.S. beef production provides a wide range of WF estimates.
Hoekstra and Hung (Reference Hoekstra and Hung2002) coined the term ‘water footprint’ to provide an analogy to the well-known ‘carbon footprint’ metric that provides a measurement of impact on the environment. The water footprint assessment (WFA) is the total direct and indirect water used to create a final product [e.g. beef (litres H2O/kg)]. The WFA has three defined categories: (1) green water is the water received from precipitation and stored in the soil which is available for plant physiological processes; specifically, evapotranspiration (ET); (2) blue water is the water available in surface/groundwater sources taken for use such as irrigation, cattle drinking, washing, cleaning, cooling and chemical mixing processes and (3) grey water is the water required to dilute the pollutants leaving the production area to a level similar to the pollutant concentration in the draining waterbody (Hoekstra et al., Reference Hoekstra, Chapagain, Aldaya and Mekonnen2011; Hoekstra and Mekonnen, Reference Hoekstra and Mekonnen2012). Since the development of the WFA, many improvements and variants of the WFA have been developed to capture the WF of livestock.
Typical beef cattle production within the United States can be categorized into three distinct phases cow-calf, stocker or backgrounding, and finishing or feedlot (Herring, Reference Herring2014; Kannan et al., Reference Kannan, Osei, Gallego and Saleh2017; Tedeschi and Fox, Reference Tedeschi and Fox2020). Total water-use varies in each phase of production as cow-calf and stocker operations typically use less blue and grey water than the feedlot phase (Parker et al., Reference Parker, Perino, Auvermann and Sweeten2000; Mekonnen and Hoekstra, Reference Mekonnen and Hoekstra2012). More specifically, these first two feeding phases are mostly dependent on green water from rainfed grass and hay. In comparison, the feedlot diets are composed chiefly of feedstuffs from cultivated crops, which, if grown under irrigation, will use high amounts of blue water at a regional and local level (Heflin, Reference Heflin2015). Conversely, non-irrigated dryland agriculture utilizes higher proportions of green water. Despite various attempts to apply some form of WFA to account for livestock water use, significant discrepancies, interpretability and usefulness limit the impact of WFA to guide policy and long-term management decisions that promote U.S. beef cattle sustainability. Menendez et al. (Reference Menendez, Atzori and Tedeschi2020a) developed the conceptual dynamic-mechanistic framework to address the challenges of estimating a daily beef water footprint (WFB) in Texas. Their study completed steps one and two of the system dynamics (SD) methodology to prepare a conceptual dynamic model framework for mathematical formulation. This process included articulating the problem (step 1) of estimating a WFB, which includes describing what contributes to beef cattle water uses throughout the supply chain to identify key variables. Critical variables like feed and water intake, growth and production phases were connected in a causal loop diagram, which provided the conceptual structure of the main feedback linkages between key variables, required prior to model formulation with equations (step 2).
Therefore, the objective of this study was to formulate fundamental equations into the Texas Beef Water Footprint model (TXWFB) that estimates a Texas WFB, allows users to evaluate assumptions and parameters of current methodologies, identifies water-use inefficiencies and provides policy recommendations for sustainable beef cattle water-use. In this study, step three of the SD methodology, model formulation, is described, the specific equations and stock and flow diagrams are reported that represent the three major phases of Texas beef cattle production.
Materials and methods
Study area
A vast majority of Texas lies within the Southern Great Plains of the United States and is characterized by 12 different ecoregions (Fig. 1). In general, Texas cattle progress from smaller cow-calf operations in the temperate/sub-tropical southeastern regions to larger feedlot operations in the semi-arid regions of the northwest. Ecoregions along this gradient contain different climate patterns, soils, forage/crop production, water access and water use cost (e.g. rivers or aquifers, US$/m3; TWDB, 2017) which impacts feed and water resource availability and use and also influences producer decision making.

Model formulation
The activities to develop the TXWFB model followed Systems Thinking and SD methods outlined by Forrester (Reference Forrester1961) and Sterman (Reference Sterman2000), which is an approach well suited for complex systems with multiple production phases and stakeholders. Steps 1 and 2 of this method were completed in another dynamic WF research study (Menendez et al., Reference Menendez, Atzori and Tedeschi2020a), and the current study focuses specifically on step 3, model formulation of the TXWFB model. Systems Thinking and SD techniques have been used extensively to solve complex agricultural problems and account for feedback within a system (Turner et al., Reference Turner, Rhoades, Tedeschi, Hanagriff, McCuistion and Dunn2013; Tinsley et al., Reference Tinsley, Chumbley, Mathis, Machen and Turner2019; Menendez et al., Reference Menendez, Wuellner, Turner, Gates, Dunn and Tedeschi2020b). Accounting for feedback helps to capture the intended and unintended consequences of beef cattle management decisions associated with water use and availability. The TXWFB was formulated using the Vensim Decision Support System (Vensim DSS), a professional, visually based dynamic modelling programme.
Model development includes defining the problem and describing the system in which that problem exists – the first step. First, to articulate the problem of estimating a TXWFB, we conducted an extensive review of the literature about water use evaluation for ruminant livestock systems to form a dynamic hypothesis (step 2). The dynamic hypothesis is a concise statement of how we believe the system of beef cattle water use works and identifies the model's key variables. Key variables are the most influential variables within the system that need to be accounted for so that the model can adequately replicate the agricultural system in which the problem exists. Thus, this study utilized the existing dynamic-mechanistic structure for a daily WFB outlined by Menendez et al. (Reference Menendez, Atzori and Tedeschi2020a), which accounts for steps 1 and 2 of the SD method.
The problem articulation and dynamic hypothesis guided the TXWFB formulation process to achieve and maintain the model's intended purpose, estimation of a Texas WFB. The model formulation includes defining reference modes, model boundaries, key equations and parameters (established or estimated). Reference modes are selected historical data over some time, which the TXWFB model replicated, thereby increasing user confidence in the model. The TXWFB model boundaries represented the level of detail (data, equations, integration and spatial scale) within the Texas beef cattle system and determined the number of variables needed to replicate historical data adequately. Model boundaries also determined the required equations and parameters which were obtained from scientific literature or developed/estimated. Data and equations were integrated into Vensim DSS as stocks, flows, auxiliary, constant and exogenous input-data variables (data imported into Vensim). Stocks (level variables) represent accumulations that can be increased or decreased by flow variables (i.e. rates), which determine the rate at which stocks are adjusted (Sterman, Reference Sterman2000). Auxiliary variables allow for further adjustment of flow variables. They may incorporate known or estimated constant values (e.g. coefficients and initial values). The TXWFB model formulation continued until the proposed model was determined adequate, following modelling best practices (Sterman, Reference Sterman2000; Rahmandad et al., Reference Rahmandad, Oliva and Osgood2015), to address the problem of estimating the water-use of Texas cattle feeding operations. Model formulation and assumptions are segmented into the following submodels: (1) Texas cattle population; (2) cattle growth; (3) cattle nutrition; (4) forage and ET; (5) beef cattle WF; (6) beef cattle supply chain and (7) regional cattle water consumption (RCWC; Fig. 2).
(Colour online) Conceptual diagram of submodels within the TXWFB model. The cattle population provides a co-flow structure that drives the other submodels over time. Submodels with outputs are driven by subsequent growth-nutrition-forage and ET submodels. Arrows indicate major feedback (yellow and black double arrow) and feedforward (black and single arrow) relationships between submodels.

Texas cattle population submodel
The Texas cattle population is affected by region, market demand, climate, infrastructure and management. Regional differences in beef cattle population trends and densities are essential to understand water consumption at each phase of production. The TXWFB accounts for key variables that impact the management decisions and dynamics of individual cattle operations in each region. The model's geographic boundaries utilized the ten different climate divisions seen in Fig. 1. We used the subscript function in Vensim to simulate beef cattle population dynamics in each of the ten regions (Fig. 1). After defining spatial boundaries, the TXWFB model captured the beef cattle population dynamics with modified equations from a dynamic cattle ranch profitability model (Turner et al., Reference Turner, Rhoades, Tedeschi, Hanagriff, McCuistion and Dunn2013). The TXWFB cattle population submodel encompasses the cow-calf, stocker and feedlot phases and assumes that bull, cow, calf, weaned calf, heifer, steer and cull cattle types are in specific production phases (cow-calf, stocker and feedlot) at discrete time intervals (i.e. durations) when each cattle type is in a unique stage (Fig. 3). For example, suckling calves in the cow-calf stage remain for 6–8 months before weaning, at which point they move to the stocker stage as weaned calves until they reach 12 months of age. The population model disregards cattle breed type (Bos indicus and Bos taurus) and assumes that the total cattle population (head of cattle), of each cattle type, move synchronously and simultaneously in and out of each stage (e.g. all weaned calves to the stocker stage).
(Colour online) Panel (a) shows a simplified cow population stock and flow structure (above). Rectangles represent stocks (accumulations) which use fixed delays that hold cattle for an explicit duration (e.g. suckling and breeding durations) where outflows are only active at the end of that duration via rates (arrow-cloud-hourglass). Panel (b) reflects the discrete changes of the mature cow population between the calved cows, bred cows and bred back cows stocks to account for specific production periods. Cows only remain in the weaned cows stock for 1 day and are therefore not visible in this image. The smoothed cow population is the average yearly number of mature cows.

Cattle growth submodel
The cattle growth submodel is linked (i.e. a co-flow) with the cattle population submodel in order to capture the exact time and duration of production of the calf, weaned calf, stocker, heifer and feedlot stages enabling the TXWFB model to capture seasonal feed quality and availability (see Supplementary materials). First, calf birth weight initiates (22–48 kg; calf weight stock) at the same time as calving in the population model to represent the start of a calf being grown for consumption. The calf stock transfers the accumulated body weight (BW) representing one head of cattle to the next stage affecting the growth rate in each subsequent stock until the desired mature BW is obtained in the feedlot weight stock (e.g. 589 kg BW) at which point that accumulated weight exits the model boundary.
Cattle nutrition submodel
The nutrition submodel is affected by cattle growth and dry matter intake (DMI) and generates feedback to growth equations as nutrient type, and quality vary in terms of total digestible nutrients (TDN), digestible energy and metabolizable energy (ME; Tedeschi and Fox, Reference Tedeschi and Fox2020; see Supplementary materials). Overall, cattle nutrients (forage, feed and water) are influenced by cattle DMI, growth, and climate and contain numerous feedback mechanisms. These components are also impacted by seasonal forage availability that generates additional feedback to the type (pasture or hay) and quality of forage nutrients available for cattle consumption and growth.
Forage and evapotranspiration submodel
The majority of cattle inputs to achieve nutrient requirements and growth are endogenous within the cow-calf and stocker phases of Texas cattle production, meaning that pasture and hay resource management is a critical component. Tedeschi et al. (Reference Tedeschi, Molle, Menendez, Cannas and Fonseca2019) provide a comprehensive review of models for ruminant grazing and supplementation. The forage component in the TXWFB model is simple because its level of aggregation is considerable, at a regional level (Fig. 1). The main stock and flow structure (see Supplementary materials) is centred upon a pre-determined daily rate of forage growth (DM; kg/d) that accumulates forage biomass for a year (cool and warm season). The daily growth rate is activated or deactivated by ET bermudagrass and annual ryegrass coefficient curves (ETkc) outlined by the Food and Agriculture Organization (FAO, 2019a) to estimate blue or green water uses. Unlike estimated forage growth and ET values, the grain crop water use utilized current estimates as exogenous published inputs to determine the green and blue water usage of specific crops (Hoekstra and Hung, Reference Hoekstra and Hung2002; Xu and Wu, Reference Xu and Wu2018). This forage and ET structure was used to simulate hay production, but hay was assumed to be stored for a year and assigned an adjustable constant TDN value (e.g. 0.61) to further reflect management decisions; low, medium and high-quality hay. Therefore, the hay consumed by cattle is always from the previous year, though this storage period can be adjusted. Stored hay is a source of forage for cattle when cool and warm-season forages are not available for cattle grazing and when pasture forage is unavailable; under more extreme conditions such as drought, which enables cattle producers to sustain their cattle herds.
Droughts were captured by using regional historical values of the Palmer Drought Severity Index (PDSI; NOAA, 2019b), which indicates the severity and intensity of long-term drought on a scale from −4 to 4. Incorporation of the PDSI enabled the hay storage management decisions to feedback to cattle population levels. For example, ideal management encourages producers to store up to 1 year of hay, meaning that a drought would have to extend beyond 1 year before cattle needed to be decreased to maintain nutrient requirements (see Supplementary materials). Decreased cattle numbers alleviated competition for resources and allowed for some cattle to remain in production, assuming adequate feed is available for smaller herd sizes. Texas forage and hay production are significant consumers of water use for each phase of Texas cattle production in addition to the water use from other feedstuffs and drinking water.
Beef cattle water footprint submodel
Collectively the population, growth, nutrition and forage submodels drive the WF submodel and each cattle type. Bull, cow, heifer, calve, weaned calf, stocker and feedlot cattle types contribute to individual daily water use. Total daily water use for each cattle type only occurs when cattle are present in each stage. For example, mature cows and bulls are assumed to use water resources each day of the year, whereas new-born calves only utilize water resources after calving and before weaning. Cattle water uses include drinking and servicing water and water from crop, pasture, hay and supplementation feedstuffs. Service water (litres/cattle/day) is the amount of water required for cleaning, feed mixing, cooling, pollutant dilution, dust control and chemical mixing activities (e.g. fertilizer and pesticides) for each cattle type (e.g. stocker cattle). Pasture, hay, supplement and crop water uses were accounted for with the specific water demand (SWD; Chapagain and Hoekstra, Reference Chapagain and Hoekstra2003). SWD (m3/t) is the amount of water from plant ET (m3/ha) required to produce a tonne of forage, hay or feed (t/ha; Eqn (1) in Table 1). The TXWFB calculates a daily seasonal, and annual SWD to capture forage water use at each phase. However, the SWD of grain crops (e.g. concentrates) often comes from diverse sources (local, domestic and international) and is the aggregation of grain commodities from different years. Therefore, the SWD parameter for grains, by-products (distiller's grain), and other concentrates can be adjusted in the TXWFB model (see ‘Forage and evapotranspiration’ section).
Primary model equations (EQ) for WF, supply chain and water scarcity submodels

1Where SWD is the specific water demand (m3/t), ET is evapotranspiration (m3/ha) and Feedstuff is the total production of a particular feedstuff per unit of area (t/ha).
2Where PFU is the functional unit of the product desired reporting unit for the beef WF in LW (kg), CW (kg) or boneless beef per animal (kg), cattle weight is the LW of the cattle (kg), and X is the factor of adjustment LW to calculate PFU for LW = 1, CW = percent, boneless = percent.
3Where WFB is the beef water footprint (litres of water/kg meat), CWUTP is the total accumulated cattle water use (litres/day) of each cattle type during a single production cycle to produce a finished feedlot animal (litres) and the product is the total amount of meat (kg LW, CW, boneless) product from a single feedlot animal (kg).
4Where RCWU is regional cattle water use (m3/day), RCTWU is cattle type (bulls, cows, heifers, calves, suckling calves, stocker cattle and feedlot cattle) water use (m3/cattle/day) in each region and RCPT is the regional cattle population of each cattle type (cattle/day).
5Where ALRFW is the freshwater for Texas livestock (m3/day), AFW is the total available freshwater (m3/day) and LWC is the livestock water coefficient (%/day).
6Where RCWC is the regional cattle water consumption ratio (dimensionless/day).
7Where TCWU is the total Texas cattle water use (m3/day).
The daily water use from drinking and servicing water and feedstuffs is aggregated to represent the average for each cattle type (i.e. one animal; Fig. 4). The TXWFB produces regional cow-calf and stocker phase estimates for each of the ten unique Texas regions and then aggregates cattle designated for slaughter (i.e. meat production) to the feedlot phase in the High Plains region. Thus, the first two phases of cattle production for each region are added to the feedlot water use under environmental and SWD values for the High Plains region. For clarity, daily water use (m3/day or litres/day) is used for all water metrics in this section until the various water uses are aggregated to equal the total water used (litres/day) to produce a single feedlot animal. The daily or total water use per cattle is then divided by the daily or final live weight (LW; kg), CW (kg) or boneless beef (kg; Eqns (2) and (3) in Table 1; CSU, 2019). The TXWFB calculates a daily WF, and therefore, the last value at the time of slaughter is the final WFB for that cattle production year. Thus, the TXWFB model calculates a wide variety of product functional units (PFU) for beef to account for WFB evaluation on LW, CW and boneless beef basis. Additionally, the user can differentiate between the total for a feedlot animal and the inclusion of a mature cow's indirect water use (i.e. conception to weaning) plus that of a calf, weaned calf, stocker and feedlot animal for one finished feedlot animal or exclusion of the cow water uses (Fig. 5).
(Colour online) Panel (a) displays an example of the structure to aggregate multiple daily cattle water uses into a total daily water use for a single animal and the entire regional population for a specific cattle type (e.g. feedlot cattle). Panel (b) displays an example of the aggregated feedlot water uses (litres/day) for a single feedlot animal, three production groups of feedlot cattle.

(Colour online) Panel (a) displays an example of the daily WF stock and flow structure. Rectangles represent stocks (accumulations), all of which use fixed delays that hold cattle for an explicit duration (e.g. suckling and breeding durations) where outflows are only active at the end of that duration via rates (arrow-cloud-hourglass). Panel (b) displays the daily WF of a single animal from calving through the feedlot phase.

Beef cattle supply chain submodel
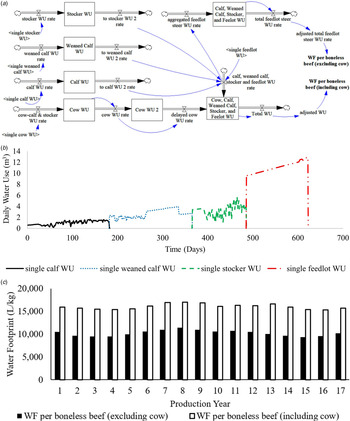
The differentiation of cattle phases (cow-calf, stocker and feedlot) and types (cow, calf, weaned calf, stocker and feedlot) was accomplished using fixed delays to aggregate cattle water uses for each production year, similar to a United States dynamic hog population model developed by Meadows (Reference Meadows1970). Since calves are produced annually, a second calf crop begins production in the beef cattle supply chain before year one calves have become feedlot animals and obtained the desired mature weight for slaughter. Therefore, cattle water uses are kept separate and only pertain to the appropriate production years in which they directly or indirectly consumed water (Fig. 6). Additionally, the cow water use is included from conception (initiation of breeding an adjustable parameter) to weaning to account for foetal and weaning calf water uses from the cow (Fig. 6).
(Colour online) Panel (a) displays an example of the cattle production chain water use stock and flow structure. Rectangles represent stocks (accumulations), all of which use fixed delays that hold cattle for an explicit duration (e.g. suckling and breeding durations) where outflows are only active at the end of that duration via rates (arrow-cloud-hourglass). Panel (b) displays the water use of a single animal designated for meat production across the production supply chain [cow calf (black), weaned calf and stocker are both considered the stocker stage (blue and green), stocker (red)]. Panel (c) displays the WF of a calve designated for beef production with and without the associated water cost from conception to weaning across 17 production years (i.e. 17 production cycles).

Regional cattle water consumption submodel
The water use of each cattle type (e.g. a single weaned calf) was multiplied by the estimated number of that cattle type population within each region at a given time to determine total daily beef cattle water use (Eqn (4) in Table 1; Fig. 7). The total daily beef cattle water use of each region was then aggregated to give a total beef cattle water use for the entire state of Texas (Eqn (5) in Table 1). The daily cattle water use per region was subtracted from the estimated available freshwater for each region for cattle (e.g. <1.6%; TWDB, 2017) including water from aquifers [million cubic metres (MCM)], conservation storage (MCM; reservoirs) and surface water (MCM; Eqns (4) and (5) in Table 1; TWDB, 2019). However, the total direct and indirect Texas cattle water use does not truly reflect the instantaneous water uses from forage or grain crops grown at earlier times. There is a delay between the production of those crops and the indirect use of cattle, assuming that plant growth occurred in the same region as the cattle were grown. Division of the total regional cattle water use (m3/day) by the regionally available water for livestock results in a RCWC ratio (Eqn (6)). The RCWC provides a balancing behaviour to the cattle population submodel, which increases the number of calves sold when water becomes scarce using a cattle water availability lookup function (i.e. adjustable parameter). Water use from cattle that experience mortality (e.g. the calf death rate in the population submodel) is accounted for through the incorporation of cattle types and quantities in the dynamic cattle population submodel which captures the actual water uses of cattle products that were intended for the market but never reached completion (slaughter). For example, a feedlot animal that died a day before slaughter has consumed resources until that point and therefore is a waste of virtual and direct water resources. Aggregation of each region's total beef cattle water use resulted in the total daily Texas water use per region (Eqn (7) in Table 1).
(Colour online) Panel (a) displays an example of the stock and flow diagram for regional and state water use. Rectangles represent stocks (accumulations) and the arrow-cloud-hourglass symbols represent the inflow and outflow rates from stocks. Panel (b) presents the quantities of the stocks and the regional cattle water consumption ratio over a 17-year simulation. The initial water for regional water for livestock was 3 billion m3.

Model calibration and sensitivity analysis
The formulation of each submodel resulted in a working dynamic TXWFB model that generated appropriate numerical values and behaviour to simulate the Texas beef cattle production chain and produced daily and annual WFB estimates. The TXWFB was used to replicate previously published beef WF estimates reported by Chapagain and Hoekstra (Reference Chapagain and Hoekstra2003; CH2003) for grazing and industrial systems over 36 months that produced 400 and 454 kg LW cattle, respectively. A sensitivity analysis of published SWD parameters from the CH2003 study was performed, 1000 scenarios, to assess the TXWFB model calibration. Furthermore, the TXWFB was evaluated by creating two CH2003 scenarios, grazing and industrial, that kept the CH2003 LW, drinking, service and SWD feed values but used Texas environmental data and production phases (i.e. cow-calf, stocker and feedlot). The CH2003 grazing and industrial scenario results were then compared to TXWFB grazing (400 kg LW) and industrial (454 kg LW) scenarios with regionalized Texas parameters for pasture, forage and crop production (ET and drought), diet/phase/region (cow-calf, stocker and feedlot). The two TXWFB scenarios used median published SWD feed values and no service water. The grazing and industrial CH2003 and TXWFB scenarios were then analysed in R software (R Core Team, 2019, version 3.6.2) using a paired t-test (P < 0.050) to evaluate differences between grazing and industrial scenarios.
Results
Model formulation resulted in the successful development of seven different submodels that simulated how the Texas beef cattle supply chain and water use function in reality. The submodel development included stock and flow structures and simulation of key variables for each of the ten regions and aggregated key variables at a state level.
Texas cattle population submodel
The Texas cattle population stock and flow structure captured the discrete movement of unique cattle (e.g. mature cow and feedlot cattle) type at and within different phases (cow-calf, stocker and feedlot; Fig. 3 and Supplementary materials). The Texas cattle population model was used as input and produced a co-flow that guided the cattle growth submodel for each production year.
Cattle growth and nutrition submodels
The cattle growth submodel captured the cattle weight of animals designated for beef production or rebreeding within a stock and flow structure (Fig. 3 and Supplementary materials). Cattle growth (kg) was simulated until the desired mature weight was achieved, and then the stock of accumulated LW left the system for each production cycle. Cattle growth was successfully linked to nutrition variables within the model structure. Growth drove the DMI equations, and the subsequent net energy (NE) equations drove shrunk BW gain for the calf, weaned calf, stocker, feedlot and replacement heifer cattle types. The impact of climate was also captured using the current effective temperature index (CETI) in the cattle nutrition submodel, and simulations of nutrition components were produced with the TXWFB model. The cattle nutrition and climate factors were linked to the drinking water structure and simulated drinking and service water estimates for each cattle type and within each stage (Fig. 4).
Forage and evapotranspiration submodel
Forage nutritional quality parameters were integrated into the nutrition submodel parameters, which impacted the growth rates of cattle consuming forages (see Supplementary materials). Forage growth, ET and SWD stock and flow structures were constructed and simulated daily SWD values for pasture and stored hay and daily and annual forage growth.
Beef cattle water footprint and beef cattle supply chain submodels
The water uses from each cattle type within each production phase were captured in the model structure, and the TXWFB model simulated water use estimates for individual cattle (e.g. feedlot animal; Fig. 4) and the total population (all feedlot cattle; Fig. 4). Aggregated cattle water use values were parameterized within the daily WF and beef cattle supply chain stock and flow structures (Figs 4 and 5) with different PFUs (i.e. LW, CW and boneless beef). The TXWFB model simulated a daily WFB (Fig. 5) and a WFB with and without the inclusion of the mature cow water use (Fig. 6(a)).
Regional cattle water consumption submodel
The summation of the individual regional cattle water uses was integrated into a regional water balance stock and flow structure (Fig. 7). The parameterization of regional water available for livestock and livestock use dynamics simulated stocks of available water, total aggregated regional and Texas beef water use and a RCWC ratio. The cattle water consumption ratio successfully simulated the relationship between regional cattle water use with the population model (i.e. balancing action to the population if water levels became scarce).
Model calibration and sensitivity analysis
The TXWFB model was successfully calibrated with parameters from the CH2003 model WFB estimates. The CH2003 model published WFB estimates for beef cattle with a 36-month lifespan and were 11 915 m3/t (0.4 t LW) and 9636 m3/t (0.545 t LW) for grazing and industrial systems, respectively. The TXWFB model replicated these exact CH2003 WFB values for both grazing and industrial beef cattle systems. The sensitivity analysis of the calibrated TXWFB model produced reasonable WFB results of the possible range of WFB values, ranging from 7500 to 22 500 m3/t (Fig. 8). The CH2003 scenarios (i.e. CH2003 parameters used in the TXWFB model structure, D.F. = 29) resulted in means of 6019 (σ = 755, s.e. = 183) and 6272 (σ = 550, s.e. = 133) m3/t for grazing and industrial, respectively. The TXWFB predictions, TXWFB scenarios, resulted in means of 2054 (σ = 191, s.e. = 46) and 3726 m3/t (σ = 284, s.e. = 69) for grazing and industrial systems and were 66–41% less than the CH2003 scenarios, respectively; significantly different (P < 0.050).
(Colour online) The WF estimates produced by the TXWFB using the CH2003 model parameters (single blue line) and sensitivity analysis of SWD (m3/t feed) parameters. The sensitivity analysis encompassed ranges for both grazing and industrial CH2003 SWD parameters. Metrics reported in litres of water/kg LW and are equivalent to m3/t.

Discussion
Texas cattle population submodel
The TXWFB population submodel formulation and simulation results (Fig. 3) were similar to other dynamic population models that account for specific animal types and production phases in natural wildlife (Grant et al., Reference Grant, Pedersen and Marin1997) and managed systems (Turner et al., Reference Turner, Rhoades, Tedeschi, Hanagriff, McCuistion and Dunn2013). For example, Meadows (Reference Meadows1970) modelled the United States hog population, and Ford (Reference Ford2010) simulated the Kaibab deer population using a dynamic stock and flow structure with continuous population levels. The TXWFB differs slightly in that the cattle population is modelled discretely for each cattle type and phase. Continuous modelling empties or fills a stock over some time and, depending on the order of the delay (nth order delay), creates a distribution; in some instance's fractional values (e.g. fractional animals) until the stock reaches zero.
Conversely, discrete modelling empties or fills a stock at an instantaneous time and maintains whole numbers (Fig. 3). Discrete modelling of the population was essential to use a co-flow structure to capture the average growth for an exact time (e.g. seasonal climate), cattle type (e.g. calf) and production phases (e.g. cow-calf) within the beef cattle production chain. Oscillations across long-term cattle population trends (millions of cattle) results were caused by a delayed feedback response to environmental changes (drought) and management decisions (pregnancy rates) across the supply chain to maintain a stable beef cattle supply (Fig. 3; Conrad, Reference Conrad2004). Therefore, the population model formulation and simulation results appropriately captured the Texas beef cattle system in order to account for specific intervals (durations and production delays) of growth for unique cattle types across the cow-calf, stocker and feedlot production phases, in addition to modelling the entire Texas beef cattle population from 2000 to 2017.
Cattle growth submodel
The co-flow from the population submodel drove the cattle growth stock and flow structure in the TXWFB model (Fig. 3 and Supplementary materials). Many models to estimate cattle growth (kg/day) exist and take into consideration different factors such as breed type, climate, environmental conditions (e.g. mud or humidity) and utilize a wide array of empirical, probabilistic, deterministic and mechanistic equations (Oltjen et al., Reference Oltjen, Bywater, Baldwin and Garrett1986; Leon-Velarde and Quiroz, Reference Leon-Velarde and Quiroz1999; Tedeschi et al., Reference Tedeschi, Molle, Menendez, Cannas and Fonseca2019; Reference Tedeschi, Fox and Guiroy2004; Tedeschi, Reference Tedeschi2019a, Reference Tedeschib; Tedeschi and Menendez, Reference Tedeschi, Menendez, Bazer, Lamb and Wu2020). Baudracco et al. (Reference Baudracco, Lopez-Villalobos, Holmes, Comeron, MacDonald, Barry and Friggens2012) predicted LW weight and body condition score change of dairy cows using the e-Cow model that incorporated genetic influences. Similarly, Ruelle et al. (Reference Ruelle, Delaby, Wallace and Shalloo2016) estimated individual cow performance, using a daily time step, with the herd dynamic milk model. The TXWFB utilized a dynamic structure with a daily time step to estimate the daily change in LW but simplified the influences of daily growth to environmental conditions (i.e. CETI) and quality of nutrients [i.e. net energy for maintenance (NEm) and TDN]. This structure allowed reasonable estimates to be simulated and maintained a focus on interrelationships (feedback) from the environment and management decisions for multiple production years.
Additionally, instead of one, particular, cattle type (Bos indicus or Bos taurus) or breed, the TXWFB model captures the impacts of growth from one specific stage to another (e.g. calves to stockers) including spatial changes across Texas in relation to advancement in the supply chain. Cattle weight simulation results indicated that the simulation of individual production stages allows for a more detailed analysis of cattle performance; time required to reach the desired slaughter weight of approximately 400–650 kg LW. This formulation allows differences in management strategies and environmental conditions to be identified within and across regions and production years. The TXWFB simulation results captured the relationship of daily weight gain with climate and feed quality that adjusted the duration an animal was in each production stage (e.g. days on feed) and consequently total resource use at each cattle phase and spatially explicit region unique to WFA WFB methods.
Cattle nutrition submodel
Growth dynamics in the TXWFB model were linked to the nutrition model, and feedback existed between these two structures. Tedeschi et al. (Reference Tedeschi, Molle, Menendez, Cannas and Fonseca2019) provide a comprehensive review of nutrition models for grazing and feedlot ruminants and identify the commonalities and differences in parameterization, application and synthesis of results. Since growth and nutrition for cattle go hand in hand, most mathematical nutrition models that simulate cattle growth include nutritional components, though degrees of complexity and aggregation differ. Hoch and Agabriel (Reference Hoch and Agabriel2004) evaluated the impact of nutrition on beef cattle growth and body composition for different animal types with a mechanistic dynamic model. This study used ME as a primary input to drive the synthesis of NE, proteins and lipids, similar to the TXWFB model, that used Ruminant Nutrition System (RNS) equations to calculate the NE for growth, NE for maintenance, feed for maintenance, feed for growth, requirements for maintenance, intake and DMI. However, the TXWFB maintains a high level of aggregation when applying mechanistic equations within a dynamic model contrasted with the Hoch and Agabriel (Reference Hoch and Agabriel2004) study that includes more detailed calculations of carcass/non-carcass tissue synthesis and degradation; water, ash, proteins and lipids. Similar to the growth results, the nutrition results indicate that unique differences of NE intake (e.g. ~5–25 Mcal/day) and drinking water (e.g. ~0–80 litres/day) for each production phase can be identified due to the structure that integrates delayed impacts of climate on nutrition (CETI) and DMI (e.g. 0–15 kg/day; see Supplementary materials).
Moreover, the TXWFB model has the functionality to utilize pre-existing feed libraries, which improves the user interface to simulate various diet compositions. The use of feed libraries is common in cattle nutrition models (CSIRO, 1990, 2007; Fox et al., Reference Fox, Tedeschi, Tylutki, Russell, Van Amburgh, Chase, Pell and Overton2004; NASEM, 2016; Tedeschi and Fox, Reference Tedeschi and Fox2020). Additionally, the NASEM (2016) provides empirical equations to estimate and quantify key nutrient components such as NE required for growth and maintenance for a wide range of animal types, conditions and nutrient quality (TDN). The TXWFB used the RNS (Tedeschi and Fox, Reference Tedeschi and Fox2020) and the NASEM (2016) empirical and mechanistic equations in the nutrition submodel formulation which made them dynamic and allowed these static nutrient quality values (feed library) to be used in simulations for specific cattle types, daily and avoided unnecessary computational complexity.
Forage and evapotranspiration submodel
Nutrition considerations for cattle growth are linked to the availability and quality of standing and stored forage. Thornley (Reference Thornley1998) described detailed calculations for forage growth models. Additionally, Menendez et al. (Reference Menendez, Wuellner, Turner, Gates, Dunn and Tedeschi2020b) described a dynamic forage and crop growth model that represents landscape-scale plant growth over an extended period; ~100 years. The TXWFB model minimized the detail of the forage growth characteristics, such as accounting for the many forage species that exist within the Texas landscape (Berdahl and Redfearn Reference Berdahl, Redfearn, Barnes, Nelson, Moore and Collins2007; Redfearn and Nelson, Reference Redfearn, Nelson, Barnes, Nelson, Collins and Moore2003). The regional scale of the TXWFB model required a high level of aggregation to capture regional trends and ET demands to calculate growth (~0–20 000 kg/ha) and guide the length of the cool and warm growing season (<365 days; see Supplementary materials).
Similarly, Tinsley et al. (Reference Tinsley, Chumbley, Mathis, Machen and Turner2019) described a closed cattle and forage system of a typical Hawaiian island through the development of a dynamic model. This study and the TXWFB model both use climate to drive forage dynamics but the former study concentrated on cattle forage use such as overstocking and palatability in times of drought, while the latter does not capture limitations of forage but emphasized water use levels from ET of forages based on daily climate conditions (i.e. SWD of forage and stored hay). The TXWFB model advances WFB accounting for daily fluctuation of green and blue water uses (m3/t) for pasture and hay production and this model formulation allows stored hay water costs to be accounted for after a storage delay; managers store hay until pasture forage becomes limited. Green and blue crop water uses (m3/t) formulation results (Fig. 4) allowed for a more detailed analysis of daily crop water uses and revealed the extreme sensitivity of the WFB to crop SWD values over time (Fig. 8). Thus, the TXWFB forage and ET submodel were aggregated for the intended scope of the problem of forage water use, in addition to alteration of crop water use values, and simulation results indicated that the parameters were able to estimate daily values; a novel contribution to current WFA methods.
Beef cattle water footprint submodel
The WFB is the combination of the daily and total weight of the animal (weight submodel) with the aggregated daily water uses (Figs 3–5). The model parameters allowed for a daily WF to be calculated (Fig. 5). Contrastingly, the first animal WF study by Chapagain and Hoekstra (Reference Chapagain and Hoekstra2003) calculated a WF using averaged values that did not account for the variation of drinking and feed requirements of unique animal types. Additionally, the TXWFB resolves spatial concerns of local beef cattle production (Doreau et al., Reference Doreau, Corson and Wiedemann2012) and advances static WFB calculations, such as the application of the life cycle assessment (LCA; Kannan et al., Reference Kannan, Osei, Gallego and Saleh2017; Rotz et al., Reference Rotz, Asem-Hiablie, Place and Thoma2019, Reference Rotz, Asem-Hiablie, Dillon and Bonifacio2015) into a dynamic context to capture feedback within and across the beef cattle supply chain for unique cattle types (Fig. 6). The structure of the model allows for published parameters and equations to be integrated into the model structure without significant changes in formulation. The TXWFB functionality enables published parameters, equations and indices from various WFB methodologies to be entered into the model to evaluate differences such as the use of two different cattle voluntary water intake equations. For example, Atzori et al. (Reference Atzori, Canalis, Francesconi and Pulina2016) developed an alternative for green water use, WF net, which suggests improvements in livestock efficiency may reduce the WFB by approximately 50%. Moreover, the TXWFB water footprint submodel was parameterized in such a way as to be able to capture a daily and total WF with many different PFUs (e.g. LW or boneless beef) which resolved challenges in current WFB units reporting (Legesse et al., Reference Legesse, Ominski, Beauchemin, Pfister, Martel, McGeough, Hoekstra, Kroebel, Cordeiro and McAllister2017; Figs 4 and 5). The daily WF provides a means of evaluating individual phases (e.g. cow-calf) of the cattle production chain in specific regions to provide baseline WFB measurements and identify areas for improvements in water use efficiencies (Fig. 6).
Beef cattle supply chain submodel
Explicit cattle production cycle WFB (e.g. year one feedlot animals) were captured in the TXWFB model by integrating the daily water use and cattle weight gain submodels into a supply chain submodel structure (Figs 6(a) and (b)). Beef cattle WFB supply chain results showed that variation existed across years (Fig. 6(c)), which indicated that although production parameters are similar that regional production water use efficiency, from climate, altered annual WFB estimates. Furthermore, the TXWFB model allows for individual regions to be assessed to identify current specific regional and cattle phase WFB sustainability levels and opportunities for improvement (Fig. 6). Recently, the FAO (FAO, 2016) published guidelines for the environmental performance of large ruminant supply chains that utilized the LCA and emphasized the need to account for the diversity of cattle production systems and their outputs around the world. The TXWFB emphasized Texas conditions, and therefore needed to be robust enough to capture regional differences, mainly climate and accounted for specific durations (delays) of each cattle phase and region.
The TXWFB also aggregates livestock water use for more than only the calf that is intended for slaughter by, using the supply chain structure, accounting for cow-water use from conception to weaning (indirect water use) in the WFB estimate (i.e. WFB with or without indirect cow water use; Fig. 6(c)). However, the FAO (2016) indicates that a minimum of 12 months should be used to capture all life stages of an animal and this segmenting of life stages has varied between the many WFB assessment protocols (Ridoutt and Pfister, Reference Ridoutt and Pfister2013; Legesse et al., Reference Legesse, Ominski, Beauchemin, Pfister, Martel, McGeough, Hoekstra, Kroebel, Cordeiro and McAllister2017; Philipp et al., Reference Philipp, Putman and Thoma2019). The TXWFB model structure and simulation results indicated that the model provides additional functionality to WFB assessment and uses real-time climate data to enhance the daily variation in cattle demands within interacting regions of the beef cattle supply chain.
Regional cattle water consumption submodel
The impacts of the beef cattle supply chain water use affected regional water availability, and considerations of water scarcity were captured in the regional water submodel structure (Fig. 7). Concerns over the scale of assessment range from local applications of livestock WFA and water scarcity (Doreau et al., Reference Doreau, Corson and Wiedemann2012; Boulay et al., Reference Boulay, Bare, Benini, Berger, Lathuillière, Manzardo, Margni, Motoshita, Núñez, Pastor, Ridoutt, Oki, Worbe and Pfister2018). Ford (Reference Ford2010) and Grant et al. (Reference Grant, Pedersen and Marin1997) described the use of dynamic population models and simulated various population scenarios that show the effect of resource limitations. Furthermore, the FAO (2019b) provided guidelines to measure the WF of livestock and water scarcity. However, the TXWFB model used the TWDB (2017) livestock water estimates to determine the amount of water available for livestock within each Texas region and then integrated population numbers, as suggested by the FAO (2019b; i.e. population model; Figs 2 and 6). The TXWFB results indicated that the total daily cattle water use provides feedback that moved cattle out of the system from the lack of water resources (Menendez et al., Reference Menendez, Atzori and Tedeschi2020a; Fig. 7). Therefore, instead of relying on water scarcity indices, the TXWFB accounts for the physical presence of daily available water in the near-real-time that it is used by livestock and assumes that all green and blue forage hay and crop water uses occurred within the same area of cattle production (e.g. the feed was grown in the same region and time).
The TXWFB model has specific limitations for each submodel due to the objectives of the overall model's purpose. The population submodel is limited in its ability to account for domestic and local imports and exports; U.S.’ states and counties. This factor is vital because cattle from other regions have accumulated virtual water uses, in areas with different water use efficiencies for inputs such as forages and crops (m3/t; Mekonnen et al., Reference Mekonnen, Neale, Ray, Erickson and Hoekstra2019). The main limitations of the weight and nutrition submodels are that the equations are at a high level of aggregation and could include more detailed growth components such as fat and protein deposition, days in milk and more accurate measurements of mature cow and bull DMI (Tedeschi, Reference Tedeschi2019b). Since the population submodel does not account for cattle grazing intensities, e.g. animal unit months (Teague et al., Reference Teague, Grant, Kreuter, Diaz-Solis, Dube, Kothmann, Pinchack and Ansley2008), there is no feedback to limit or increase forage production throughout the year and provide further insight into forage management, water use efficiencies and the associated long-term impact on the Texas WFB.
Similarly, there is no feedback to forage use and depletion during times of drought as hay is likely imported (importation of virtual water), and therefore the WFB would change green and blue water use totals (Mubako and Lant, Reference Mubako and Lant2013). Crop water use, like imported hay, is assumed to be produced in the same region as cattle, this presents a significant limitation in the current study and all other WFA methods as crops come from multiple spatial regions (e.g. grain-producing countries) and stored grain sources are a mixture of grain from multiple production years and different spatial regions (e.g. corn from 2017 and 2016 from the United States and Mexico). It is likely that the study of Xu and Wu (Reference Xu and Wu2018) on United States county-level green water use for corn, wheat and soybeans needs to be incorporated as a probabilistic-dynamic water use supply chain model to more accurately capture imported green and blue water costs and improve daily regional crop water uses; i.e. the assumption that crops are grown and consumed by cattle in the same region. The TXWFB water footprint submodel lacks specific details for many factors outlined in WFA LCA studies (Rotz et al., Reference Rotz, Asem-Hiablie, Dillon and Bonifacio2015, Reference Rotz, Asem-Hiablie, Place and Thoma2019; Kannan et al., Reference Kannan, Osei, Gallego and Saleh2017), such as fertilizer applications or cooling water use. Instead, the TXWFB model aggregates water uses into service water. The supply chain submodel negates ‘time to adjust’ variables that would provide more insight into how beef cattle managers decide to move cattle, i.e. how long it takes managers to move cattle across the supply chain (selling v. retaining; Sterman, Reference Sterman2000). The inclusion of time to adjust based on market trends, droughts and disease would increase the understanding of the mental models driving the decisions of beef cattle managers (Conrad, Reference Conrad2004). The TXWFB regional water scarcity submodel does not follow established FAO guidelines (FAO, 2019b) in the current dynamic structure but instead focuses on Texas Water Development Board estimates for the percent of the water available for livestock and measured water scarcity using published SD structures to indicate water resource limitations (Grant et al., Reference Grant, Pedersen and Marin1997; Sterman, Reference Sterman2000).
The causal link from water scarcity to the population model only impacted weaned calf sales, yet in reality, managers may choose to cull other cattle types (e.g. less productive breeding stock). Despite the limitations of the TXWFB model, the model formulation and preliminary results indicated that the model is structurally suitable for its intended purpose of estimating a Texas WFB. Moreover, model limitations present opportunities to refine and enhance future versions of the TXWFB model and possibly include other livestock (small ruminants).
Model calibration and sensitivity analysis
Despite the various submodel limitations, the entire TXWFB model (Fig. 2) calibration indicated that the CH2003 model results for grazing and industrial beef cattle production could be reliably replicated using the TXWFB model. As expected, the results also showed that the calibrated TXWFB model WFB was sensitive to changes of the published CH2003 SWD parameter values; i.e. changes to SWD values cause considerable variation in WFB estimates (Fig. 8). Moreover, the sensitivity analysis results indicated that the TXWFB model was robust under extreme conditions (i.e. 1000 scenarios of various SWD values) and produced WFB values that were normally distributed (Fig. 8). Unlike the published CH2003 WFB estimates, the TXWFB model estimates for the CH2003 and TXWFB scenarios both resulted in a greater WFB for industrial systems and a lower WFB for grazing systems. Reduced grazing WFB values align with lower water use for pasture-based grazing systems compared to industrial or feedlot systems that rely heavily on water-intensive crops. The low WF values from the TXWFB scenarios showed that there is a large amount of variability in WFA estimates depending on what virtual blue and green water uses are used and that the TXWFB was able to capture the variance between the grazing and industrial CH2003 and TXWFB scenarios (P < 0.050). Unlike any other WFA model, the TXWFB model accounts for the underlying complexity of WFB assessment by capturing the reinforcing and balancing feedback and delays between cutting-edge ruminant nutrition equations, diverse human-management decisions and available water resources, revealing long-term consequences.
The robust TXWFB model structure serves as an ideal template for the estimation of the WFB in other beef cattle producing regions throughout the world with its capability to incorporate different model assumptions, parameters and strategy decisions at a complex-systems level. Therefore, current methods available for WFA of livestock, namely beef cattle, have been advanced through the TXWFB. Expansion of critically needed WFB assessment using the TXWFB model is entirely possible since the model is readily transferable to other regions and can be scaled to a single farm or multi-state or country level. As mentioned in the Introduction, total livestock water use at a national level may seem small (i.e. 0.01). However, competition for water allocated to livestock is an important issue in regions with large livestock populations and growing water demands from other sectors (industry and urban). Achieving livestock water use sustainability and limiting the effects of competition may be achieved through further research. This research should be targeted to the potential WFB values through the evaluation of different management decisions such as forage production, diet composition, variation of nutrients and reproduction schedules (e.g. calving times). Additionally, this research should be expanded to other regions throughout the world and adjusted for other livestock species to continue to identify and reduce the livestock WF over the long-term.
Conclusion
The TXWFB model is the first to attempt to develop a WFA using a dynamic framework for each of the three major phases of the Texas beef cattle production supply chain. Unlike current WFA methodologies, the TXWFB provides a daily WFA for livestock and allows different methodologies to be evaluated. Current WFA methods are advanced by the TXWFB as it successfully incorporated WFA components into a dynamic framework and provides beef cattle stakeholders with a user-friendly tool (flight simulator) to identify water use inefficiencies across the beef cattle supply chain. Growing concern and complexity of water resource challenges require innovative approaches like the TXWFB model to account for the unintended consequences of beef cattle water use and provide a tool to develop strategies that increase Texas beef sustainability, efficiency, profitability and domestic and international competitiveness over the long term.
Supplementary material
The supplementary material for this article can be found at https://doi.org/10.1017/S0021859620000672.
Financial support
We would like to acknowledge the partial financial support by the 2017 Mini-Grant Opportunities to Enhance Teaching, Research and Extension Capacity in the Department of Animal Science, and by the NIFA Hatch funding #TEX09123 Development of Mathematical Nutrition Models to Assist with Smart Farming Sustainable Production. This work was partially supported by the National Animal Nutrition Program (NANP) to provide enabling technologies, support and shared resources to the research community. The NANP, a National Research Support Project (NRSP-9) of State Agriculture Experiment Stations, is funded from Hatch funds administered by the National Institute of Food and Agriculture, USDA (Washington, DC).
Conflict of interest
None.
Ethical standards
Not applicable.